How SPX Direction Uses Volume to Identify Institutional Participation
Contact customer support at support@spxdirection.com to get access to this add-on for Bookmap.
Core Principle:
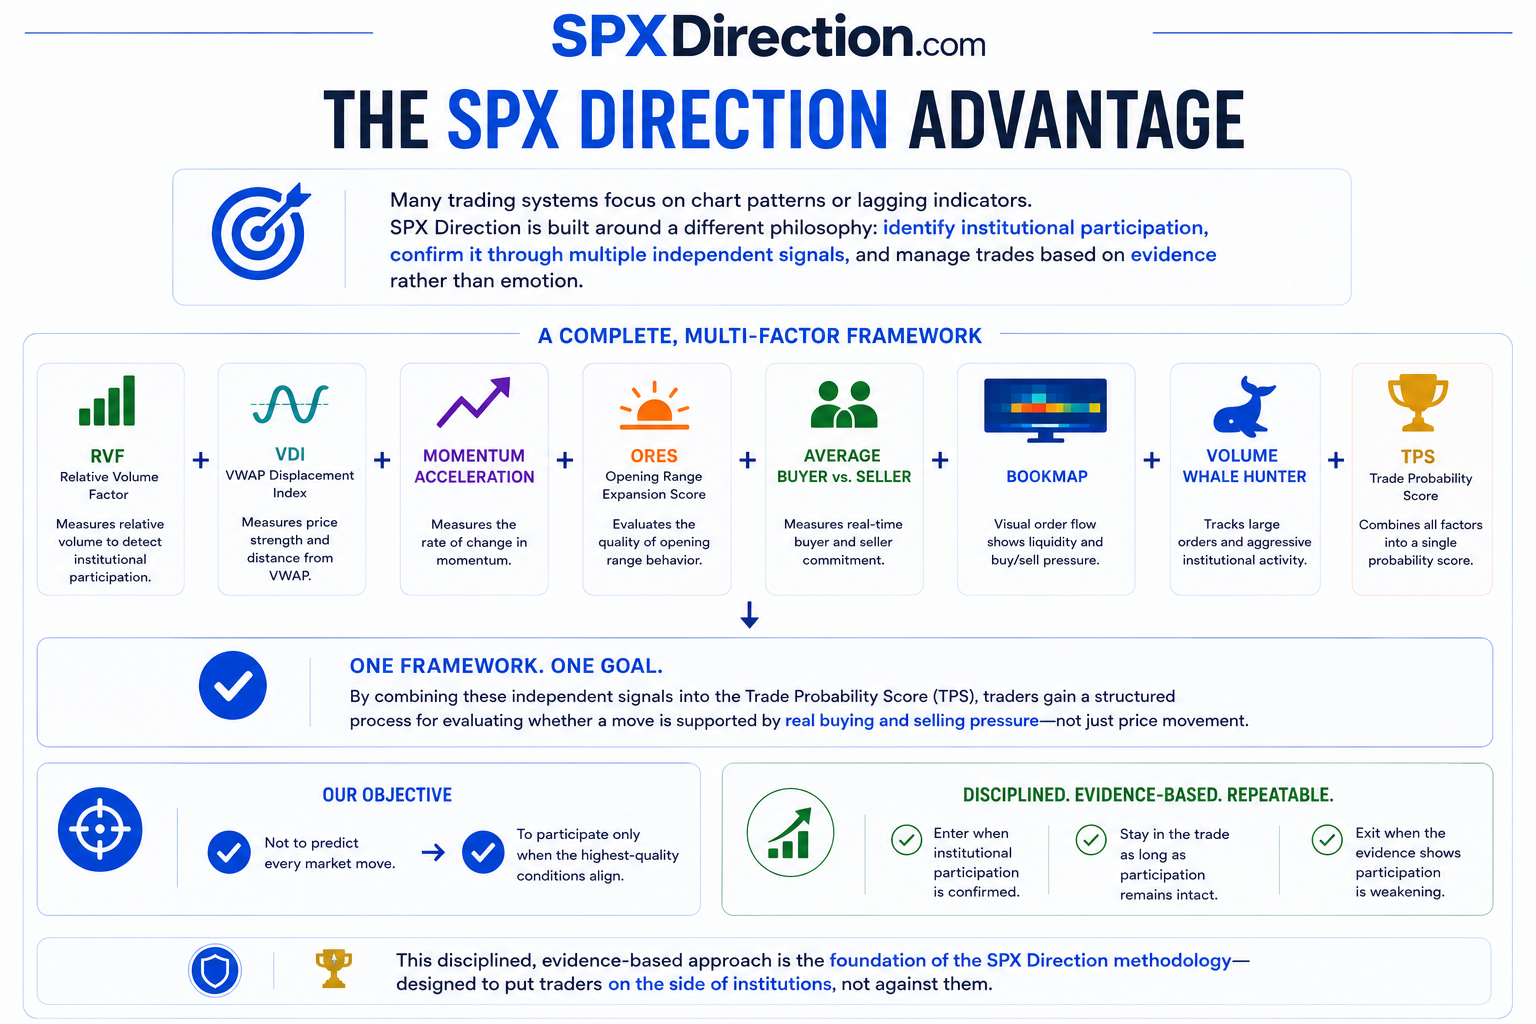
Price tells you what happened. Volume tells you who made it happen.
SPX Direction isn't designed to predict the future—it measures whether institutions are actually participating in the move.
Why Volume Matters
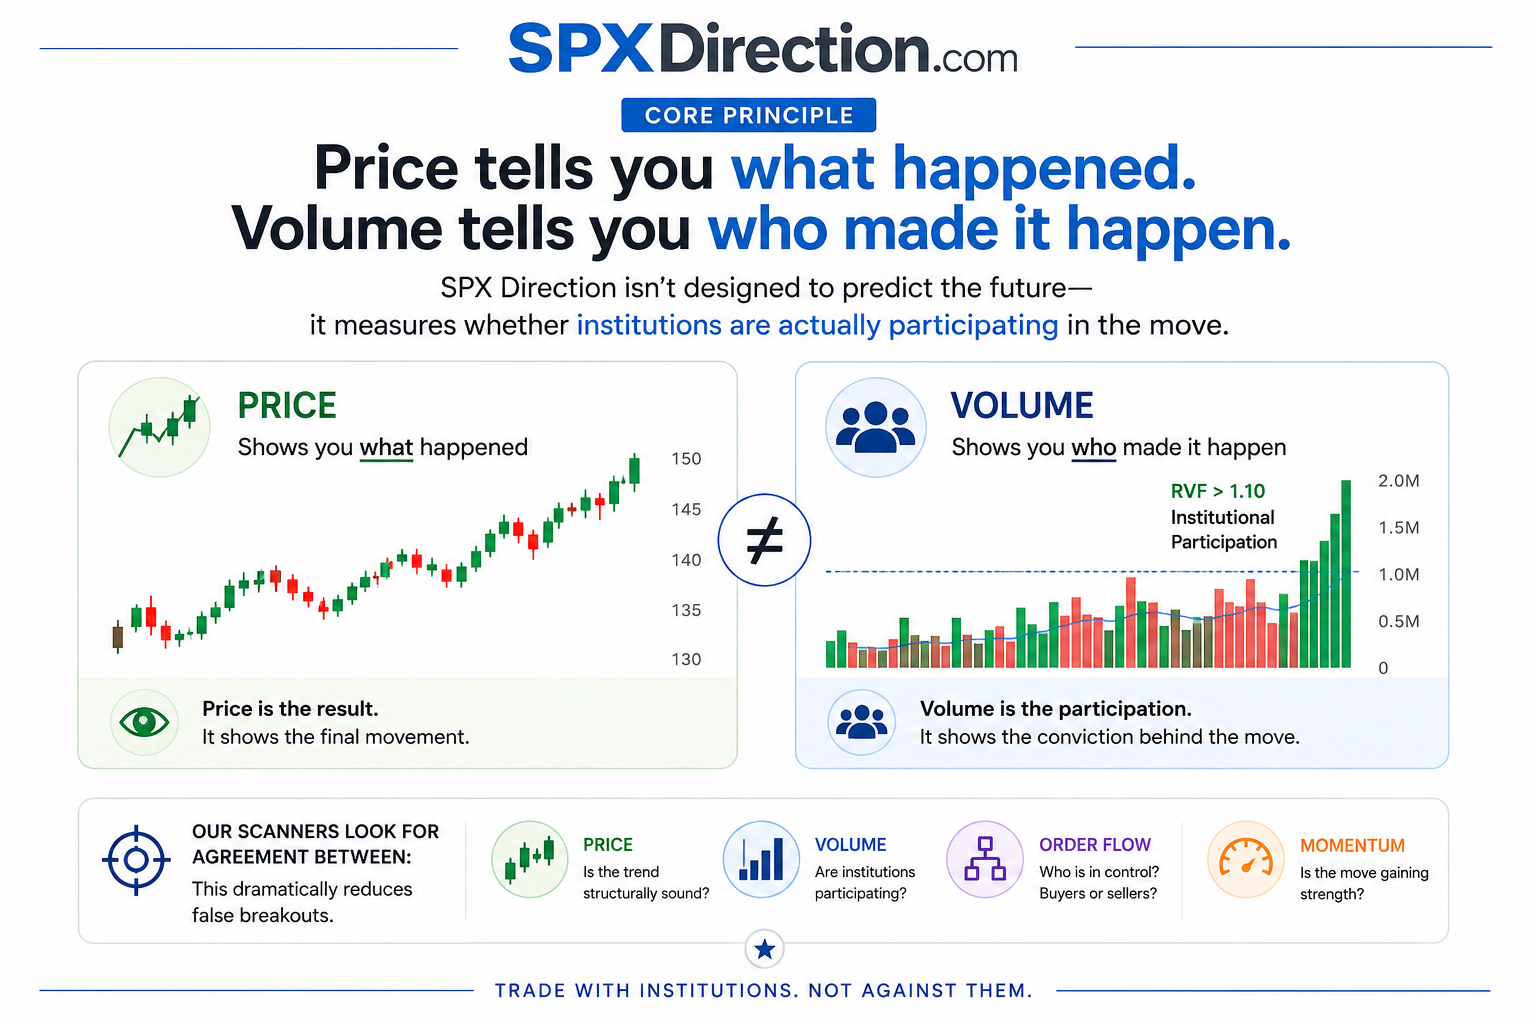
Retail traders often focus only on price.
Professional traders focus on participation.
A breakout without participation usually fails.
A breakout supported by institutional participation has dramatically higher odds of continuing.
This is exactly why SPX Direction was built around measuring institutional conviction, not simply chart patterns.
Our Core Philosophy
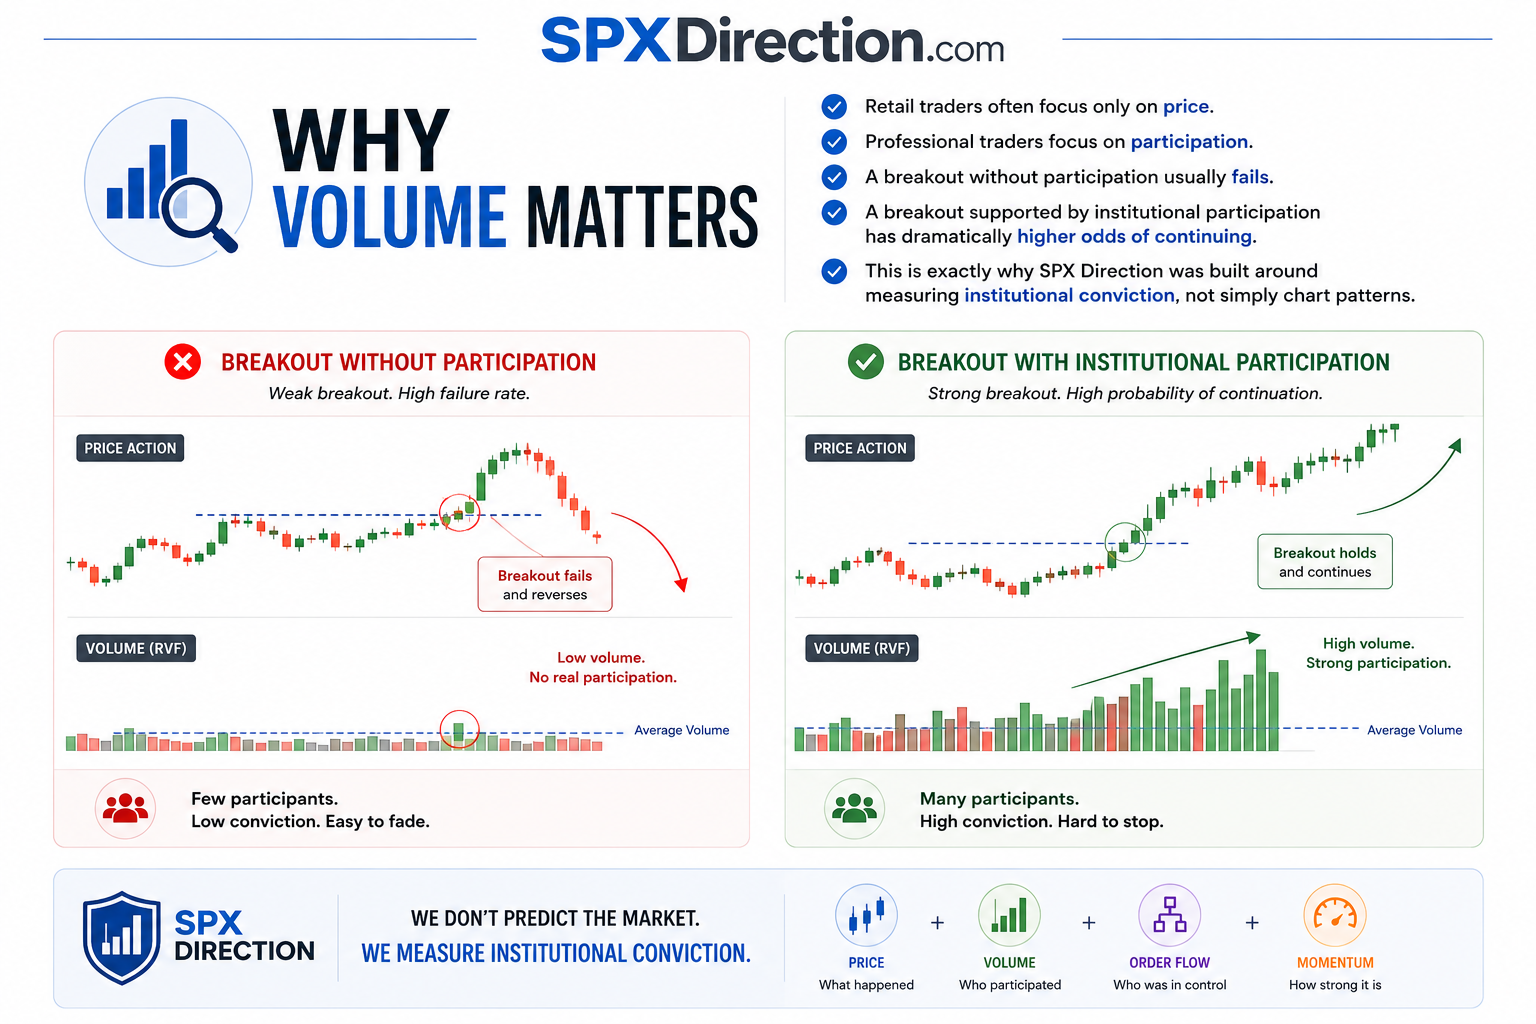
Every indicator inside SPX Direction answers one specific question.
|
|
|
|
|
|
|
|
|
|
|
|
|
|
|
|
|
|
|
|
|
Instead of looking at one piece of information...
SPX Direction combines all of them into a complete institutional picture.
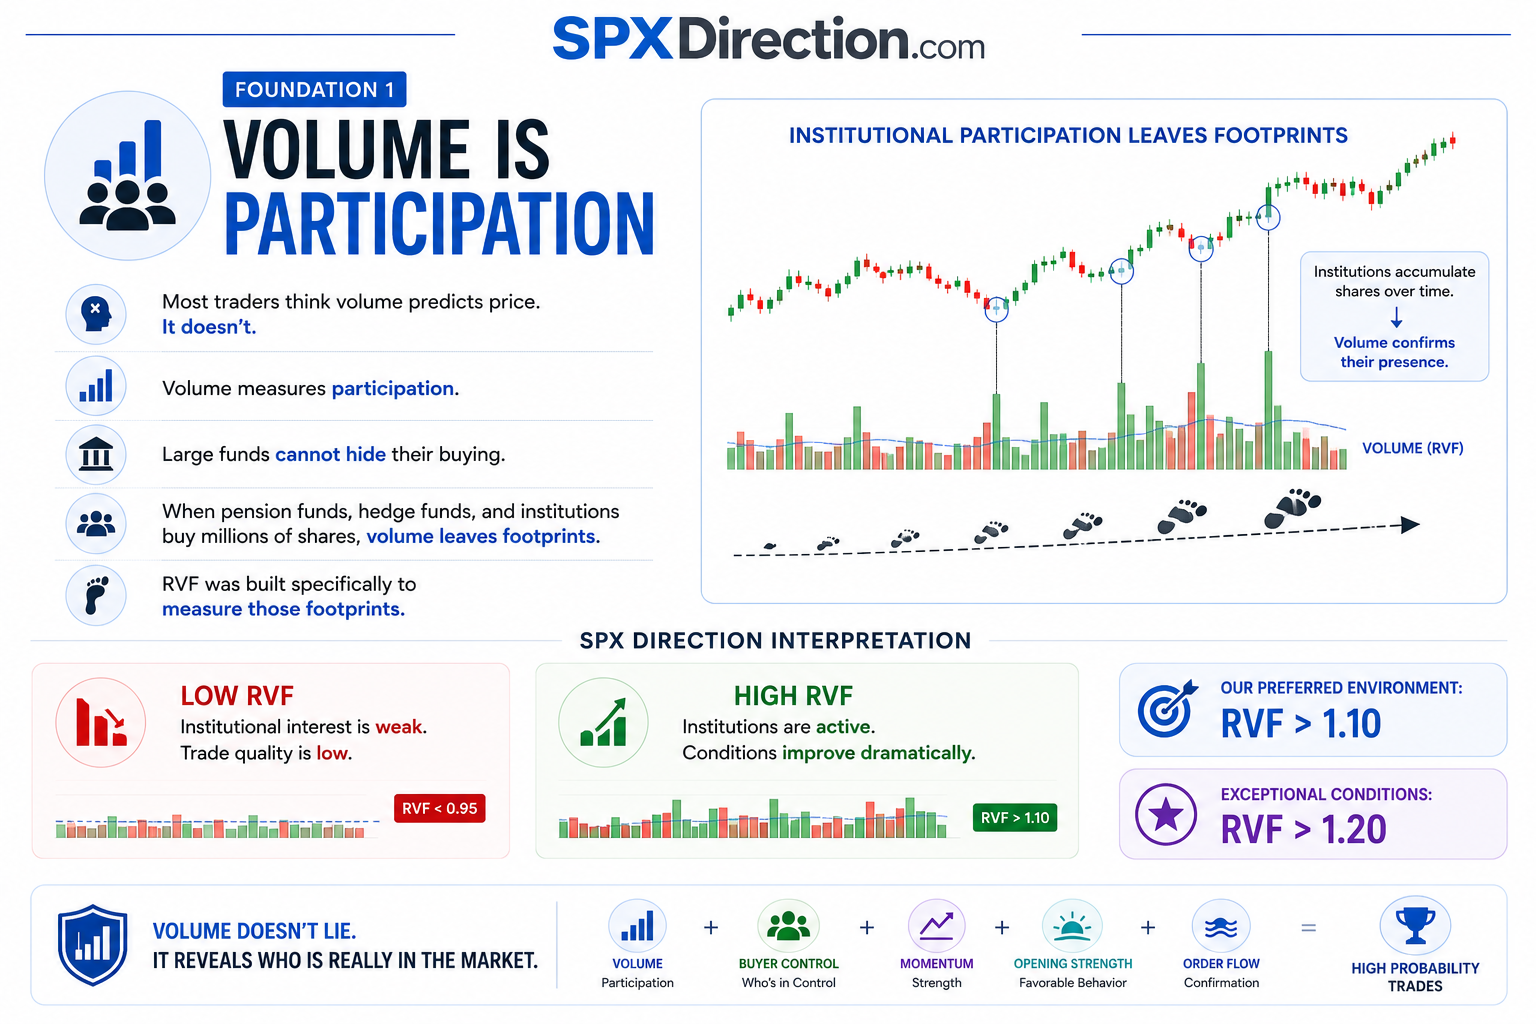
Foundation 1 — Volume is Participation
Most traders think volume predicts price.
It doesn't.
Volume measures participation.
Large funds cannot hide their buying.
When pension funds, hedge funds, and institutions buy millions of shares, volume leaves footprints.
RVF was built specifically to measure those footprints.
SPX Direction Interpretation
- Low RVF
- Institutional interest is weak.
- Trade quality is low.
- High RVF
- Institutions are active.
- Conditions improve dramatically.
Our preferred environment:
RVF > 1.10
Exceptional conditions:
RVF > 1.20
For more information about Relative Volume Factor, please click here.
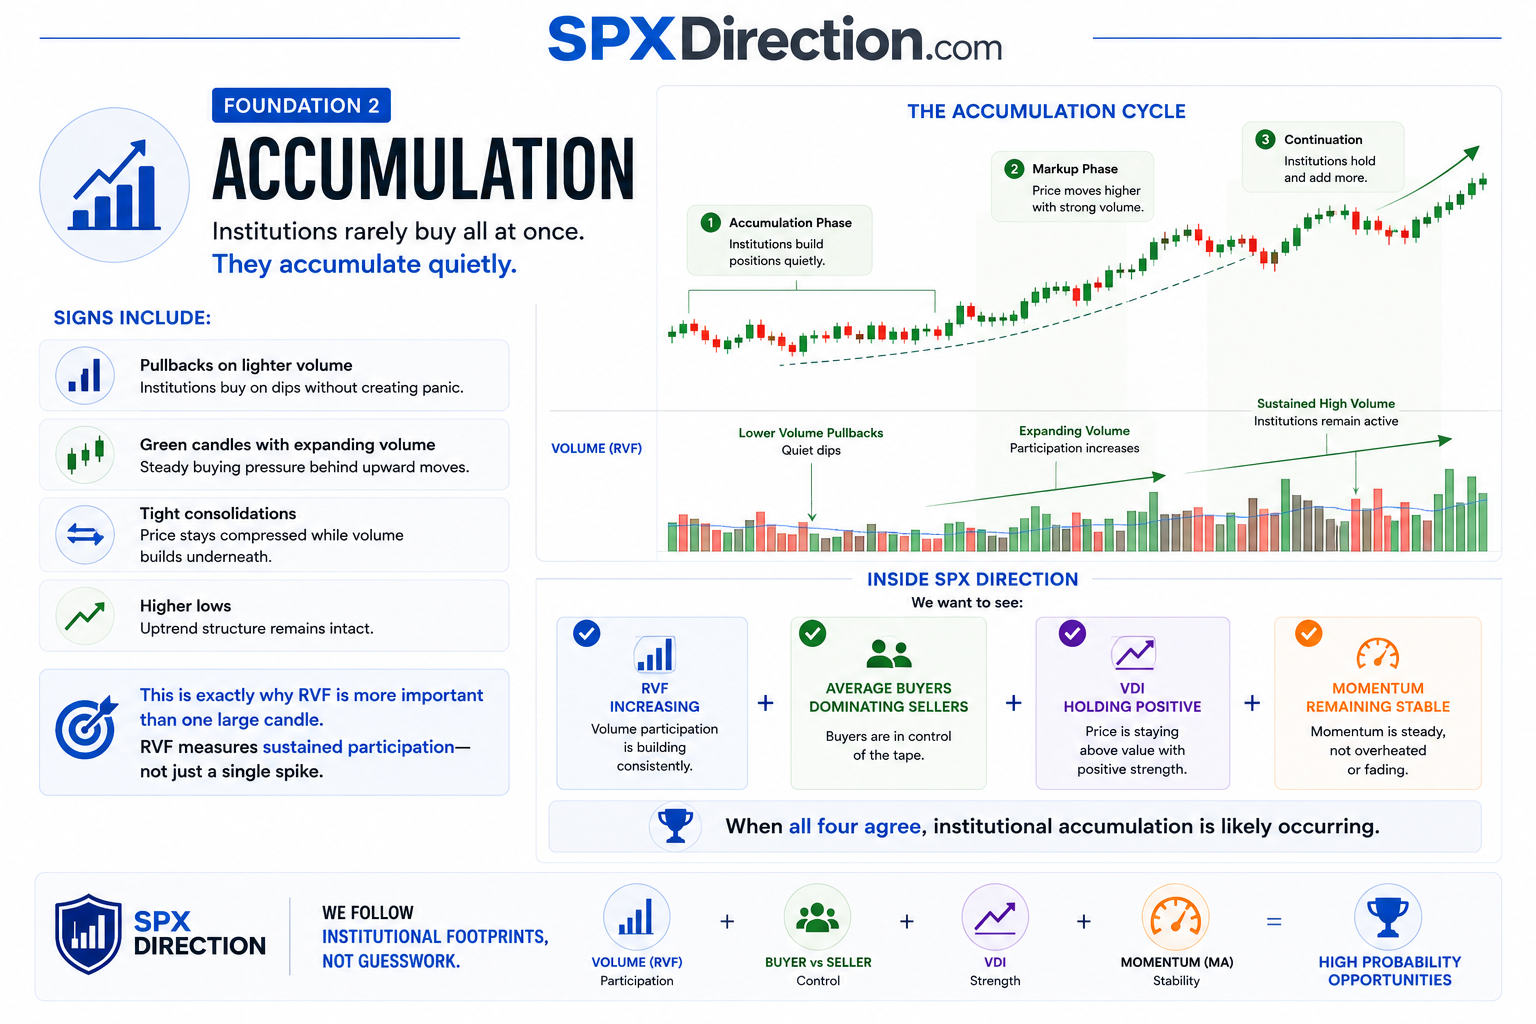
Foundation 2 — Accumulation
Institutions rarely buy all at once.
They accumulate quietly.
Signs include:
• Pullbacks on lighter volume
• Green candles with expanding volume
• Tight consolidations
• Higher lows
This is exactly why RVF is more important than one large candle.
RVF measures sustained participation—not just a single spike.
Inside SPX Direction
We want to see:
✓ Average Buyers dominating Sellers
When all four agree, institutional accumulation is likely occurring.
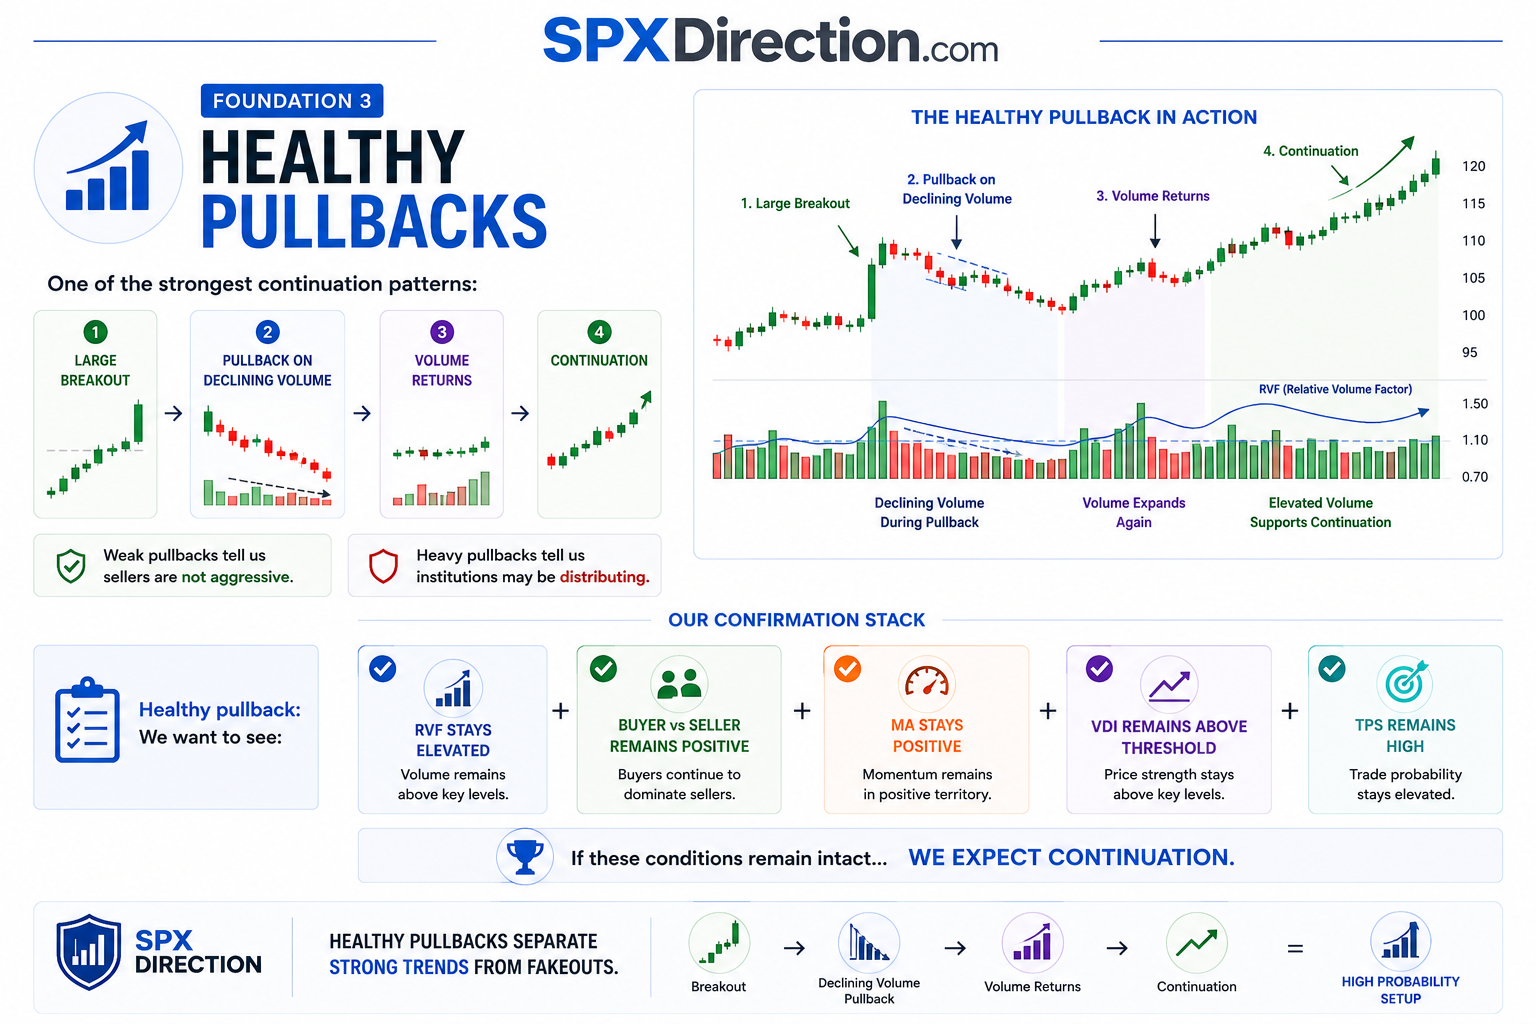
Foundation 3 — Healthy Pullbacks
One of the strongest continuation patterns:
Large breakout → Pullback on declining volume → Volume returns → Continuation
Weak pullbacks tell us sellers are not aggressive.
Heavy pullbacks tell us institutions may be distributing.
Our Confirmation Stack
Healthy pullback:
RVF stays elevated
Buyer vs Seller remains positive
MA stays positive
VDI remains above threshold
If these conditions remain intact...
We expect continuation.
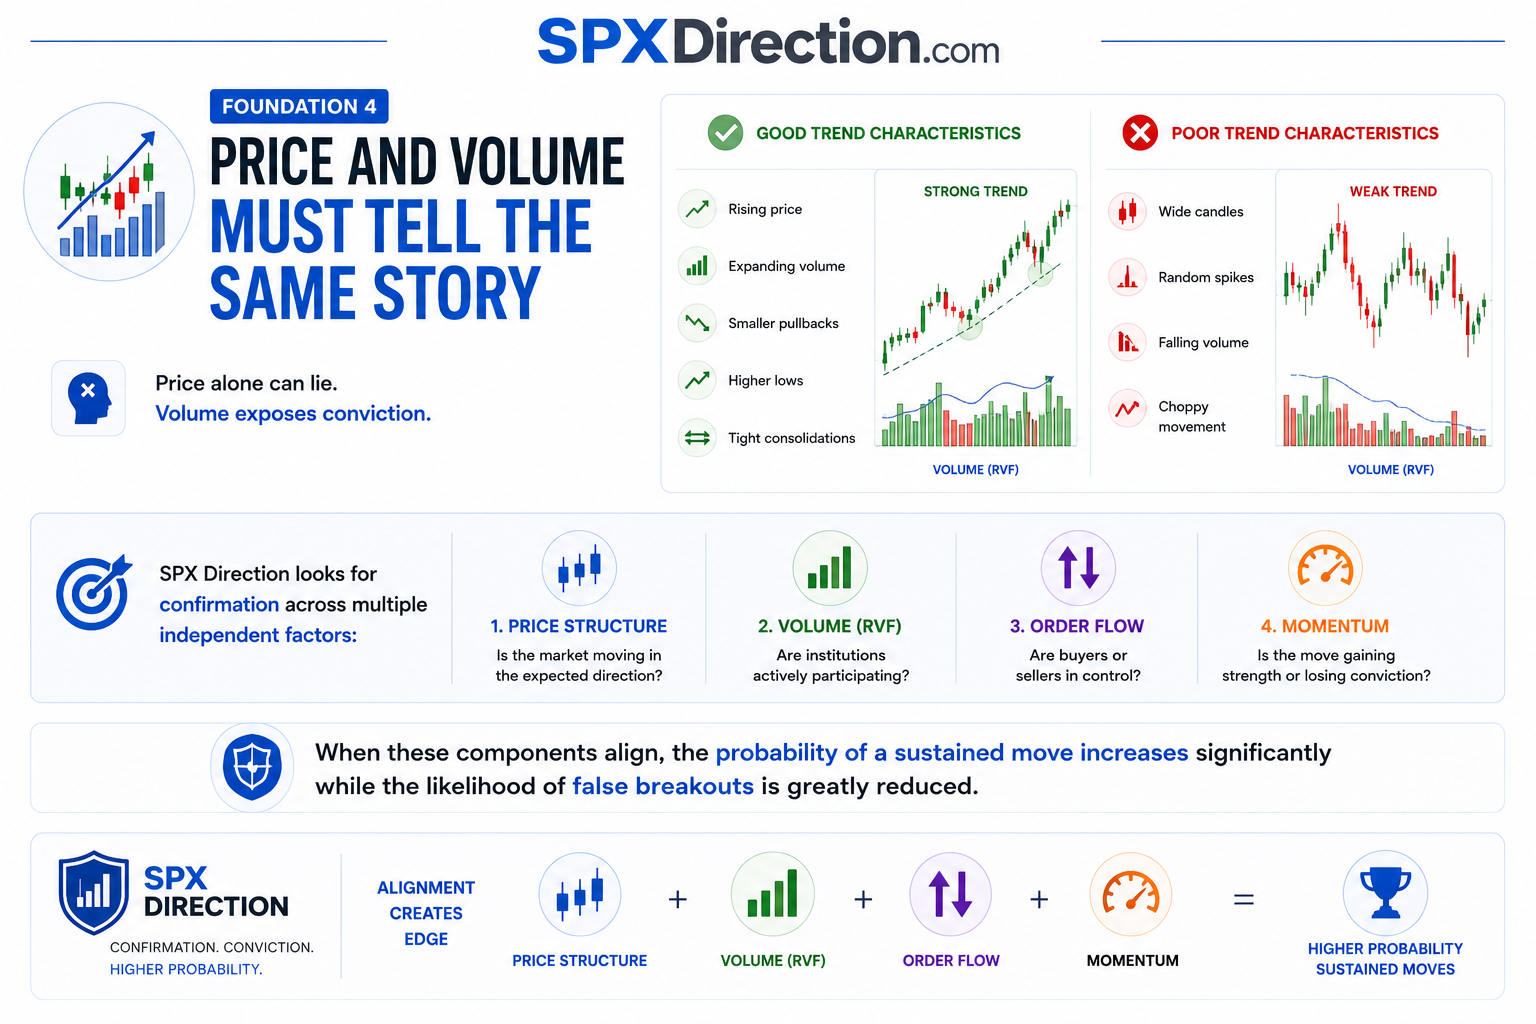
Foundation 4 — Price and Volume Must Tell the Same Story
Price alone can lie.
Volume exposes conviction.
Good trend characteristics:
• Rising price
• Expanding volume
• Smaller pullbacks
• Higher lows
• Tight consolidations
Poor trend characteristics:
• Wide candles
• Random spikes
• Falling volume
• Choppy movement
SPX Direction looks for confirmation across multiple independent factors:
- Price Structure – Is the market moving in the expected direction?
- Volume (RVF) – Are institutions actively participating?
- Order Flow – Are buyers or sellers in control?
- Momentum – Is the move gaining strength or losing conviction?
When these components align, the probability of a sustained move increases significantly while the likelihood of false breakouts is greatly reduced.
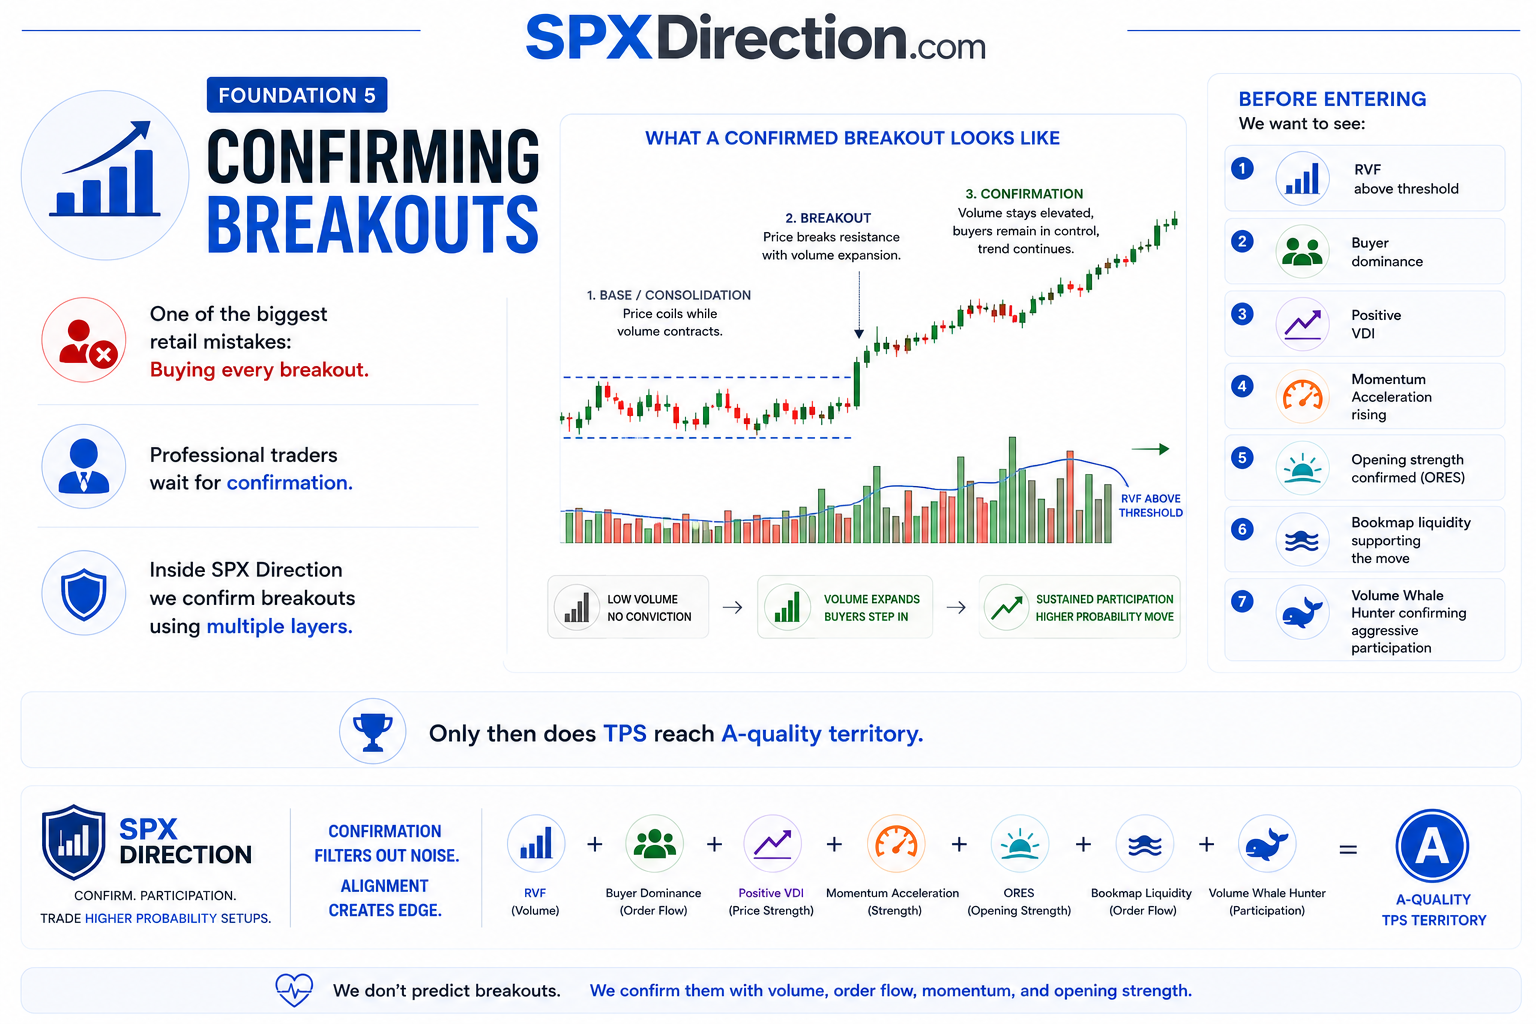
Foundation 5 — Confirming Breakouts
One of the biggest retail mistakes:
Buying every breakout.
Professional traders wait for confirmation.
Inside SPX Direction we confirm breakouts using multiple layers.
Before Entering
We want to see:
RVF above threshold
Buyer dominance
Positive VDI
Momentum Acceleration rising
Opening strength confirmed (ORES)
Bookmap liquidity supporting the move
Volume Whale Hunter confirming aggressive participation
Only then does TPS reach A-quality territory.
Foundation 6 — Entries
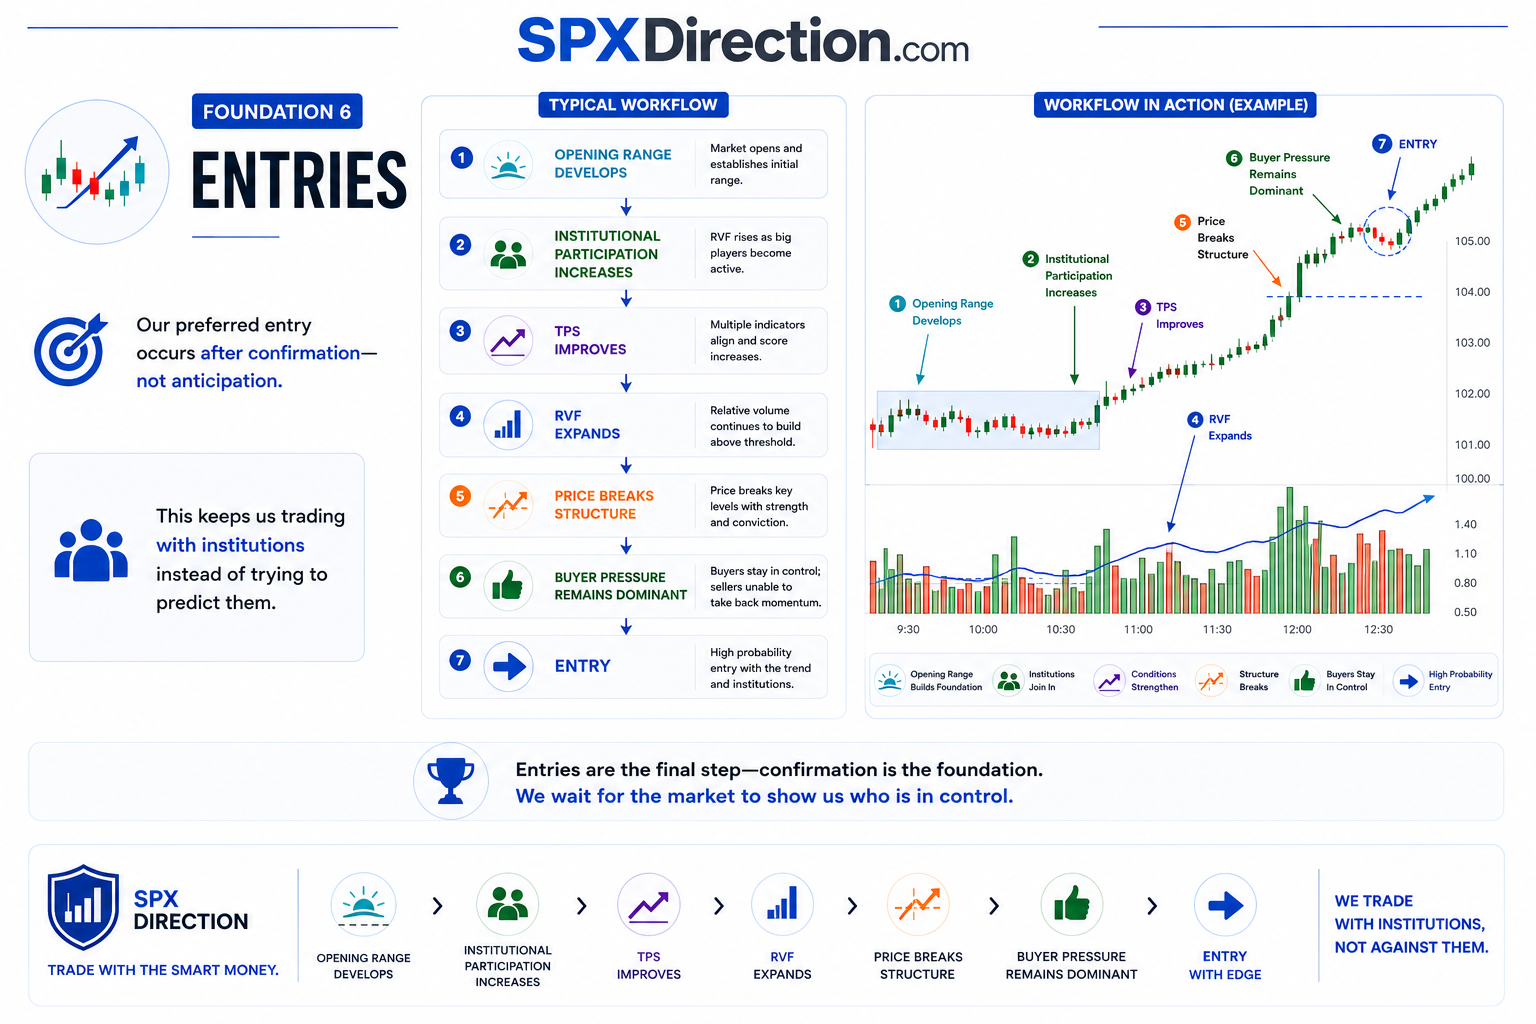
Our preferred entry occurs after confirmation—not anticipation.
Typical workflow:
Opening Range develops
↓
Institutional participation increases
↓
TPS improves
↓
RVF expands
↓
Price breaks structure
↓
Buyer pressure remains dominant
↓
Entry
This keeps us trading with institutions instead of trying to predict them.
Foundation 7 — Managing Winning Trades
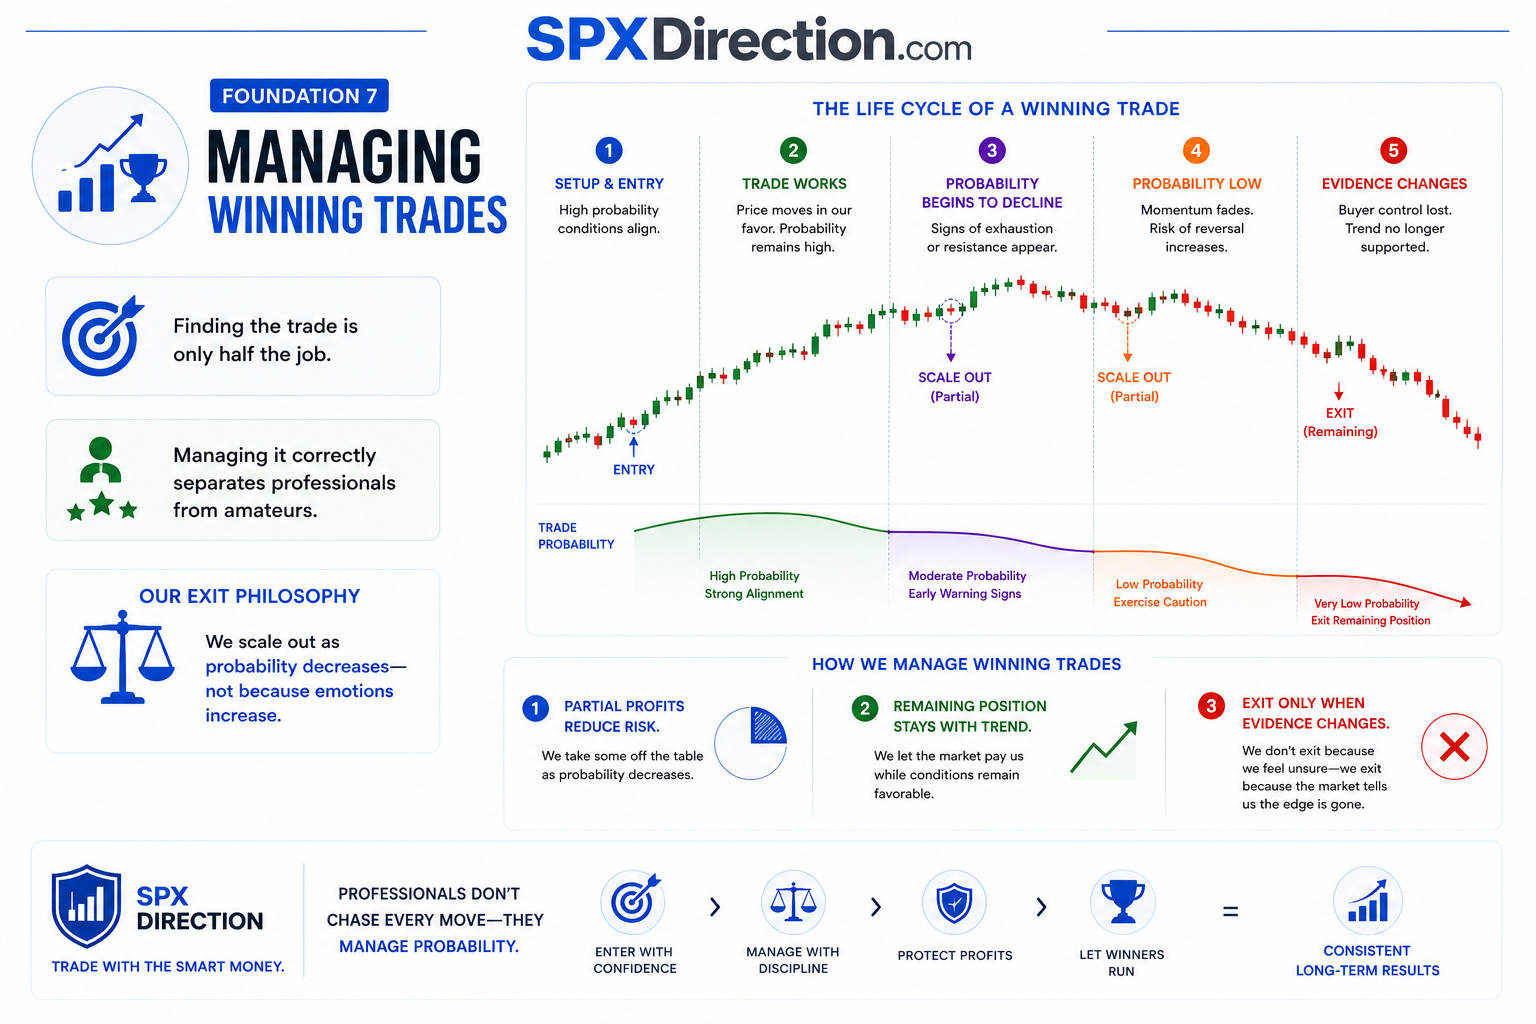
Finding the trade is only half the job.
Managing it correctly separates professionals from amateurs.
Our Exit Philosophy
We scale out as probability decreases—not because emotions increase.
Rather than exiting everything immediately:
Partial profits reduce risk.
Remaining position stays with trend.
Exit only when evidence changes.
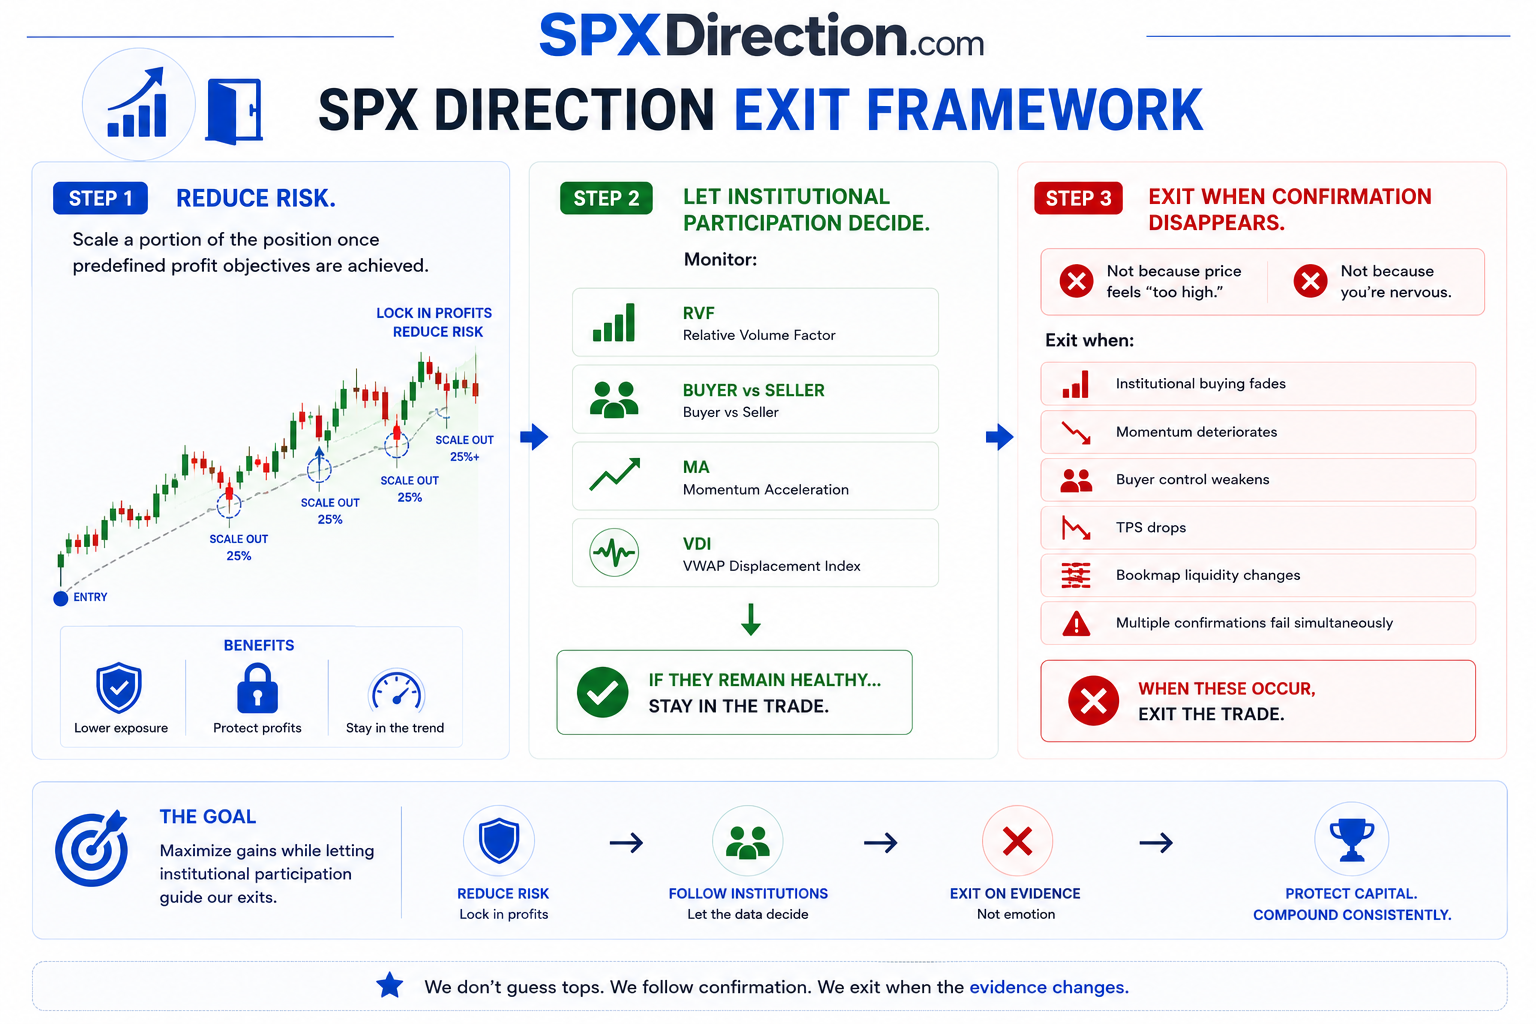
SPX Direction Exit Framework
Step 1
Reduce risk.
Scale a portion of the position once predefined profit objectives are achieved.
Step 2
Let institutional participation decide.
Monitor:
RVF
Buyer vs Seller
Momentum Acceleration
VDI
If they remain healthy...
Stay in the trade.
Step 3
Exit when confirmation disappears.
Not because price feels "too high."
Not because you're nervous.
Exit when:
Institutional buying fades
Momentum deteriorates
Buyer control weakens
TPS drops
Bookmap liquidity changes
Multiple confirmations fail simultaneously
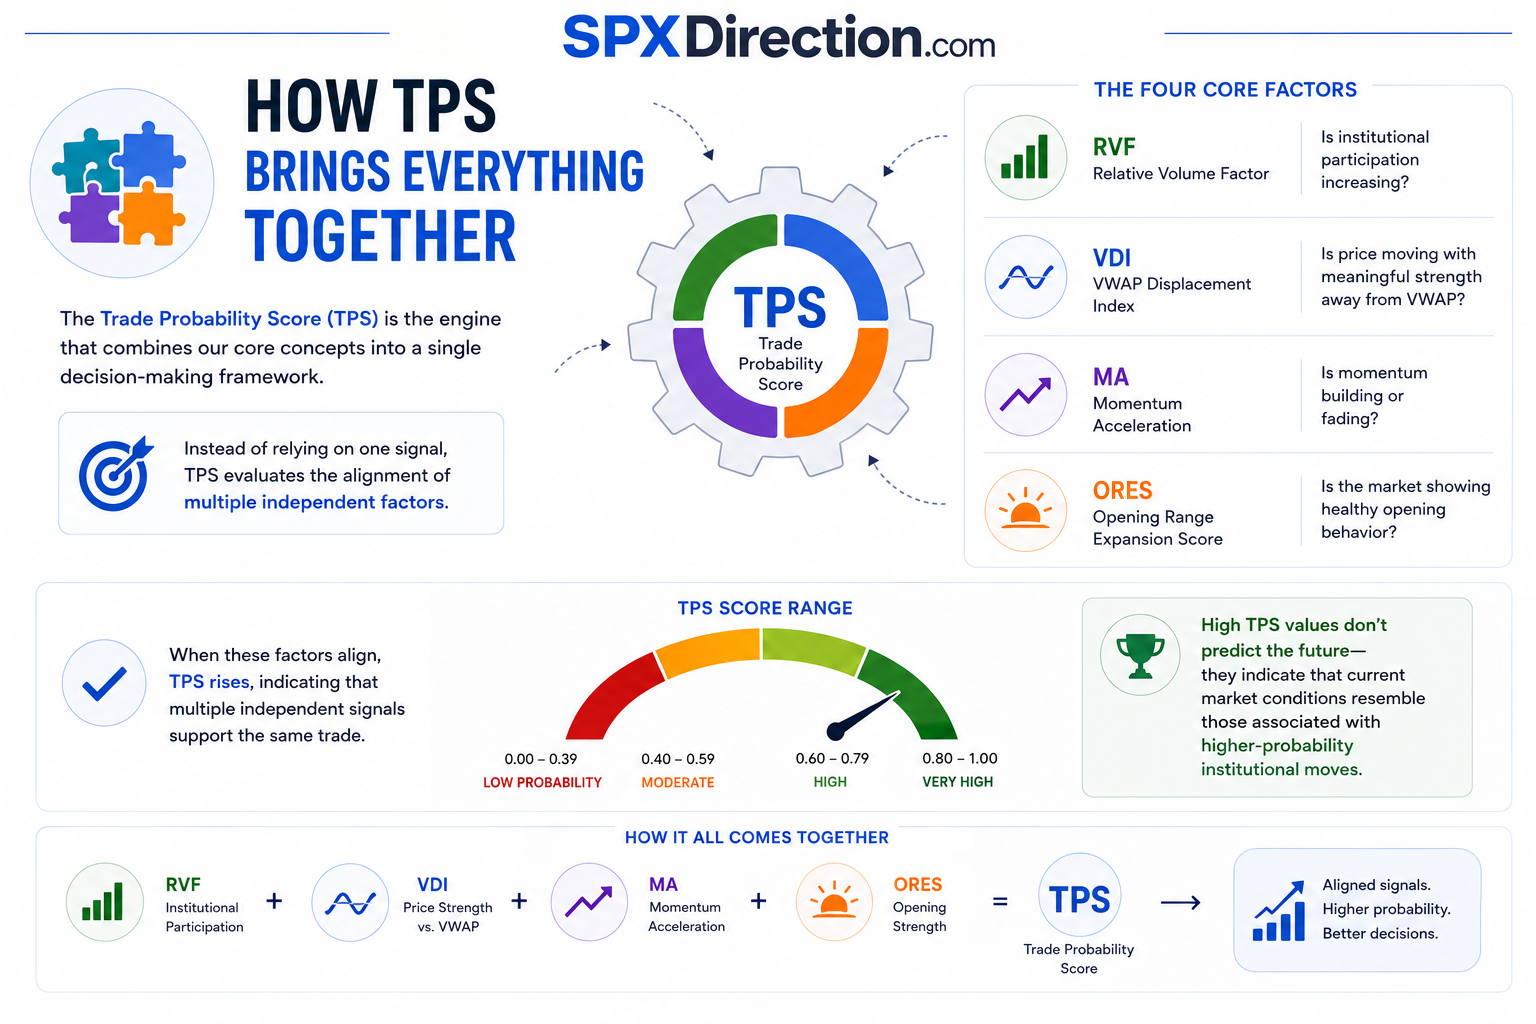
How TPS Brings Everything Together
The Trade Probability Score (TPS) is the engine that combines our core concepts into a single decision-making framework.
Instead of relying on one signal, TPS evaluates the alignment of:
- RVF (Relative Volume Factor): Is institutional participation increasing?
- VDI (VWAP Displacement Index): Is price moving with meaningful strength away from VWAP?
- Momentum Acceleration (MA): Is momentum building or fading?
- ORES (Opening Range Expansion Score): Is the market showing healthy opening behavior?
When these factors align, TPS rises, indicating that multiple independent signals support the same trade. High TPS values don't predict the future—they indicate that current market conditions resemble those associated with higher-probability institutional moves.
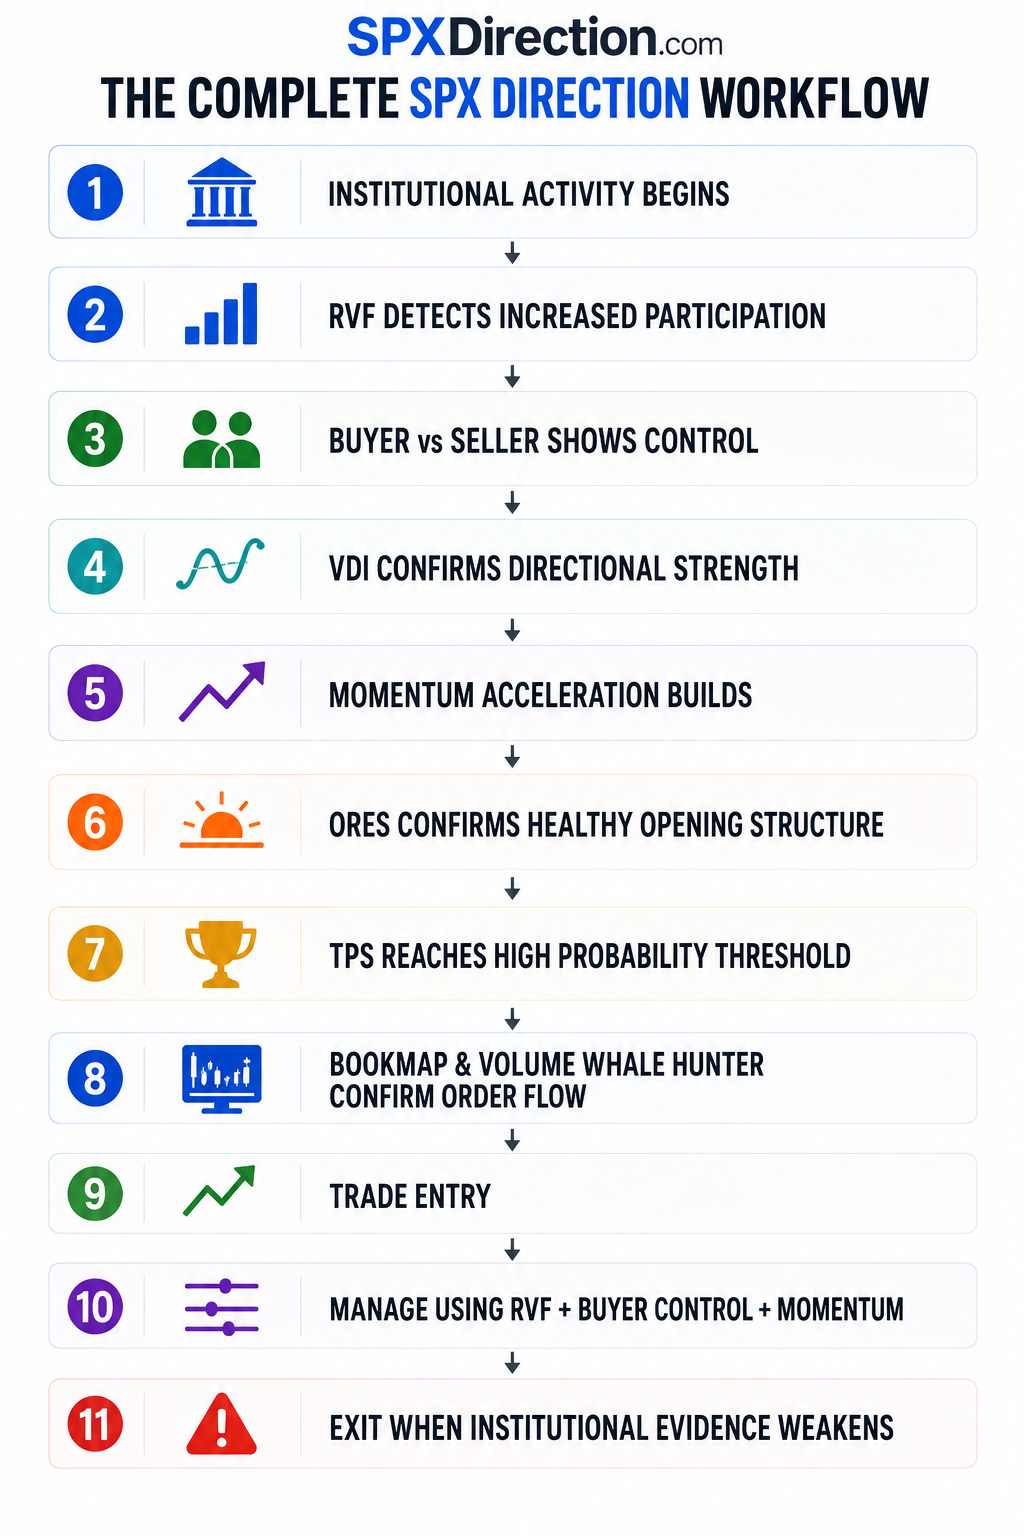
The Complete SPX Direction Workflow
Institutional Activity Begins
↓
RVF Detects Increased Participation
↓
Buyer vs Seller Shows Control
↓
VDI Confirms Directional Strength
↓
Momentum Acceleration Builds
↓
ORES Confirms Healthy Opening Structure
↓
TPS Reaches High Probability Threshold
↓
Bookmap & Volume Whale Hunter Confirm Order Flow
↓
Trade Entry
↓
Manage Using RVF + Buyer Control + Momentum
↓
Exit When Institutional Evidence Weakens
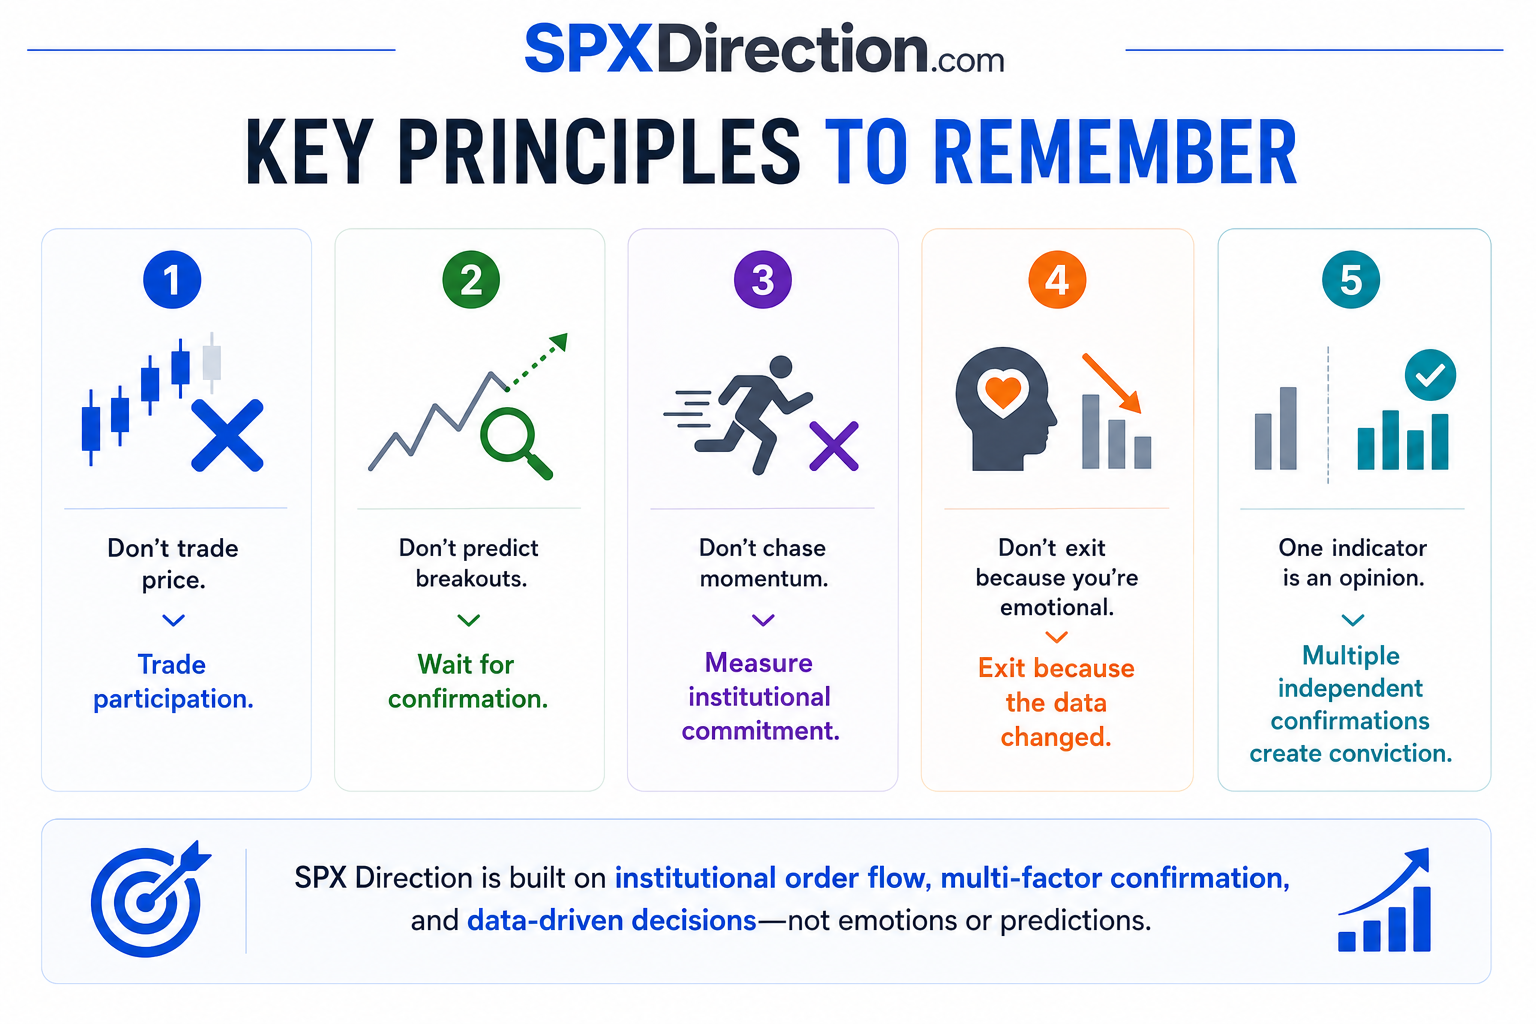
Key Principles to Remember
Don't trade price.
Trade participation.
Don't predict breakouts.
Wait for confirmation.
Don't chase momentum.
Measure institutional commitment.
Don't exit because you're emotional.
Exit because the data changed.
One indicator is an opinion.
Multiple independent confirmations create conviction.
The SPX Direction Advantage
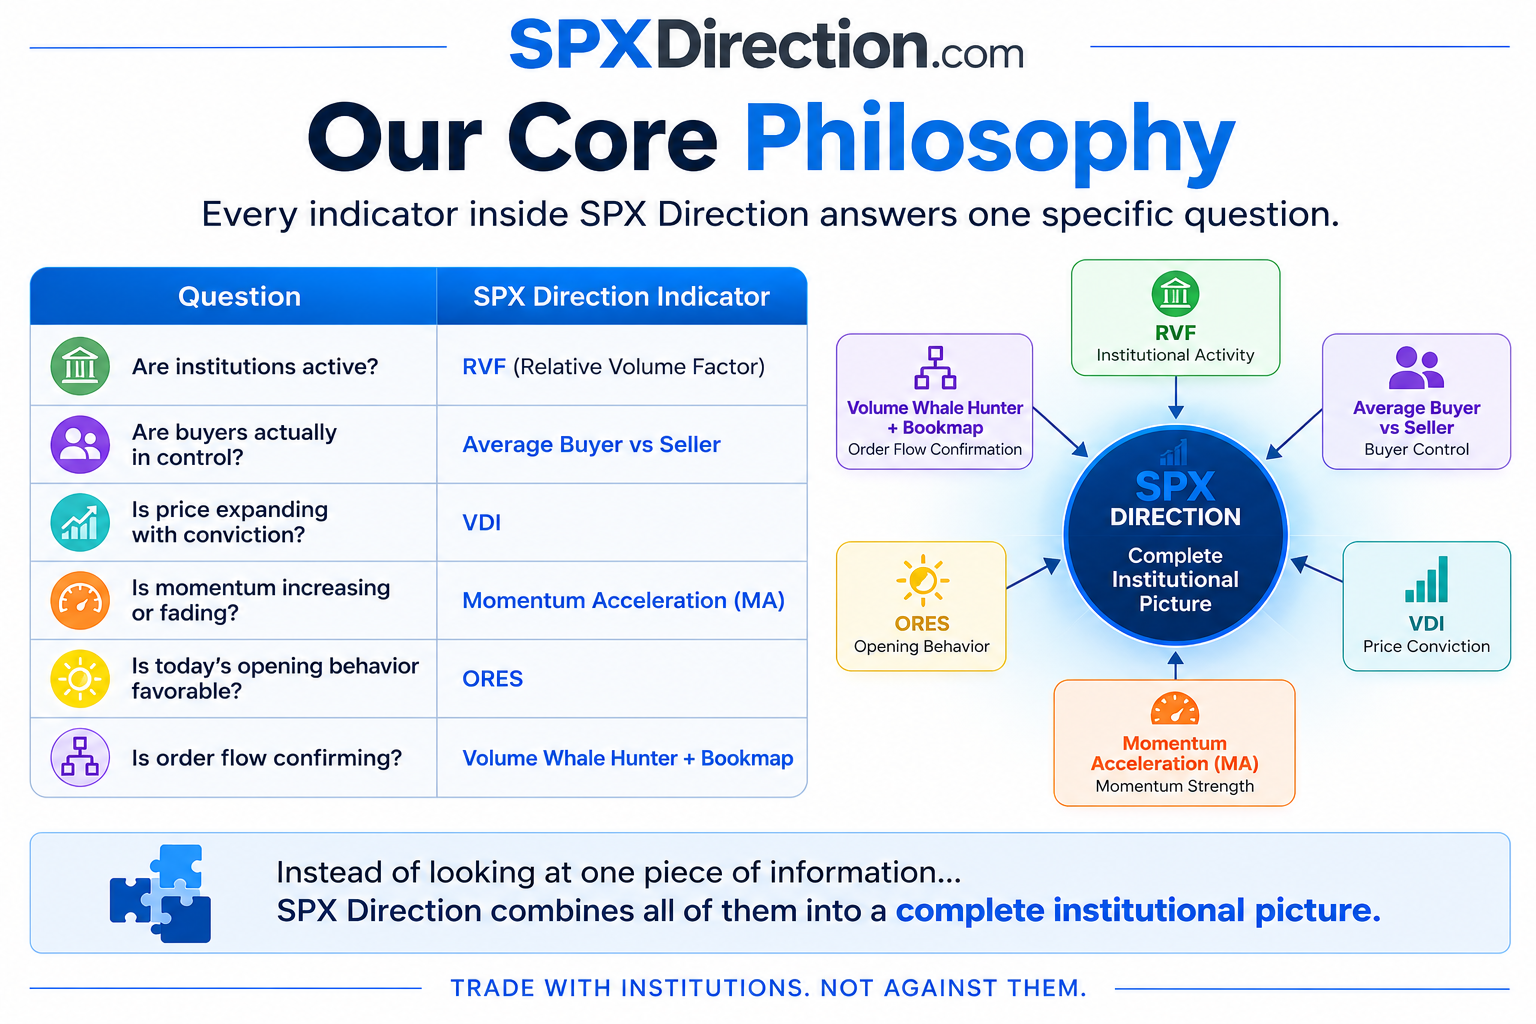
Many trading systems focus on chart patterns or lagging indicators. SPX Direction is built around a different philosophy: identify institutional participation, confirm it through multiple independent signals, and manage trades based on evidence rather than emotion.
By combining RVF, VDI, Momentum Acceleration, ORES, Average Buyer vs. Seller, Bookmap, Volume Whale Hunter, and the Trade Probability Score (TPS) into a single framework, traders gain a structured process for evaluating whether a move is supported by real buying and selling pressure—not just price movement.
The objective isn't to predict every market move. The objective is to participate only when the highest-quality conditions align and to stay in those trades for as long as institutional participation remains intact. This disciplined, evidence-based approach is the foundation of the SPX Direction methodology.