SPX Direction Volume Whale Hunter
Contact customer support at support@spxdirection.com to get access to this add-on for Bookmap.
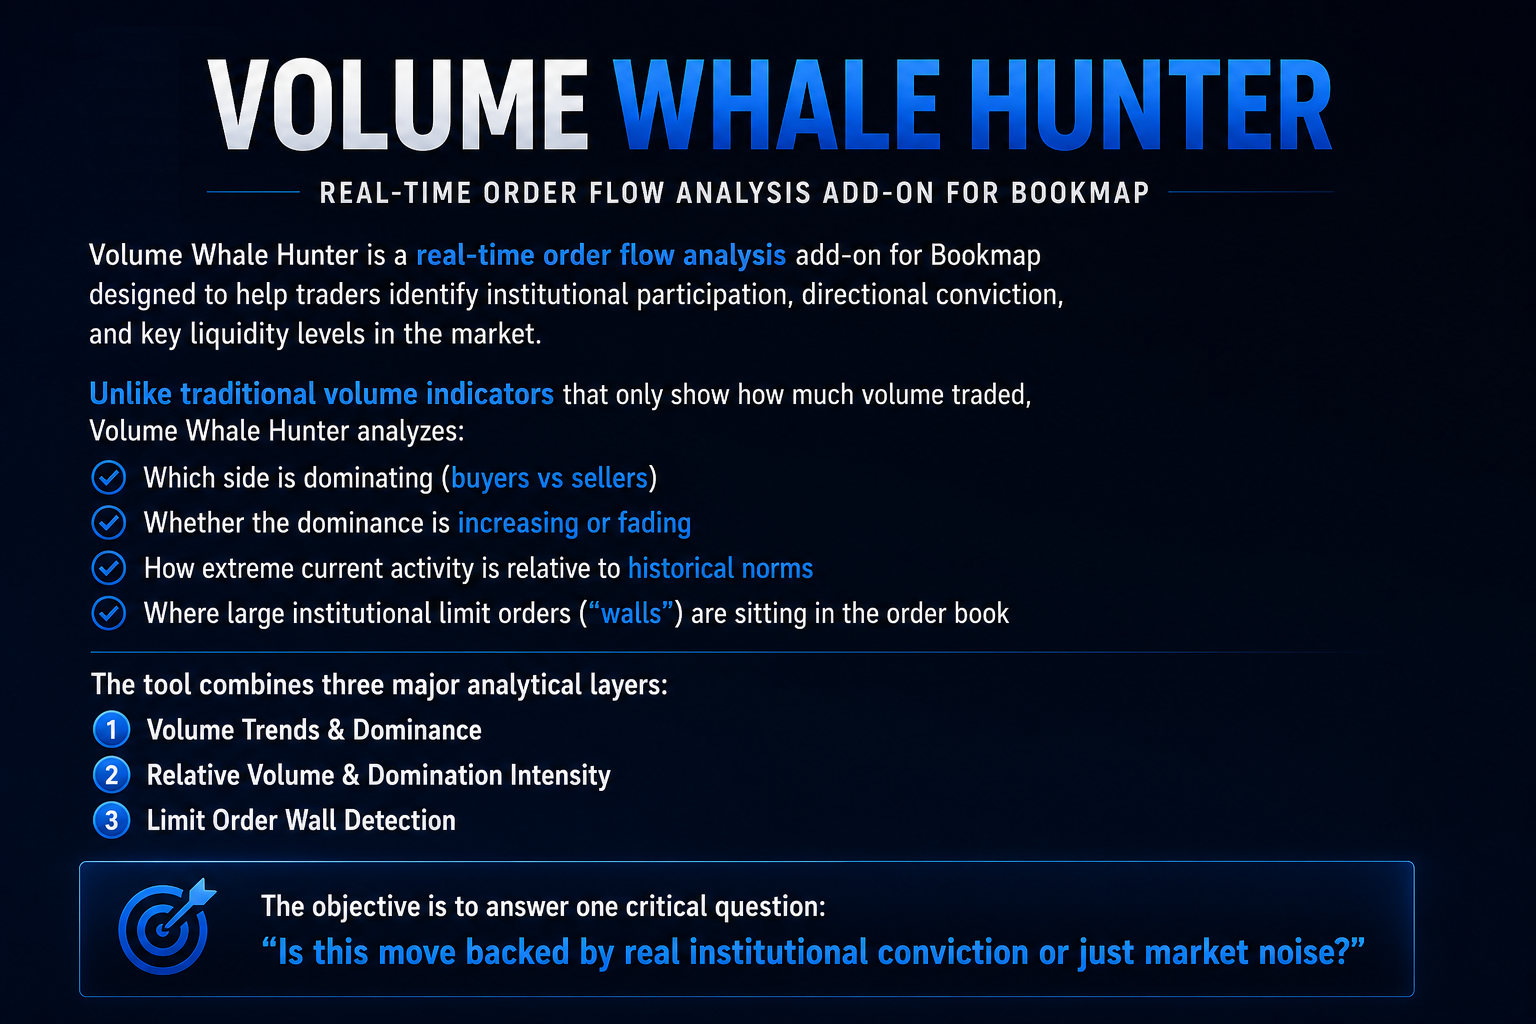
Volume Whale Hunter is a real-time order flow analysis add-on for Bookmap designed to help traders identify institutional participation, directional conviction, and key liquidity levels in the market.
Unlike traditional volume indicators that only show how much volume traded, Volume Whale Hunter analyzes:
- Which side is dominating (buyers vs sellers)
- Whether the dominance is increasing or fading
- How extreme current activity is relative to historical norms
- Where large institutional limit orders (“walls”) are sitting in the order book
The tool combines three major analytical layers:
- Volume Trends & Dominance
- Relative Volume & Domination Intensity
- Limit Order Wall Detection
The objective is to answer one critical question:
“Is this move backed by real institutional conviction or just market noise?”
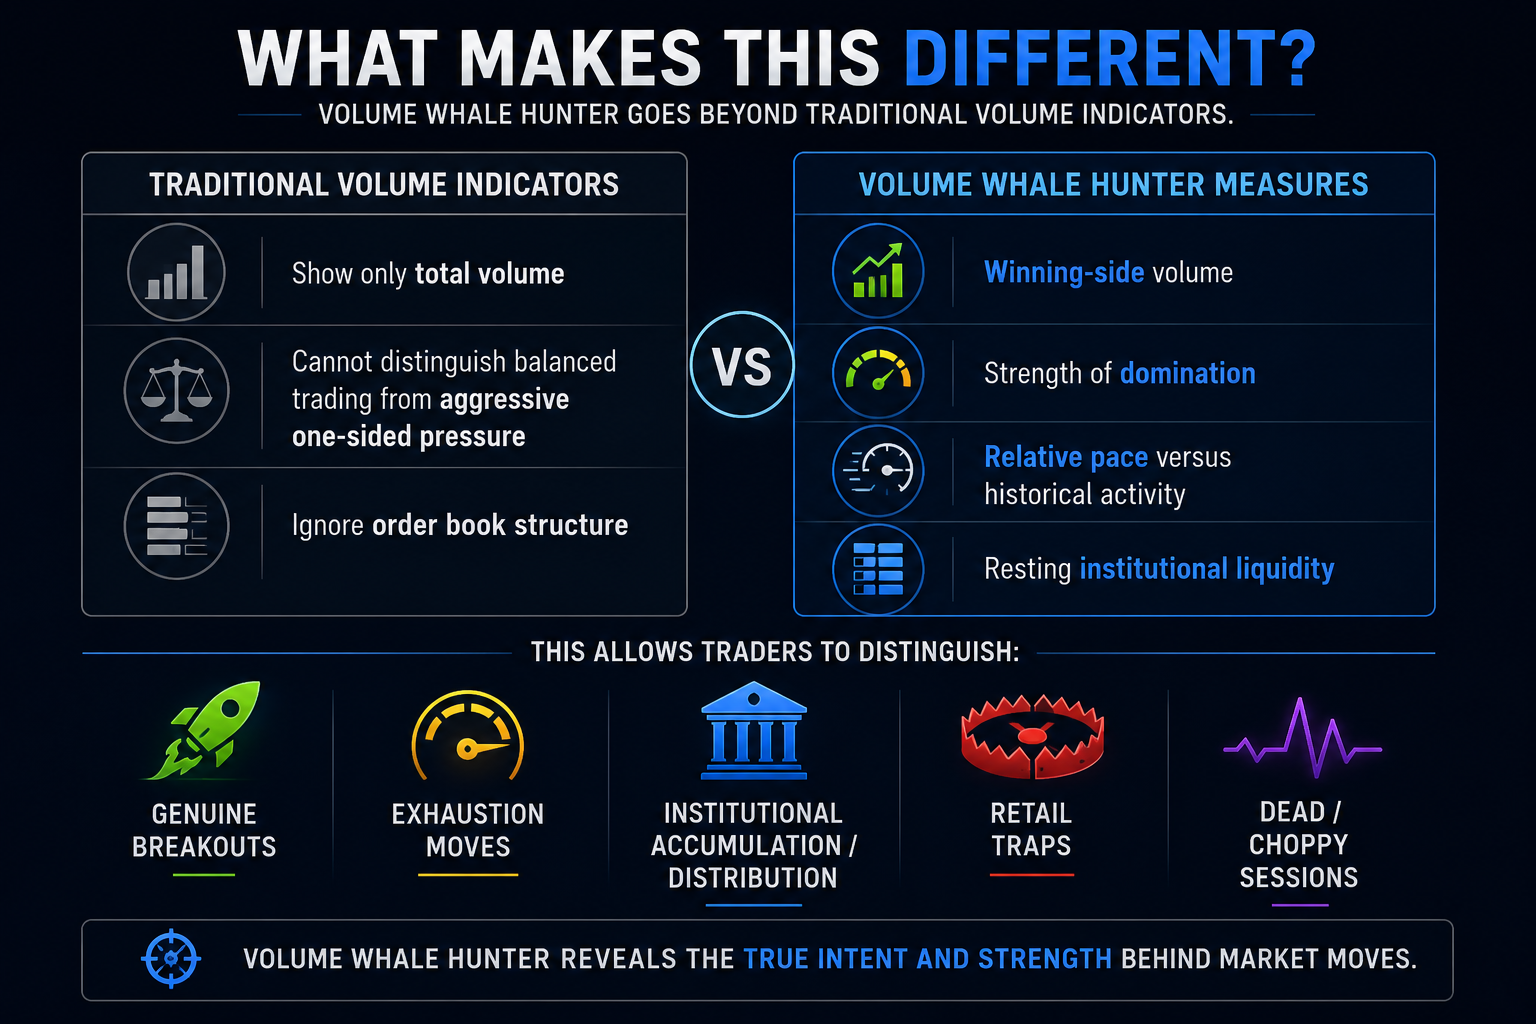
What Makes This Different?
Traditional volume indicators:
- Show only total volume
- Cannot distinguish balanced trading from aggressive one-sided pressure
- Ignore order book structure
Volume Whale Hunter measures:
- Winning-side volume
- Strength of domination
- Relative pace versus historical activity
- Resting institutional liquidity
This allows traders to distinguish:
- Genuine breakouts
- Exhaustion moves
- Institutional accumulation/distribution
- Retail traps
- Dead/choppy sessions
Three Data Layers
Layer 1 — Volume Averages & Trends
Purpose
Measures:
- Buyer activity
- Seller activity
- Directional dominance
- Momentum acceleration or exhaustion
Key Metrics
- Buyer Volume
- Seller Volume
- Dominating Volume
- DOM%
- Trend Differential
Core Insight
This layer answers:
“Who is winning, and is their advantage growing or fading?”
Layer 2 — Domination Intensity & RVF
Purpose
Measures:
- Market participation intensity
- Relative speed of volume flow
- Abnormal institutional activity
- Extreme directional pressure
Components
- Static RVF Gauge
- Dynamic RVF Gauge
- Domination Speedometers
- Domination Milestones
Core Insight
This layer answers:
“How abnormal and aggressive is current order flow?”

Layer 3 — Limit Order Walls
Purpose
Tracks:
- Large resting bid/ask liquidity
- Institutional support/resistance
- Absorption zones
- Potential price magnets
Core Insight
This layer answers:
“Where is committed institutional liquidity sitting?”
Interface Layout
The display contains 5 continuously updating rows.
|
|
|
|
|
|
|
|
|
|
|
|
|
|
|
|
|
|
|
|
|
|
|
|
All rows refresh every second and can stream externally via webhook integration.
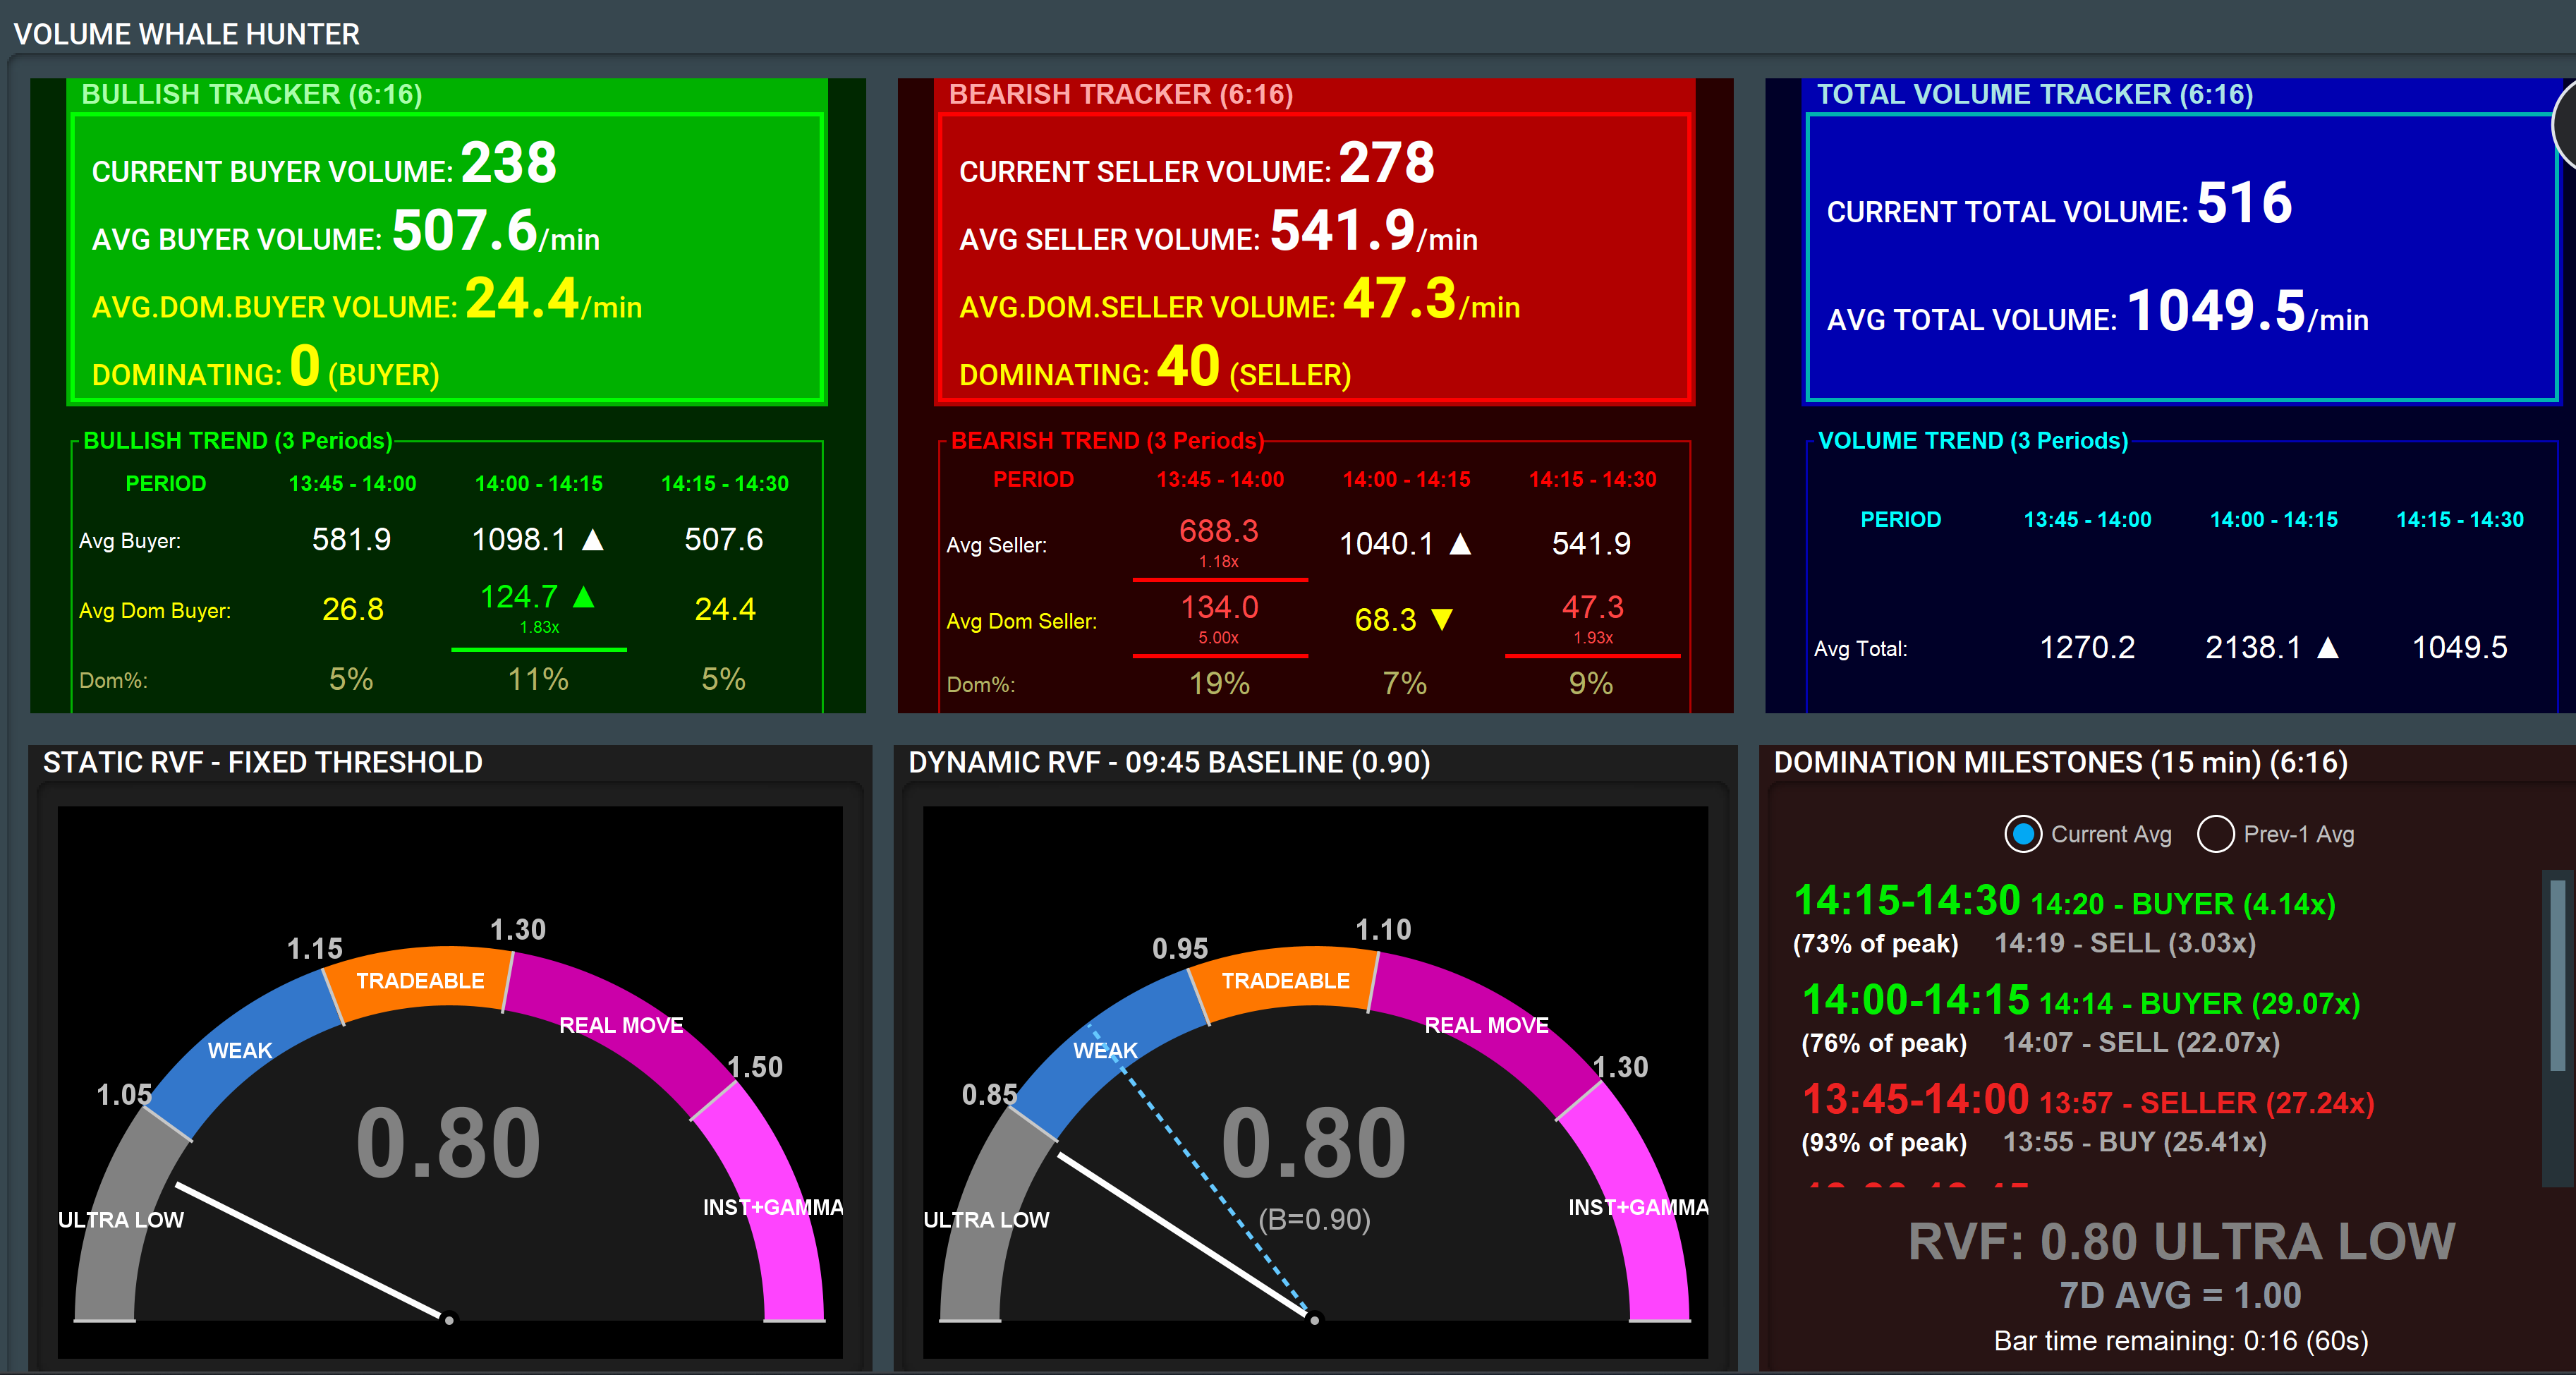
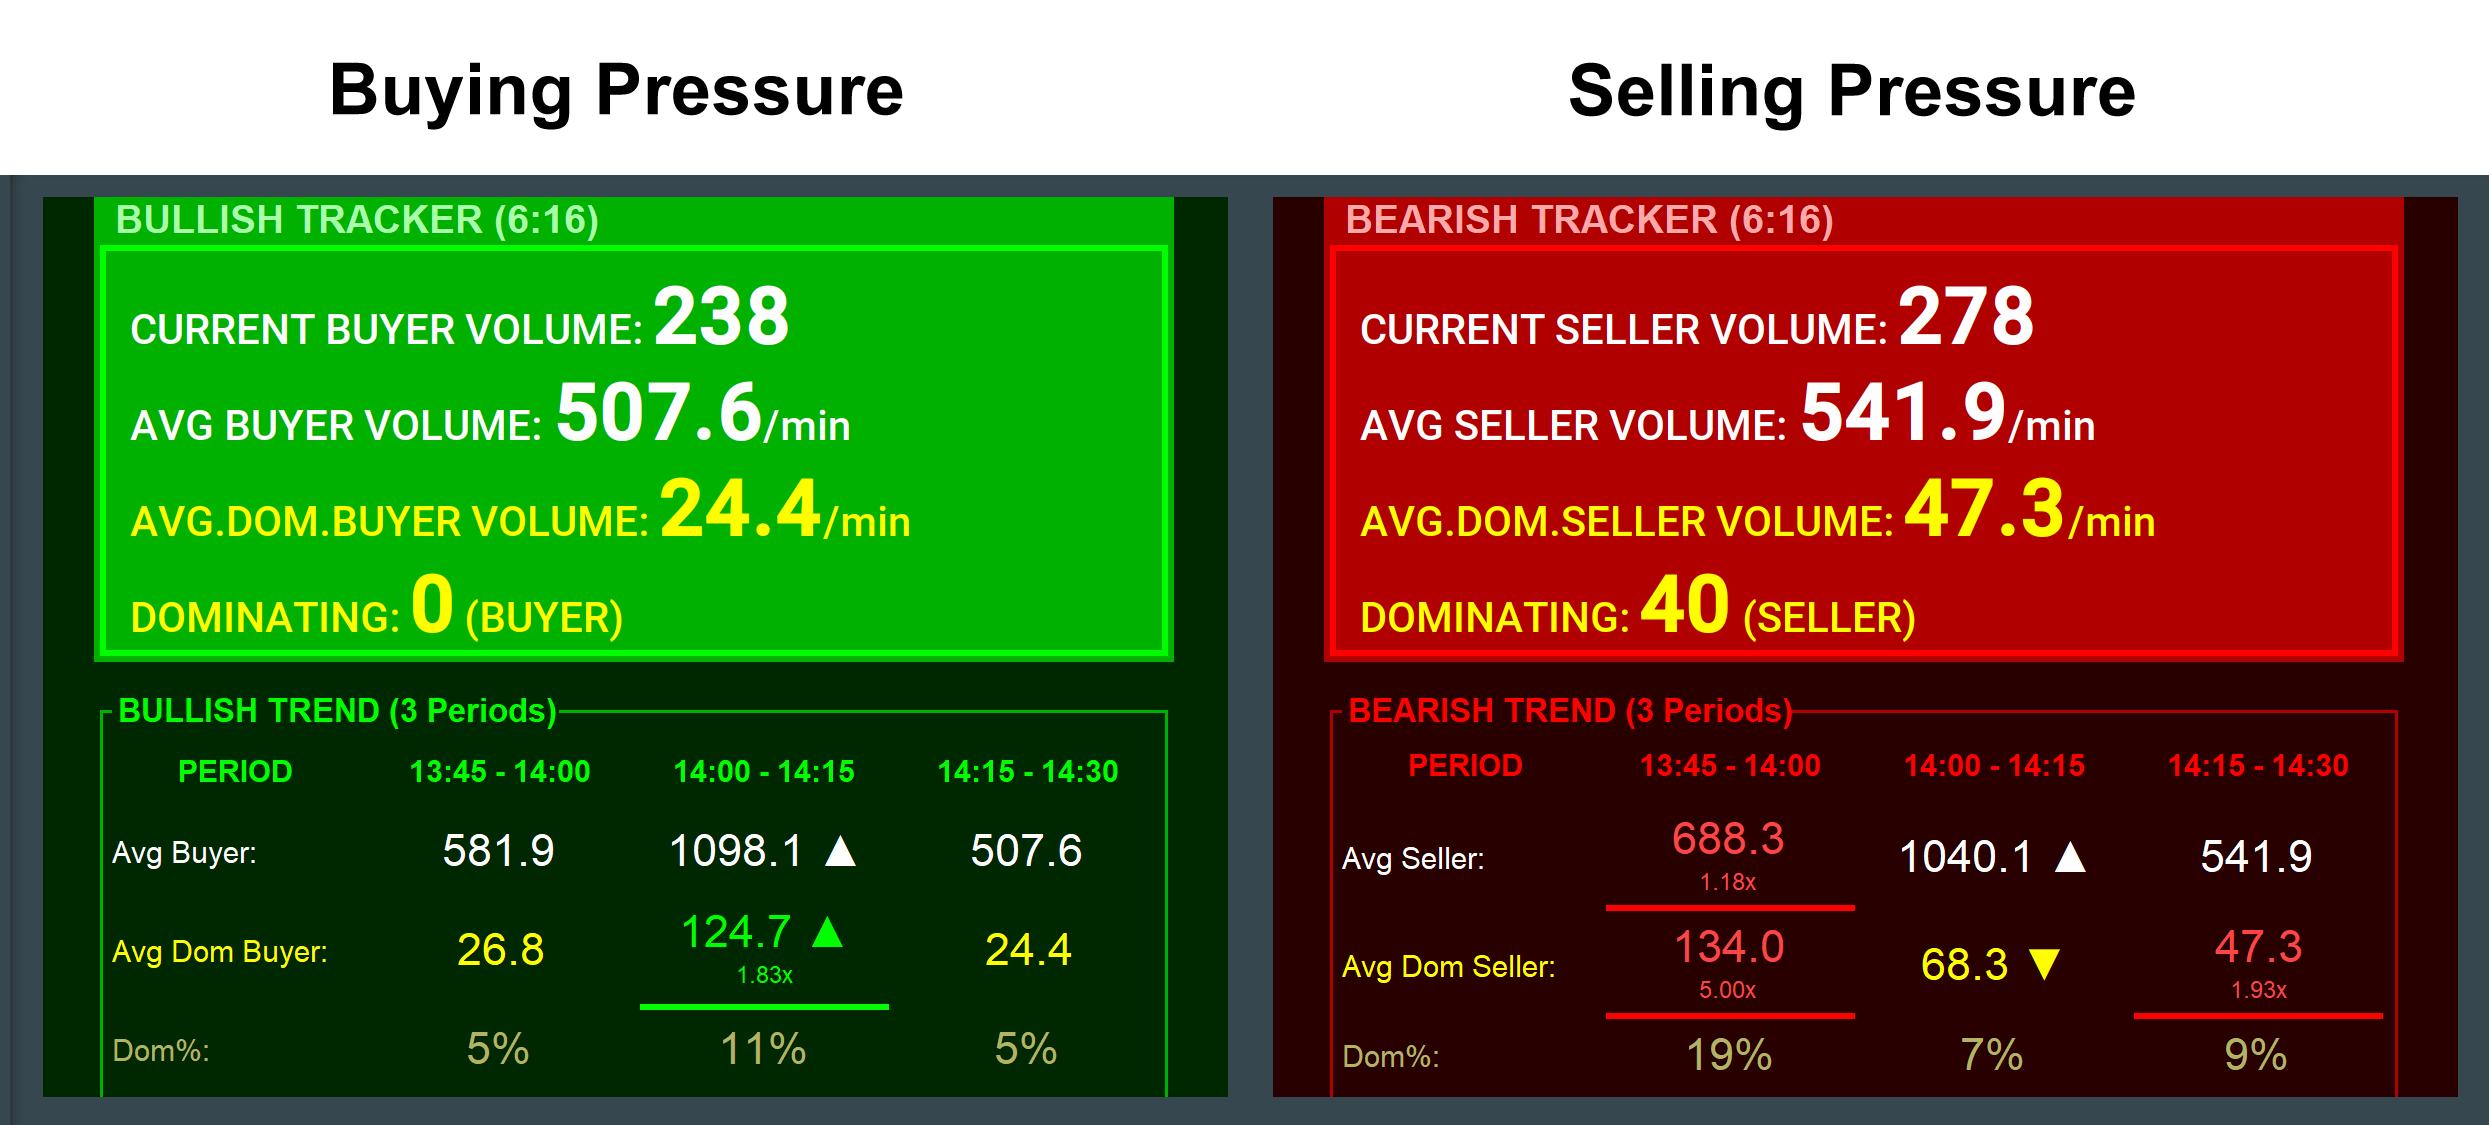
ROW 1 — Volume Trackers
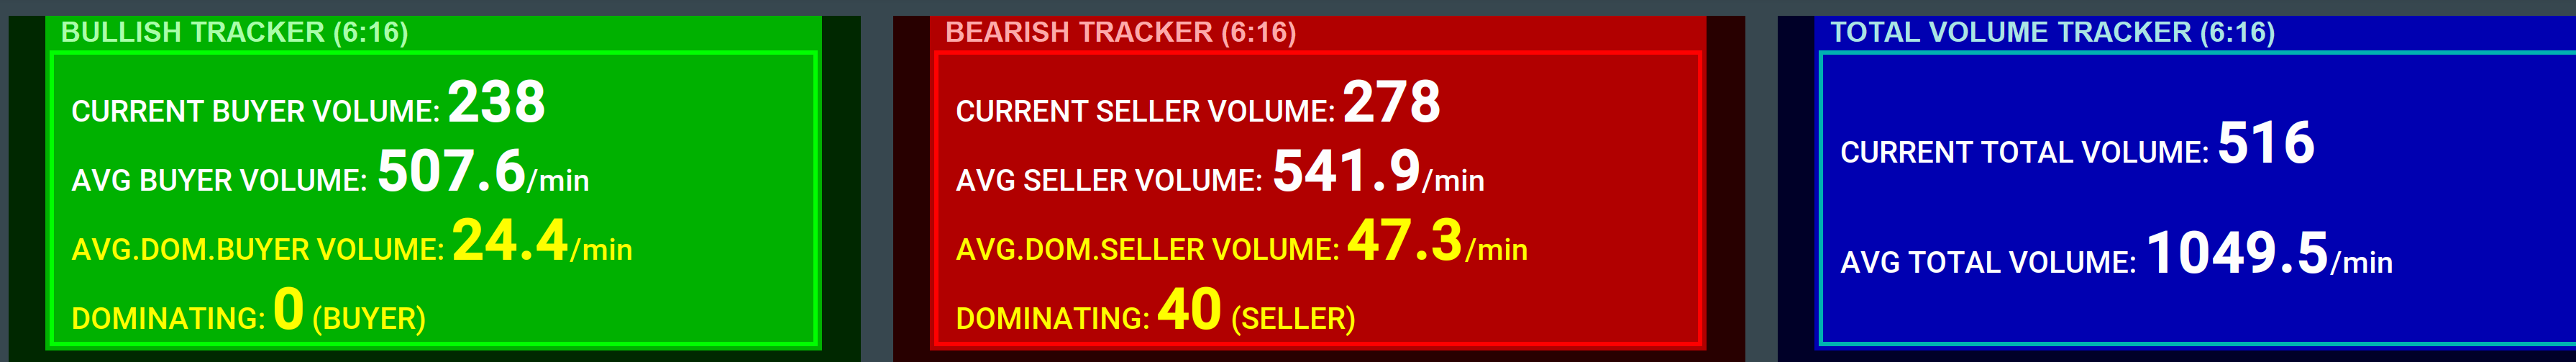
Bearish Tracker
Purpose
Tracks real-time selling pressure and determines whether sellers are genuinely overpowering buyers.
Main Metrics
1. Seller Volume
Raw sell-side volume for the current bar.
2. Seller Average
Average seller volume per minute over the configured lookback period.
Formula:
Seller Avg = Total seller volume in last N minutes ÷ N
3. Avg Dominating Seller Volume
Measures only the excess selling where sellers actually won the bar.
Formula:
Dom. Seller Avg = Sum of all dominating seller volumes ÷ N minutes
4. Dominating
Current live imbalance when sellers are ahead.
DOMINATION PERCENTAGE
Measures the percentage of seller activity that was actually dominant.
Formula:
DOM% = (Dom. Seller Avg ÷ Seller Avg) × 100
Interpretation
- High DOM% = aggressive conviction selling
- Low DOM% = passive/choppy selling
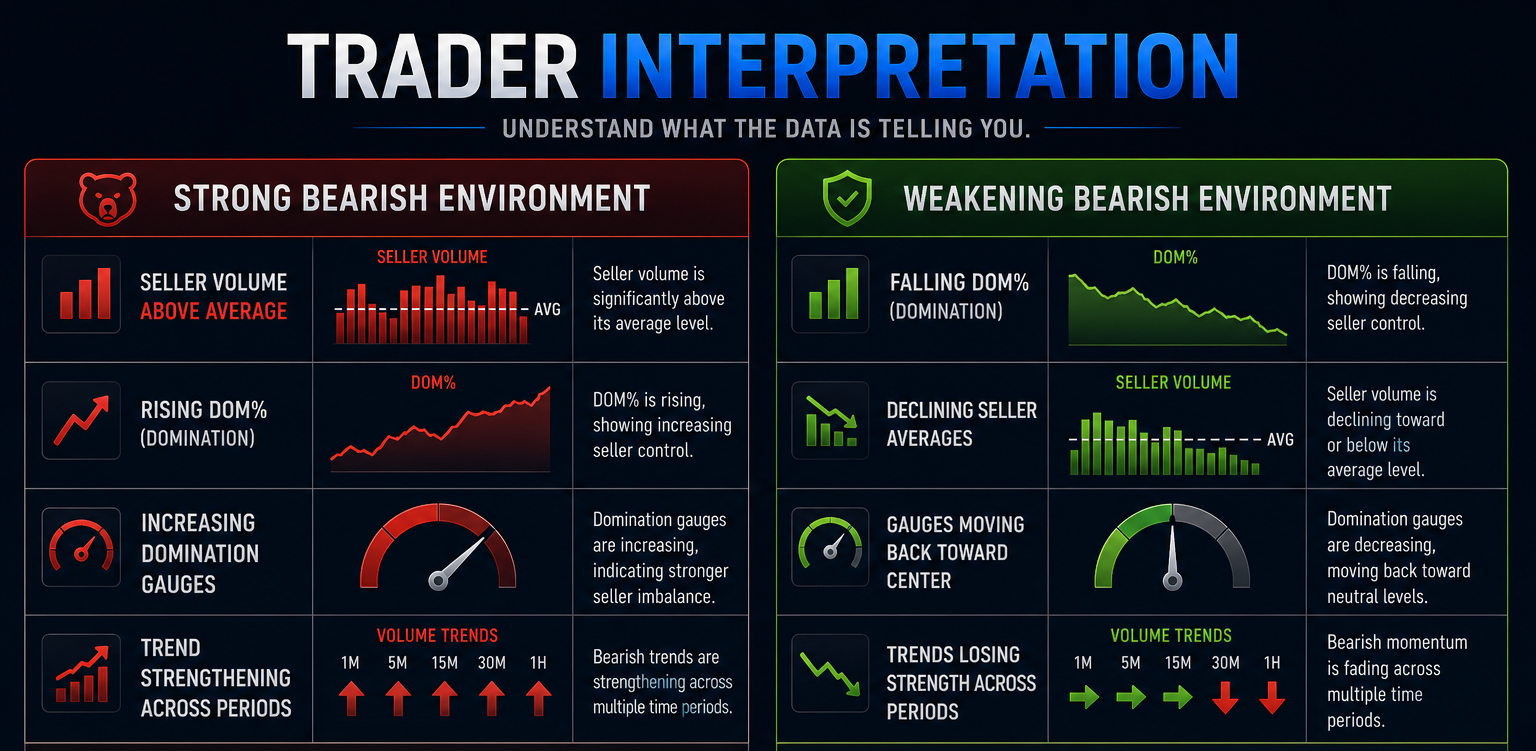
Trader Interpretation
Strong Bearish Environment
- Seller Volume above average
- Rising DOM%
- Increasing domination gauges
- Trend strengthening across periods
Weakening Bearish Environment
- Falling DOM%
- Declining seller averages
- Gauges moving back toward center
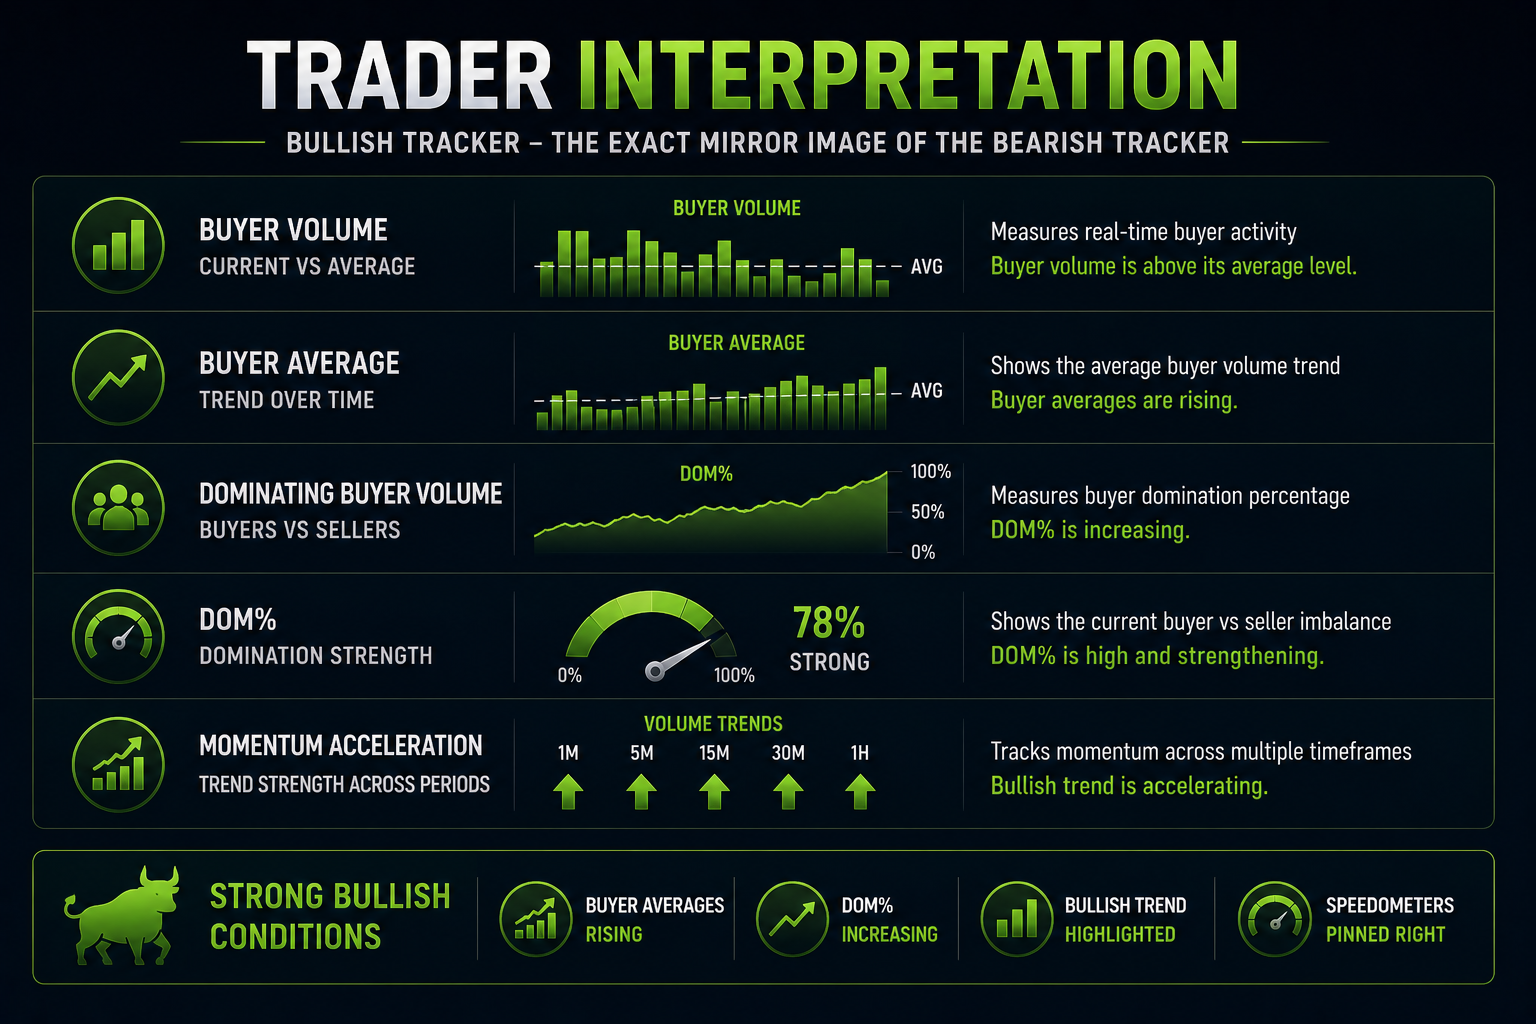
Bullish Tracker
The bullish tracker is the exact mirror image of the bearish tracker:
- Buyer Volume
- Buyer Average
- Dominating Buyer Volume
- DOM%
- Momentum acceleration
Strong Bullish Conditions
- Buyer averages rising
- DOM% increasing
- Bullish trend highlighted
- Speedometers pinned right
ROW 2 — Trend Panels
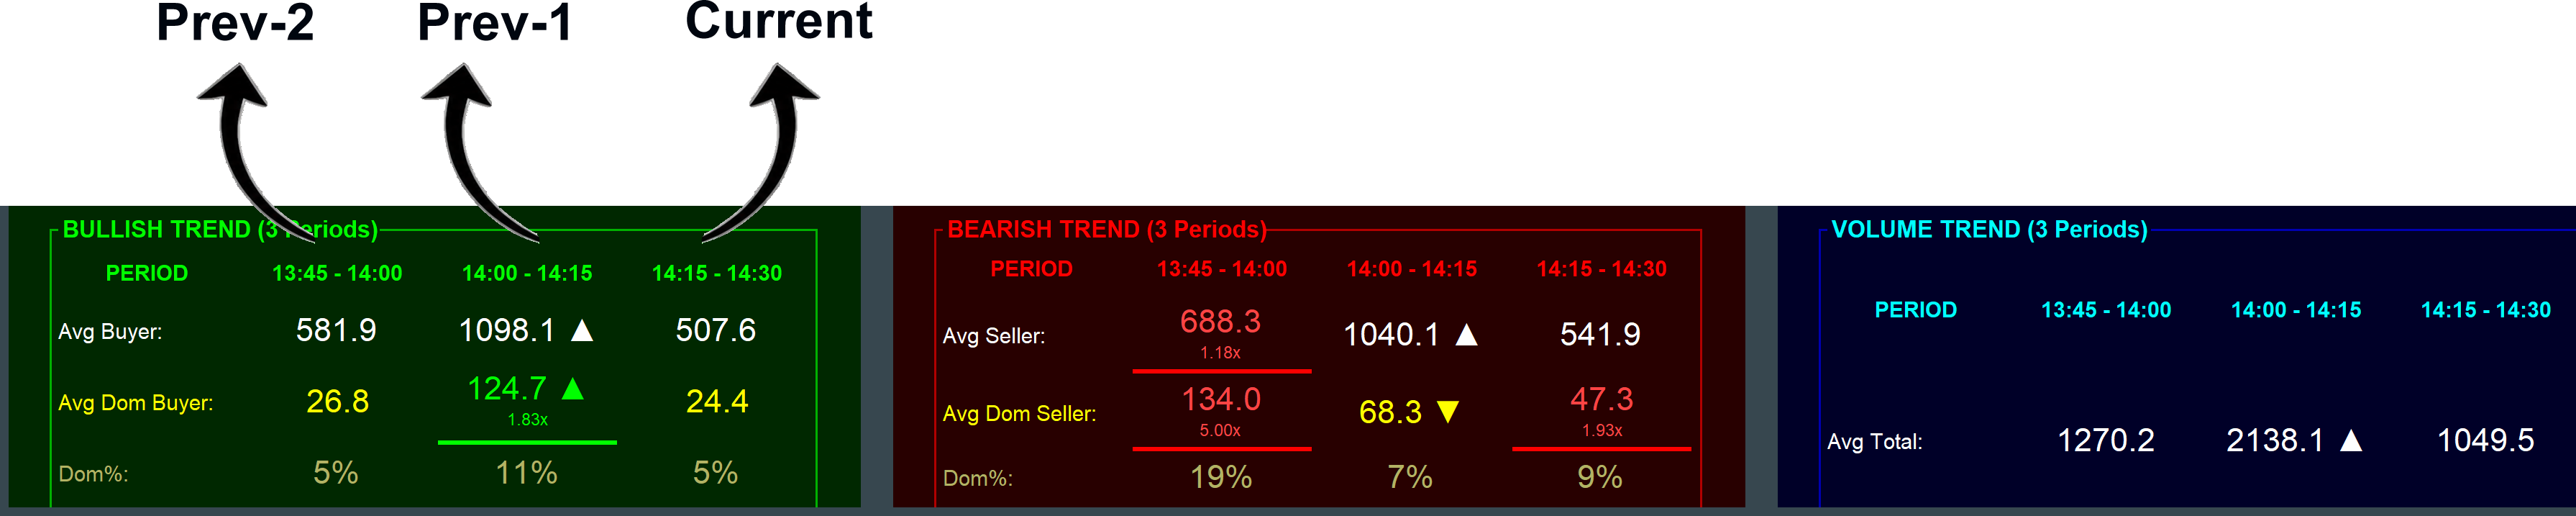
Tracks buying activity across:
- Prev-2
- Prev-1
- Current
Metrics:
- Avg Buyer
- Avg Dominating Buyer
- DOM%
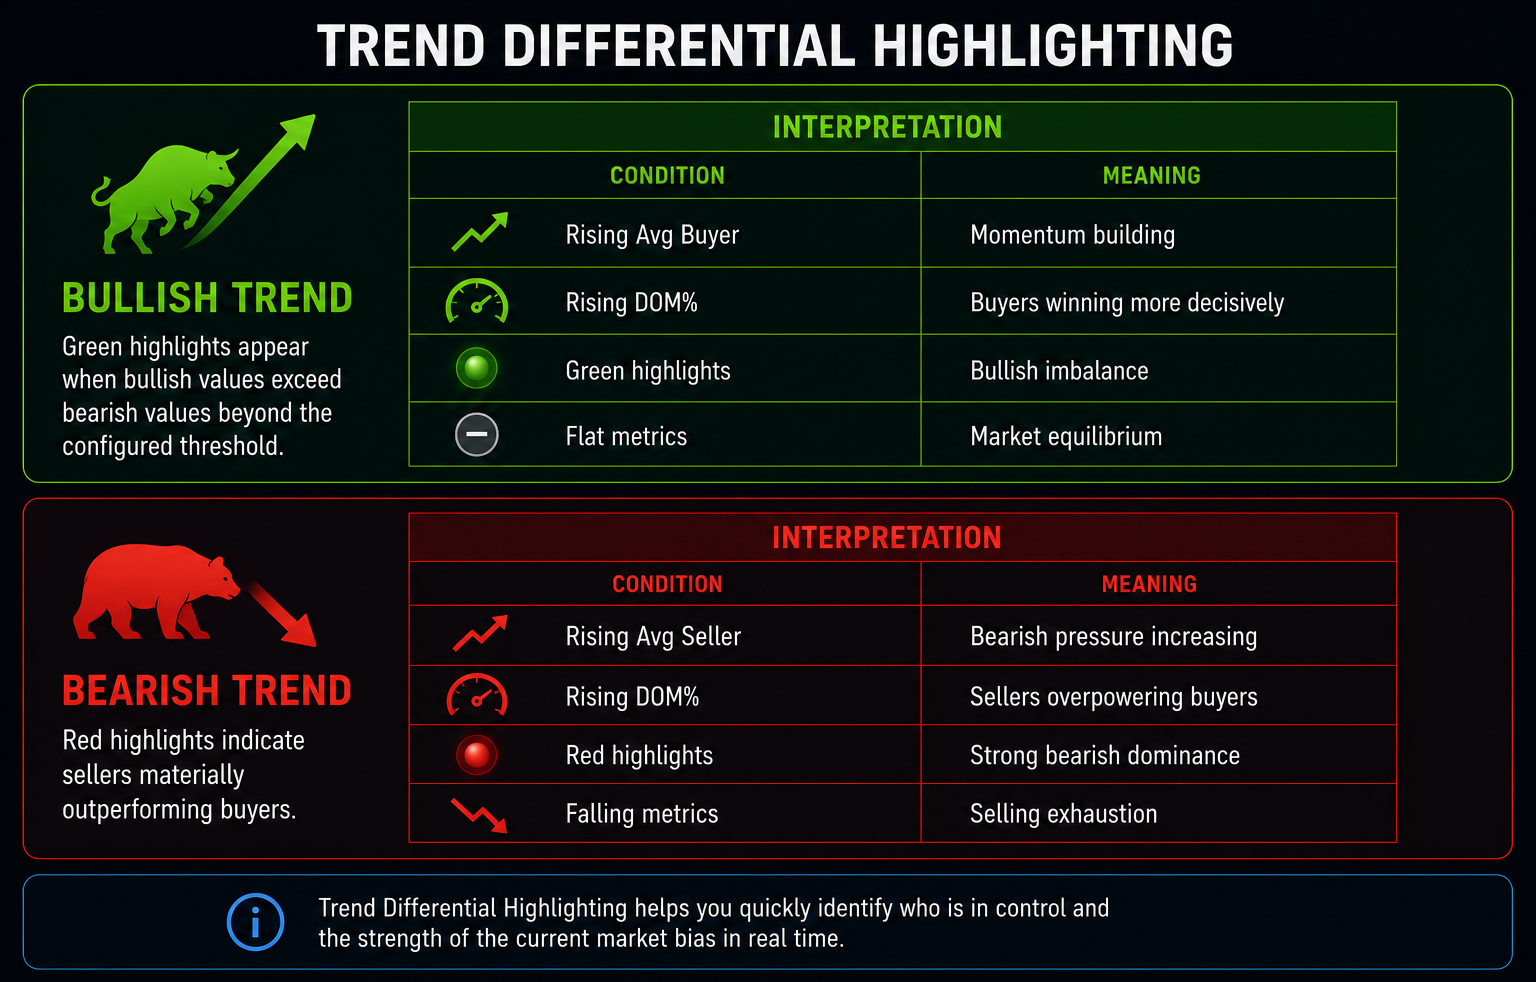
Trend Differential Highlighting in Bullish Trend
Green highlights appear when bullish values exceed bearish values beyond the configured threshold.
Interpretation
|
|
|
|
|
|
|
|
|
|
|
|
|
|
|
Bearish Trend
Mirror image of bullish trend.
Red highlights indicate sellers materially outperforming buyers.
Interpretation
|
|
|
|
|
|
|
|
|
|
|
|
|
|
|
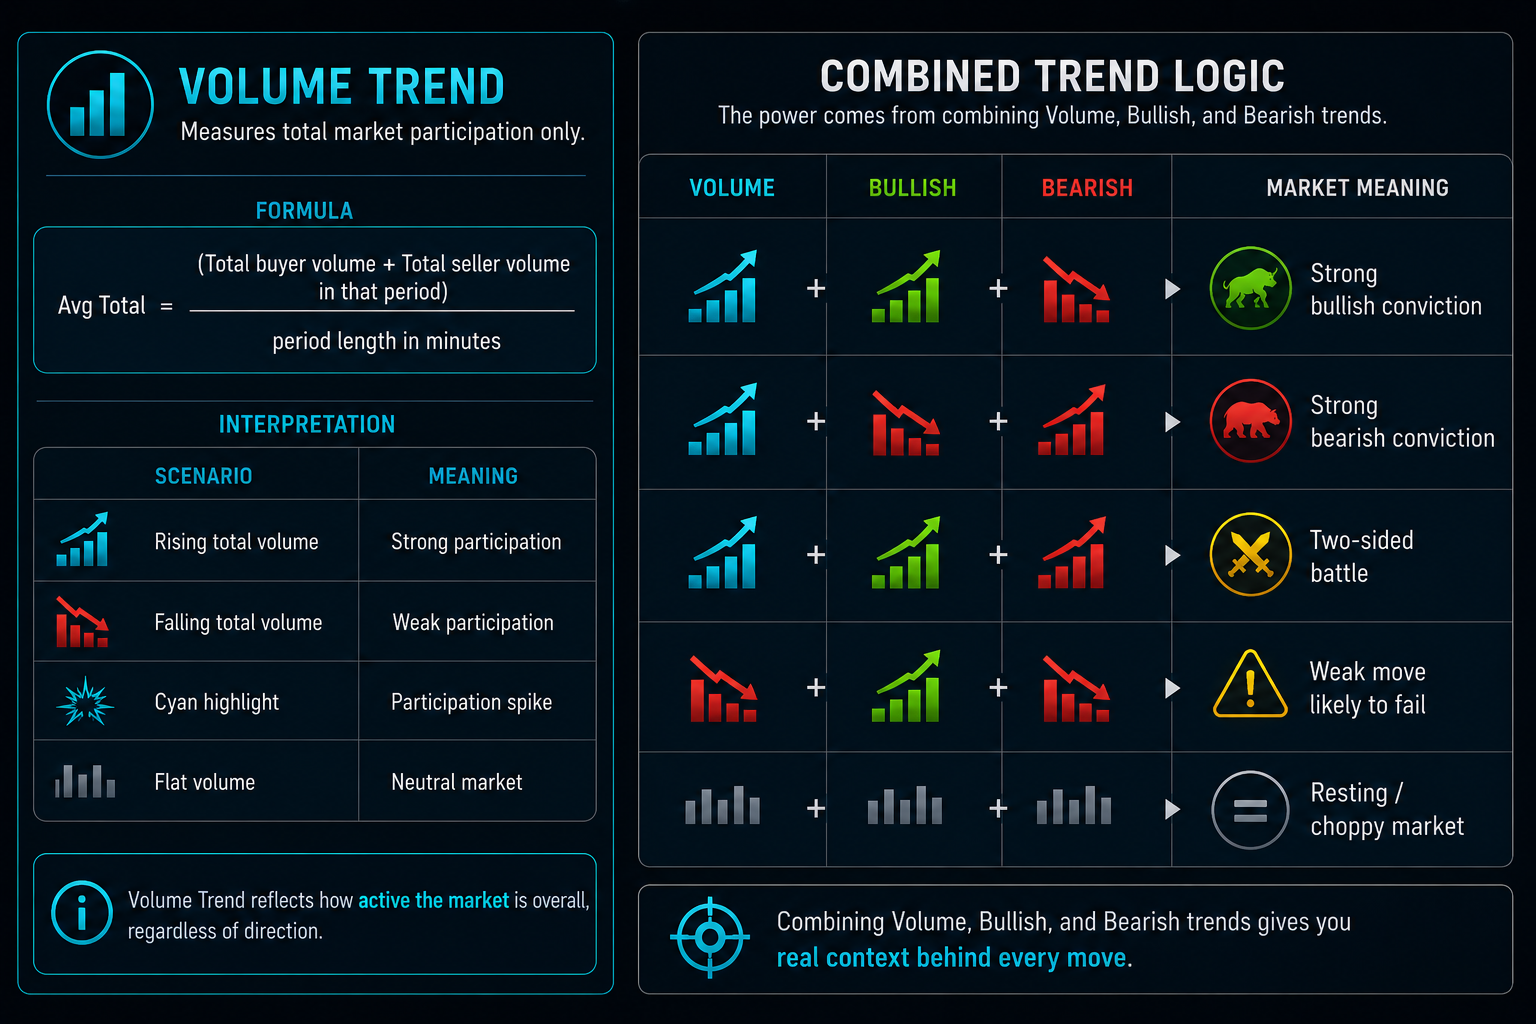
Volume Trend
Measures total market participation only.
Formula:
Avg Total = (Total buyer volume + Total seller volume in that period) ÷ period length in minutes
Interpretation
|
|
|
|
|
|
|
|
|
|
|
|
|
|
|
Combined Trend Logic
|
|
|
|
|
|
|
|
|
|
|
|
|
|
|
|
|
|
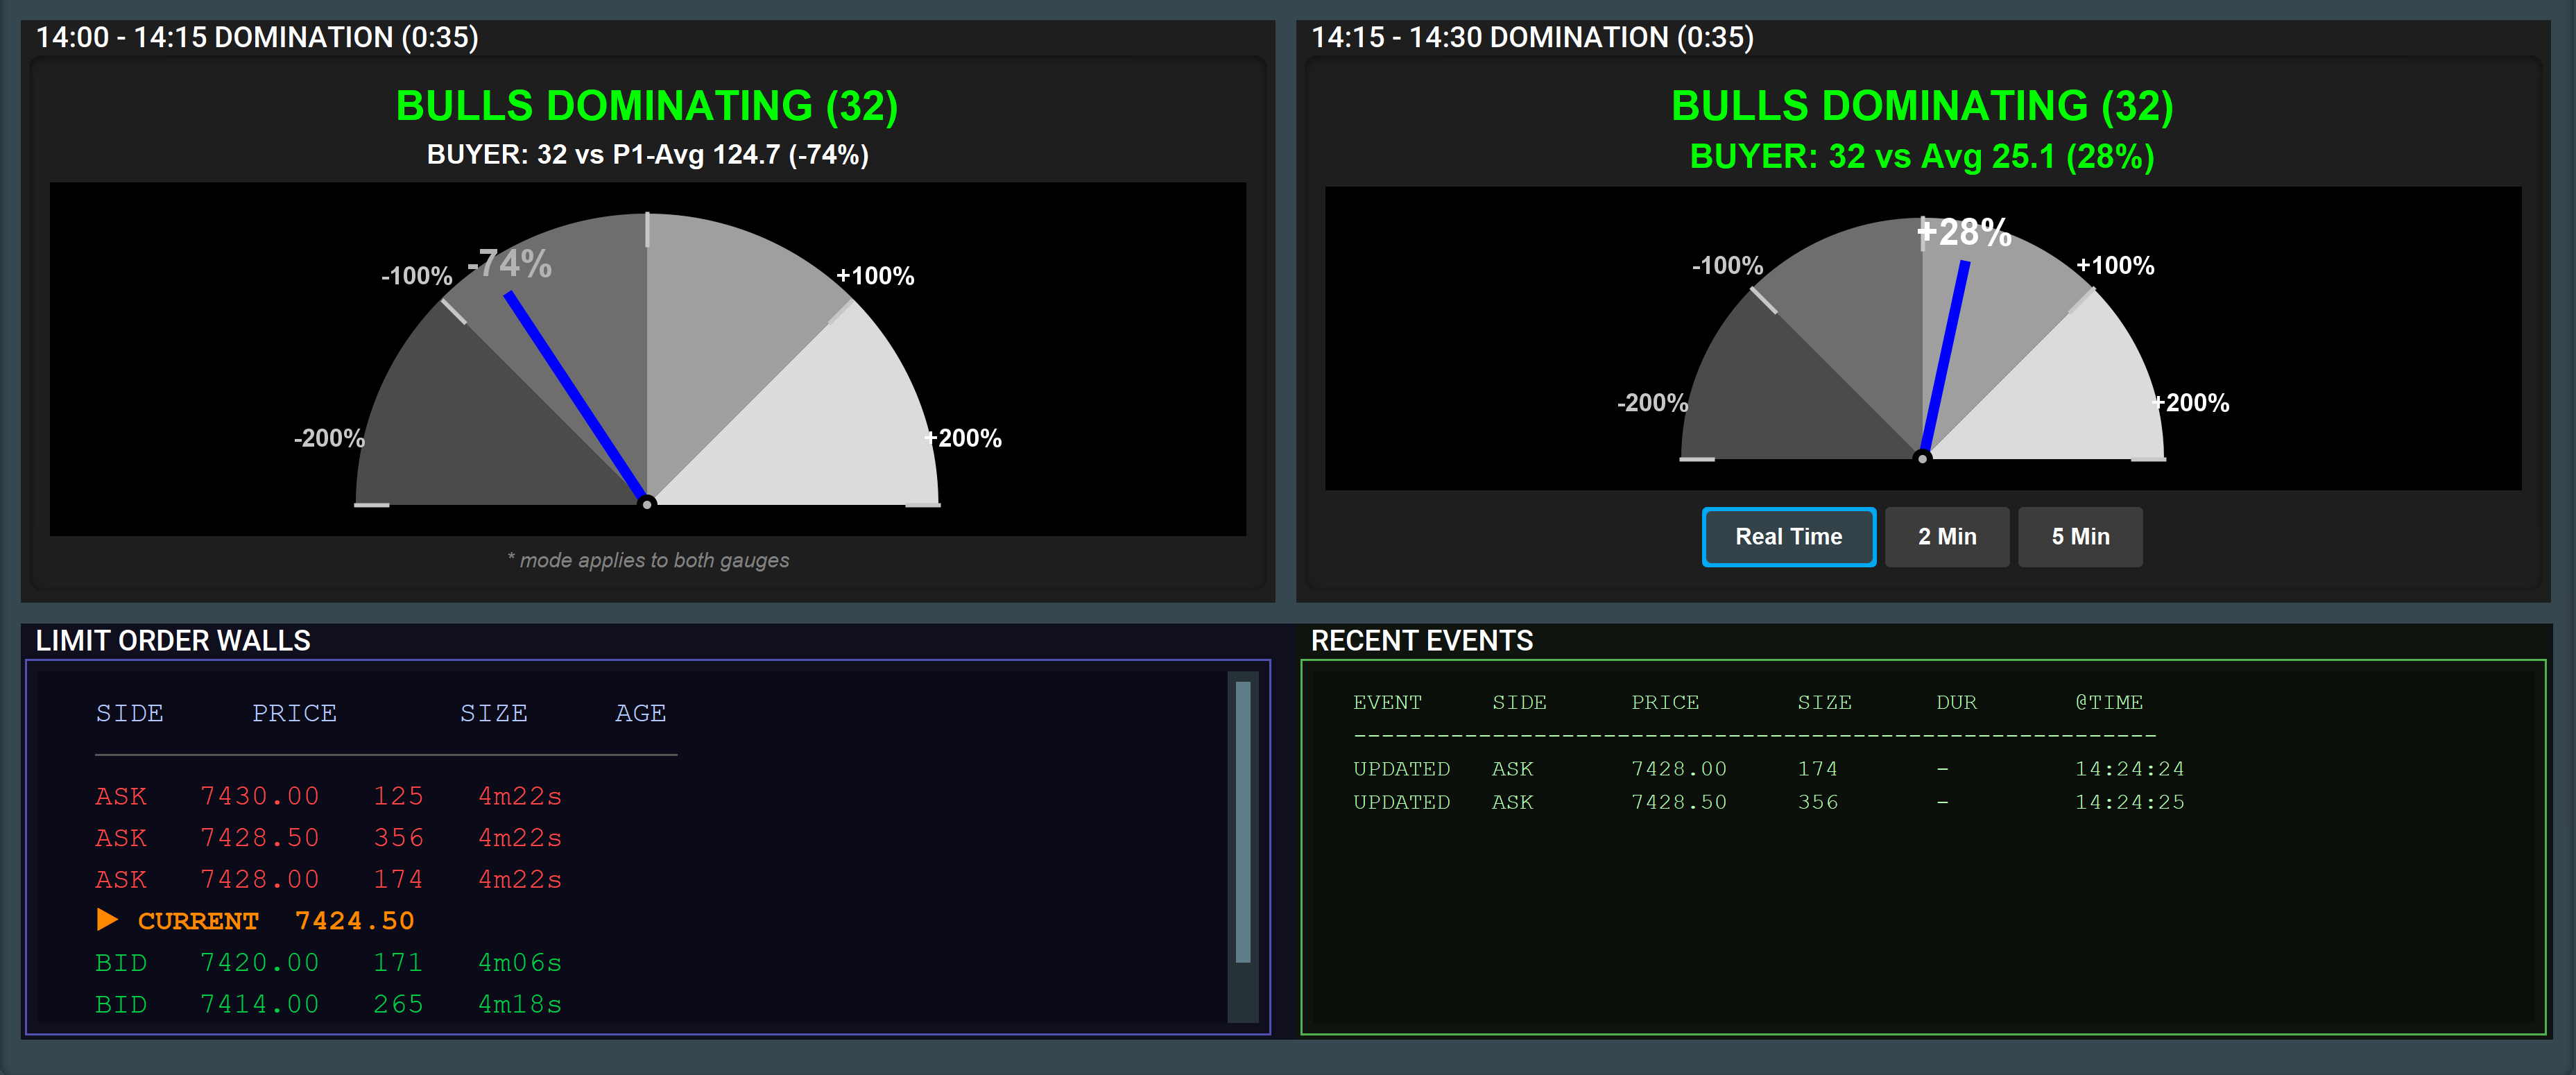
ROW 3 — RVF & Milestones
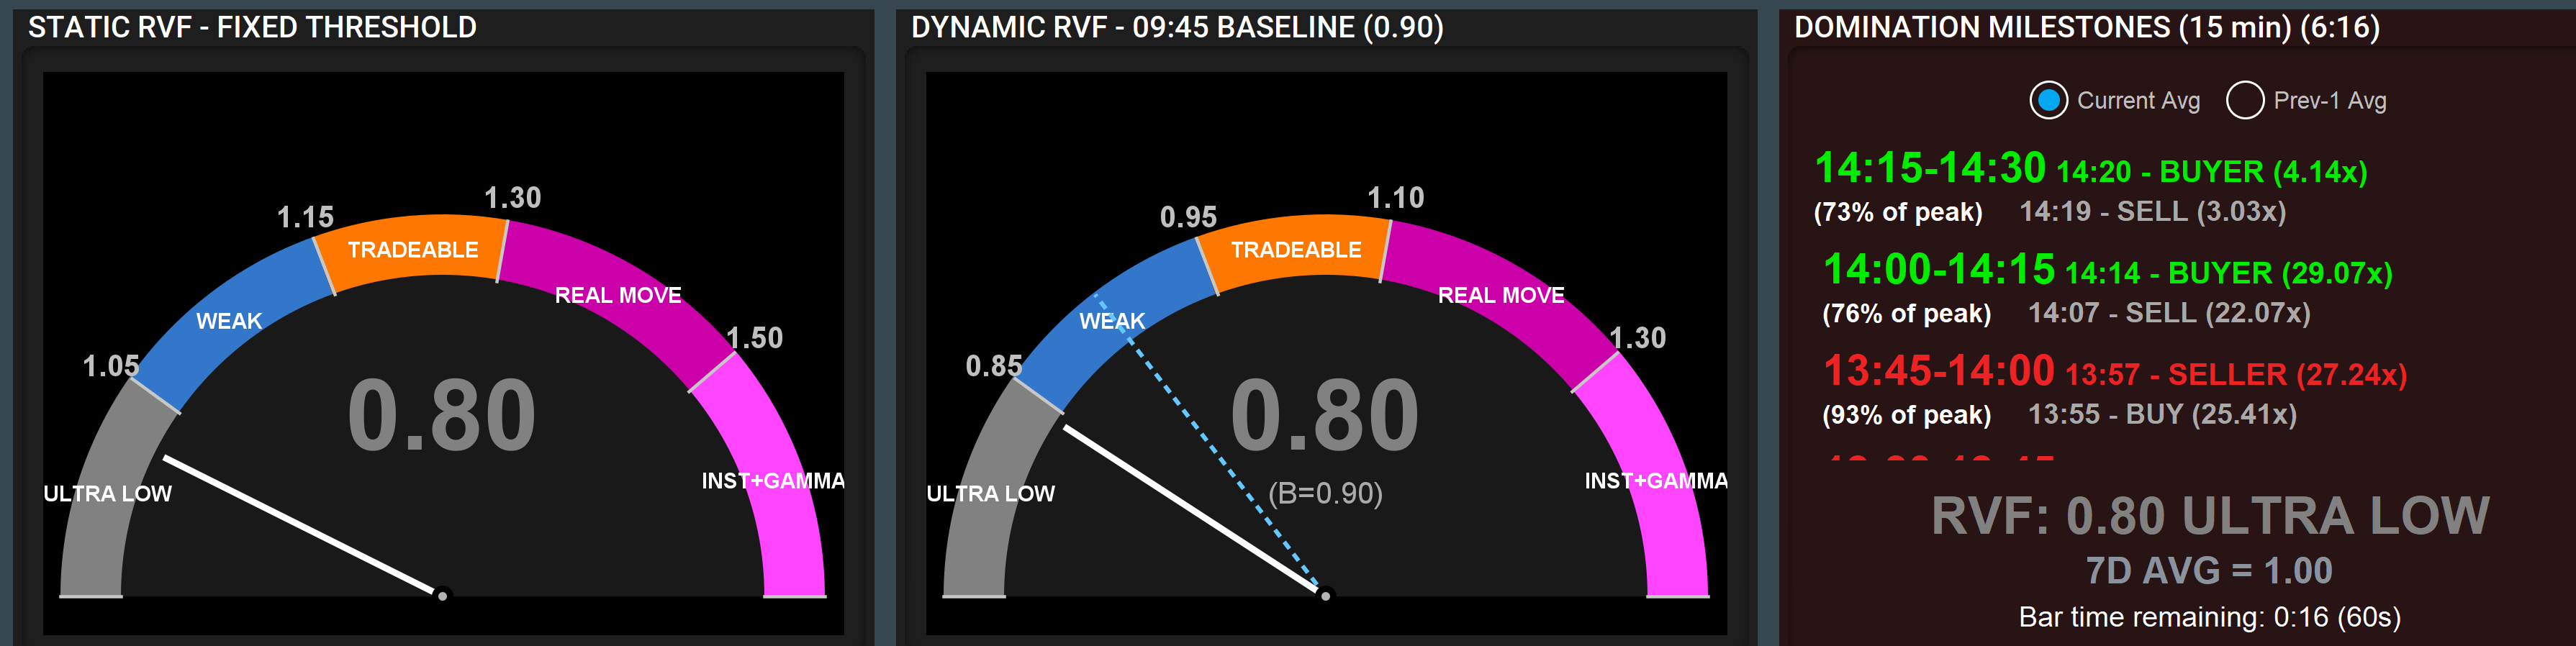
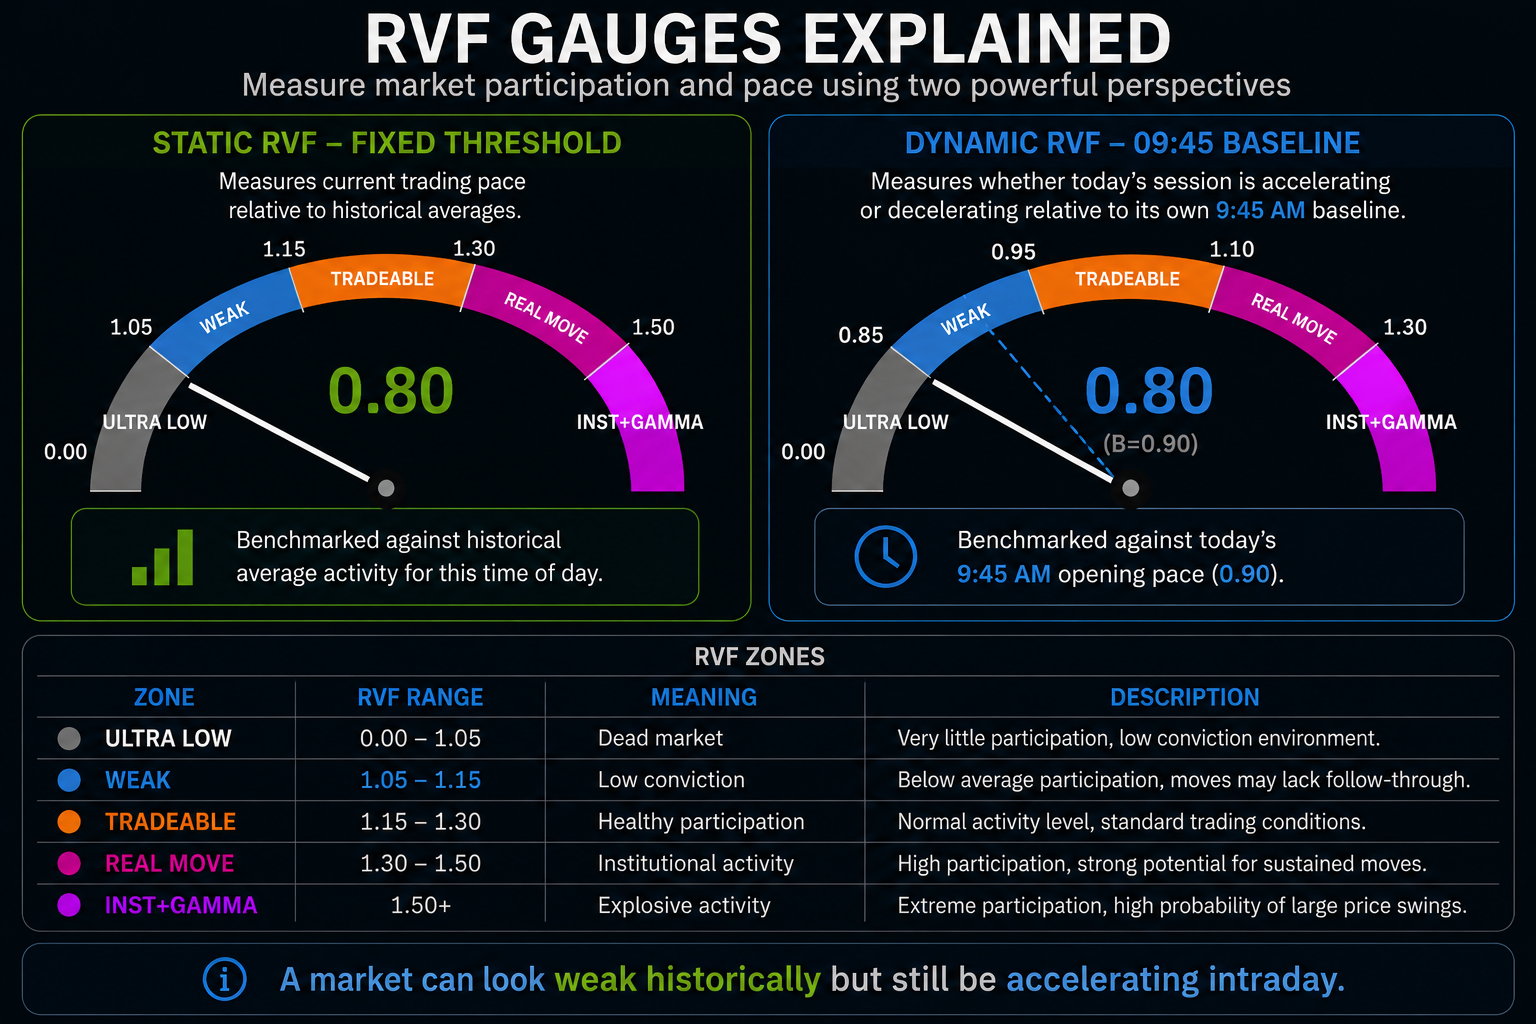
Static RVF Gauge
Purpose
Measures current trading pace relative to historical averages.
Logic & Formula: The gauge displays currentRVI (Relative Volume Index):
currentRVI = currentPace / historicalAvgPace
currentPace = total volume (buyers + sellers) in the current period, divided by elapsed minutes
historicalAvgPace = average totalAvg across completed historical periods of the same length
Dynamic RVF Gauge
Purpose
Measures whether today's session is accelerating or decelerating relative to its own 9:45 AM baseline.
Key Difference
- Static = compared to historical norm
- Dynamic = compared to today's opening pace
RVF Zones
|
|
|
|
|
|
|
|
|
|
|
|
|
|
|
|
|
|
|
|
|
|
|
|
Important Use
A market can look weak historically but still be accelerating intraday.
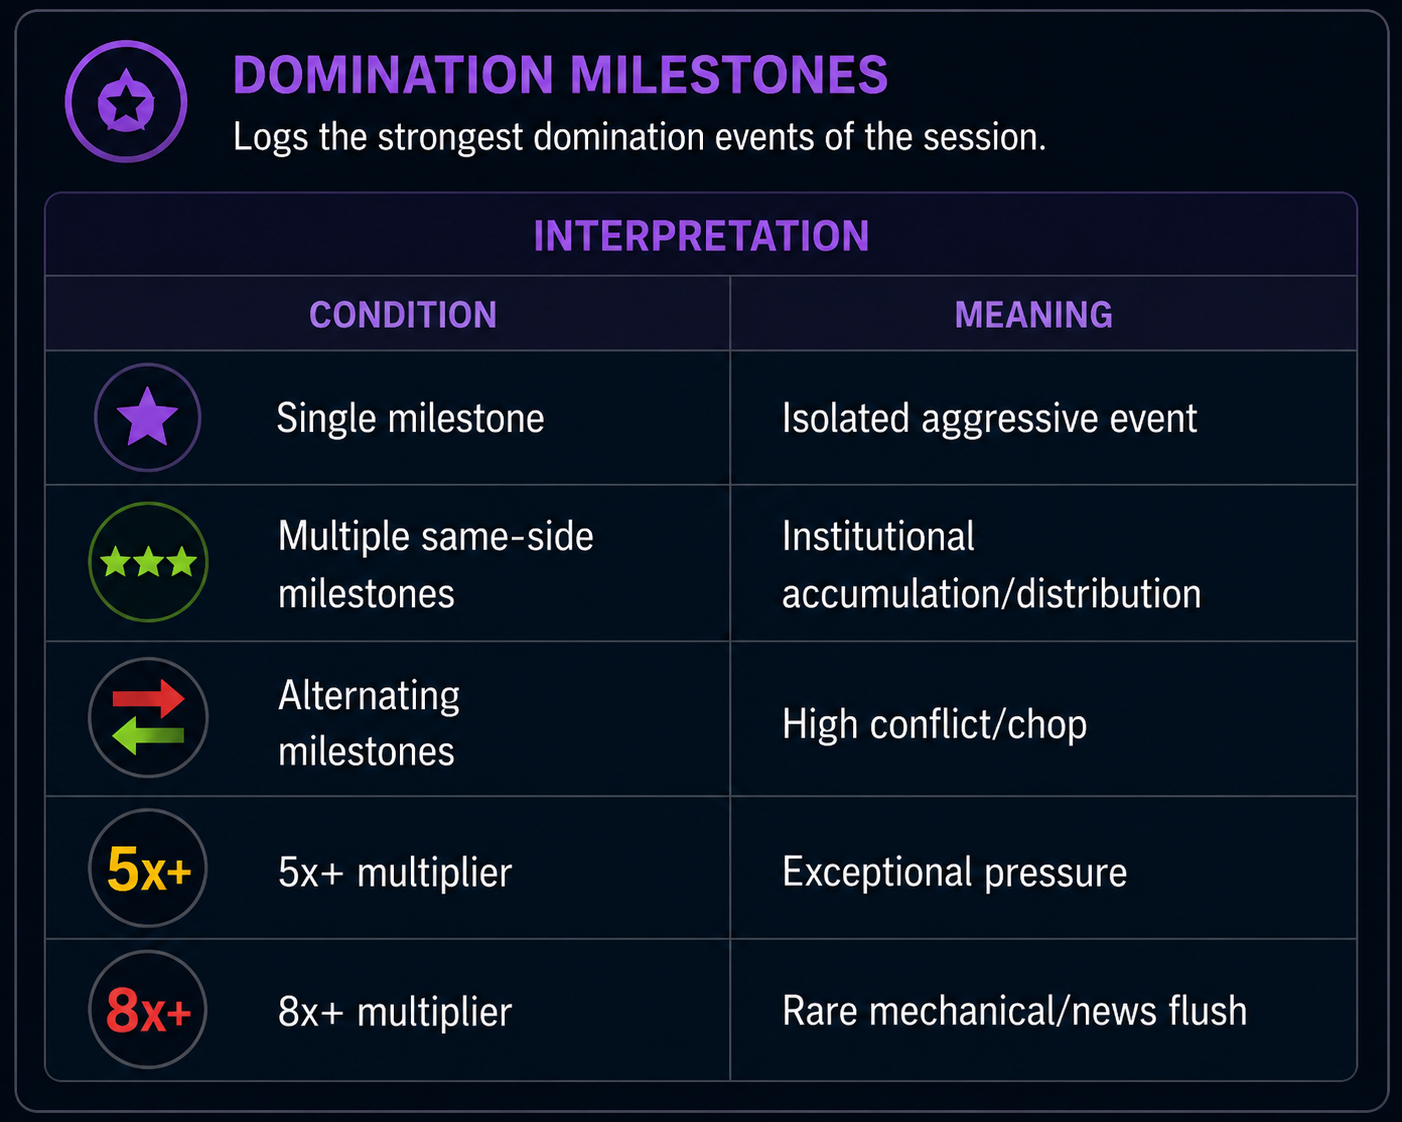
Domination Milestones
Purpose
Logs the strongest domination events of the session.
Logic & Formula: Each completed volume bar triggers this check:
dom = |buyerVolume − sellerVolume|
pct = ((dom / avgDom) − 1) × 100
where avgDom is either:
- Current Avg mode: live real-time dominating average (realTimeDomBuyerAvg or realTimeDomSellerAvg)
- Prev-1 Avg mode: the dominating average from the previous completed period (previousPeriod1.dominatingBuyerAvg / dominatingSellerAvg)
Milestones record only extreme events exceeding benchmark thresholds.
Interpretation
|
|
|
|
|
|
|
|
|
|
|
|
|
|
|
|
|
|
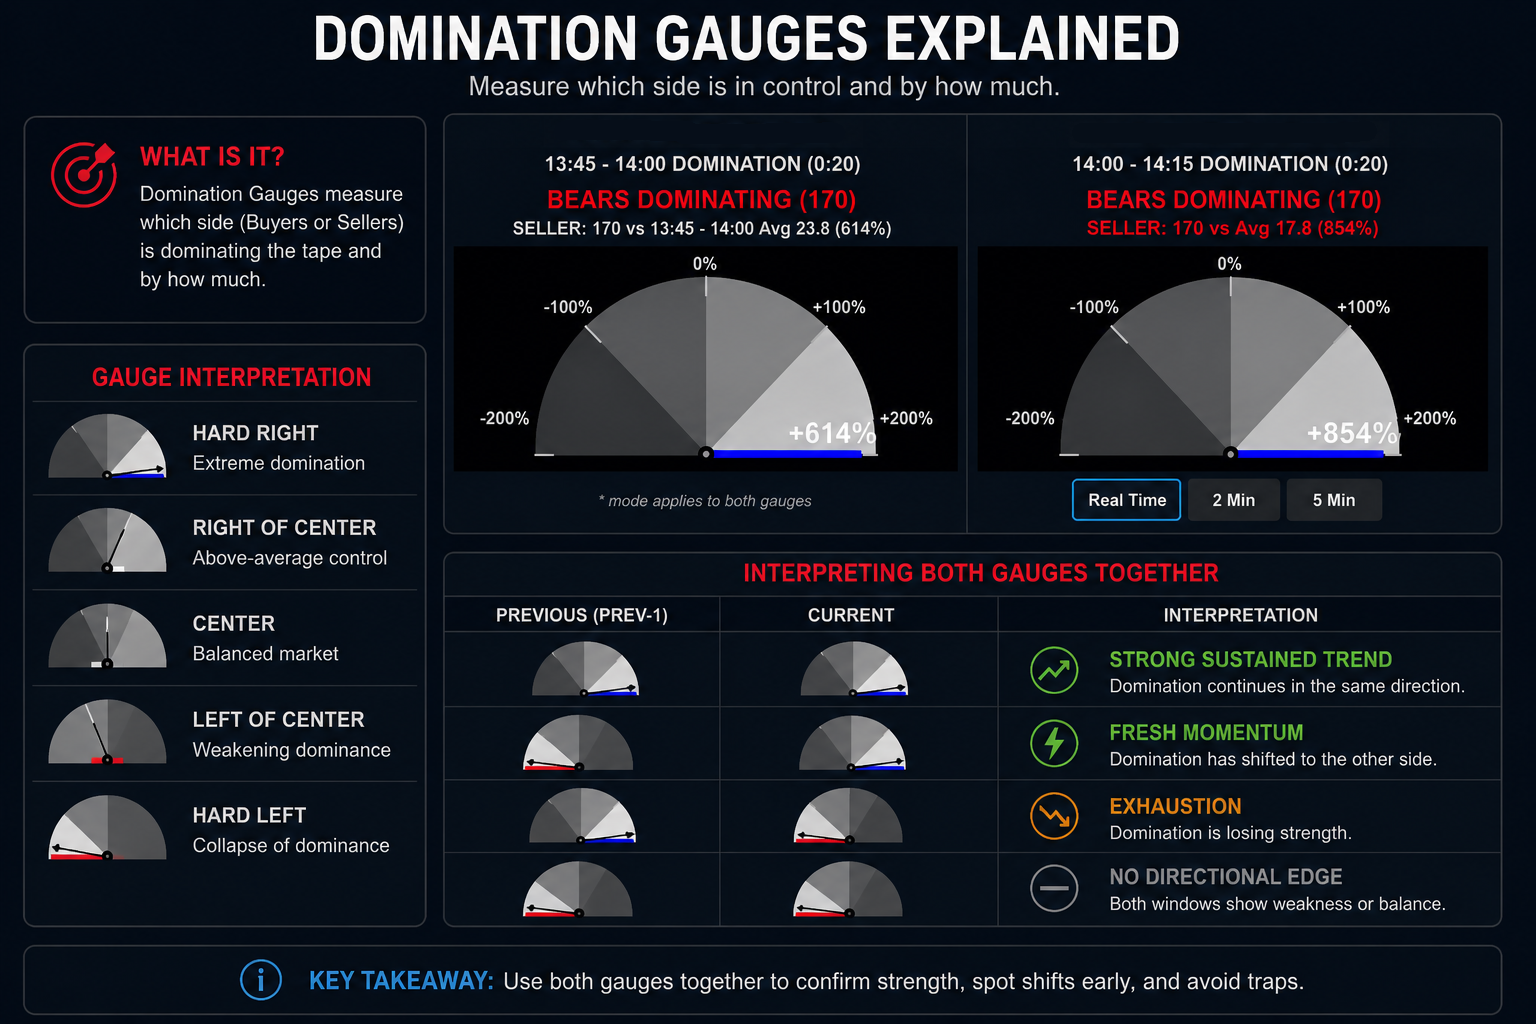
ROW 4 — Domination Gauges
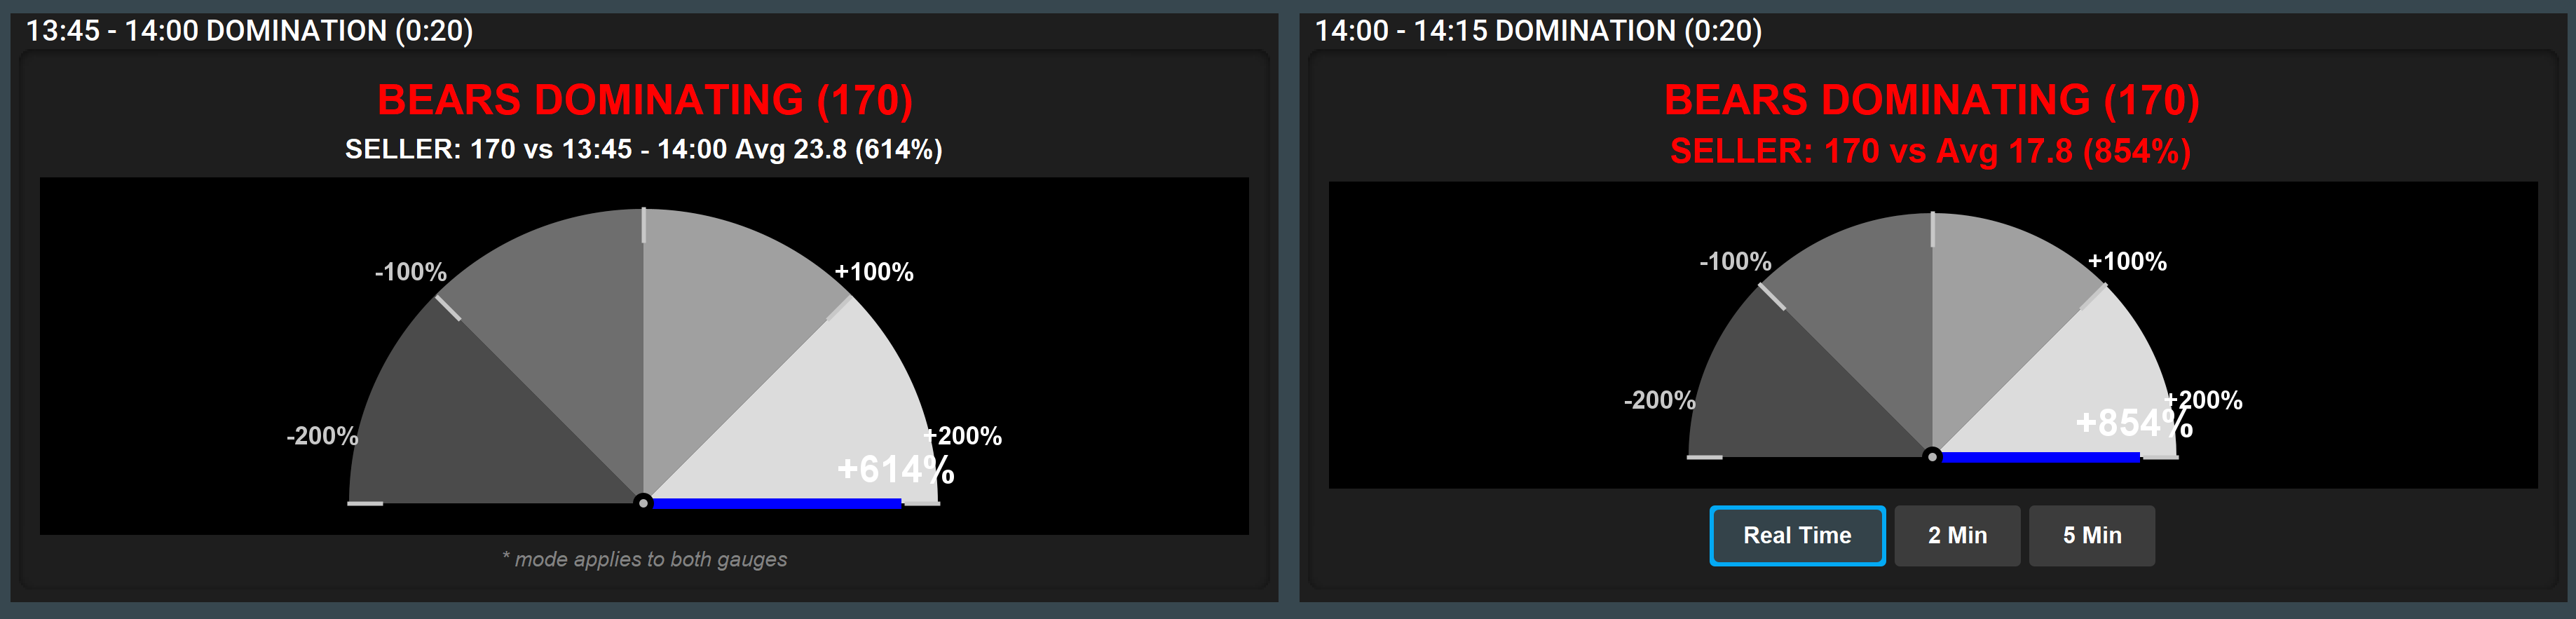
Purpose
Measures how extreme current domination is versus reference averages.
Two gauges:
- Prev-1 Domination
- Current Domination
Core Formula
Every volume bar produces a domination value:
dom = |buyerVolume − sellerVolume|
That value is compared against a reference average to produce a percentage:
pct = ((dom / avgDom) − 1) × 100
Gauge Interpretation
|
|
|
|
|
|
|
|
|
|
|
|
|
|
|
|
|
|
Interpreting Both Gauges Together
|
|
|
|
|
|
|
|
|
|
|
|
|
|
|
|
|
|
|
|
Window Modes
|
|
|
|
|
|
|
|
|
|
|
|
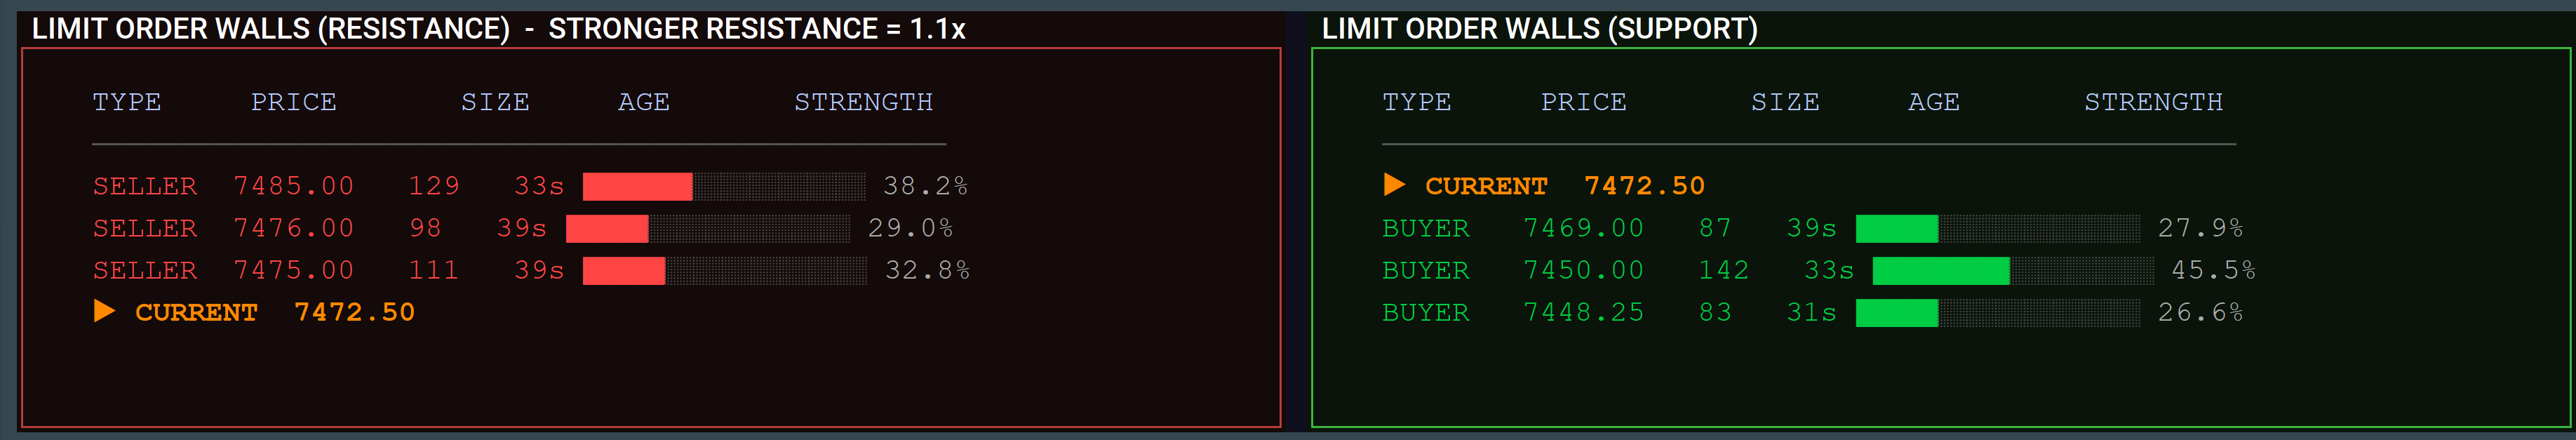
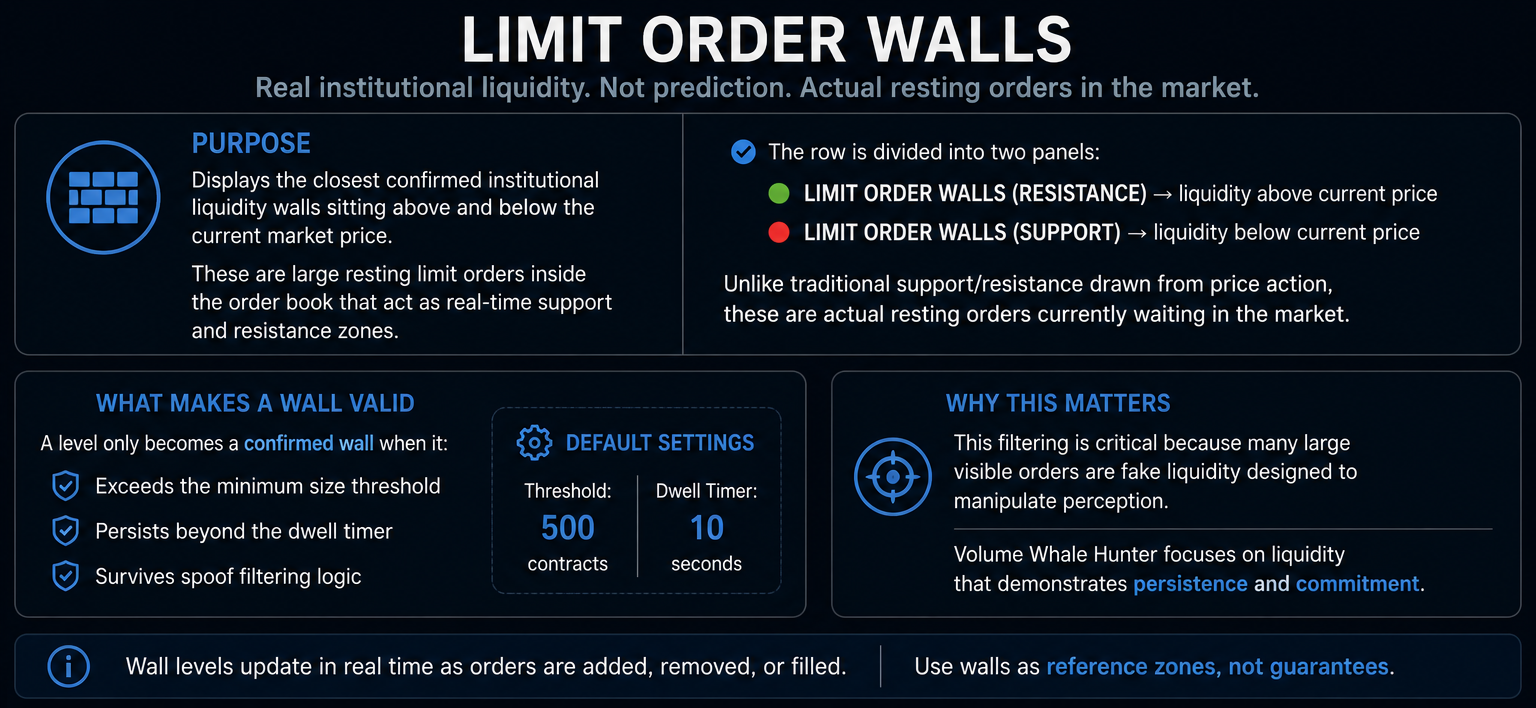
ROW 5 — Limit Order Walls
Purpose
Displays the closest confirmed institutional liquidity walls sitting above and below the current market price. These are large resting limit orders inside the order book that act as real-time support and resistance zones.
The row is divided into two panels:
- LIMIT ORDER WALLS (RESISTANCE) → liquidity above current price
- LIMIT ORDER WALLS (SUPPORT) → liquidity below current price
Unlike traditional support/resistance drawn from price action, these are actual resting orders currently waiting in the market.
What Makes a Wall Valid
A level only becomes a confirmed wall when it:
- Exceeds the minimum size threshold
- Persists beyond the dwell timer
- Survives spoof filtering logic
Default settings:
- Threshold = 500 contracts
- Dwell timer = 10 seconds
This filtering is critical because many large visible orders are fake liquidity designed to manipulate perception. Volume Whale Hunter focuses on liquidity that demonstrates persistence and commitment.
Panel Structure
Each side displays the nearest confirmed liquidity walls to the current price.
|
|
|
|
|
|
|
|
|
|
|
|
|
|
|
|
|
|
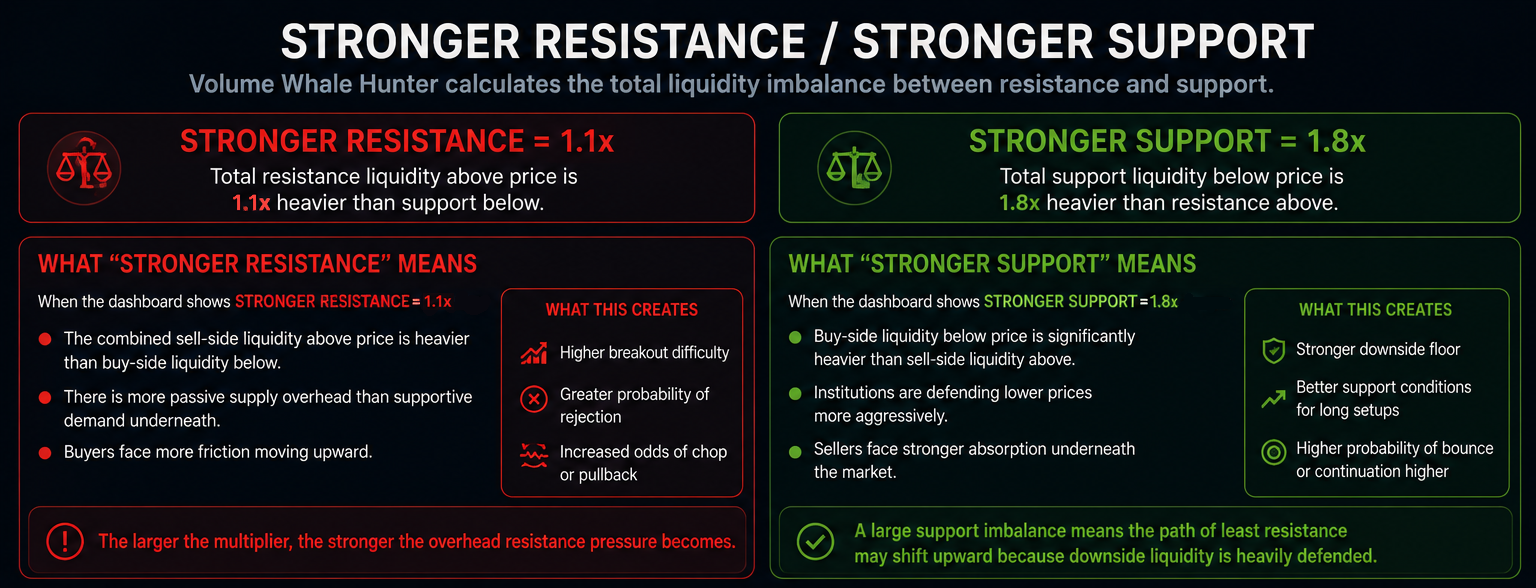
Stronger Resistance / Stronger Support
At the top of each panel, Volume Whale Hunter dynamically calculates the total liquidity imbalance between resistance and support.
Example:
- STRONGER RESISTANCE = 1.1x
- STRONGER SUPPORT = 1.8x
This is one of the most important contextual signals in Row 5.
What “Stronger Resistance” Means
When the dashboard shows:
STRONGER RESISTANCE = 1.1x
It means:
- The combined sell-side liquidity above price is heavier than the combined buy-side liquidity below price
- There is more passive supply overhead than supportive demand underneath
- Buyers face more friction moving upward
This creates:
- Higher breakout difficulty
- Greater probability of rejection
- Increased odds of chop or pullback if buyers cannot absorb the walls
The larger the multiplier:
- The stronger the overhead resistance pressure becomes
What “Stronger Support” Means
When the dashboard shows:
STRONGER SUPPORT = 1.8x
It means:
- Buy-side liquidity below price is significantly heavier than sell-side liquidity above
- Institutions are defending lower prices more aggressively
- Sellers face stronger absorption underneath the market
This creates:
- A stronger downside floor
- Better support conditions for long setups
- Higher probability of bounce or continuation higher
A large support imbalance means:
- The path of least resistance may shift upward because downside liquidity is heavily defended
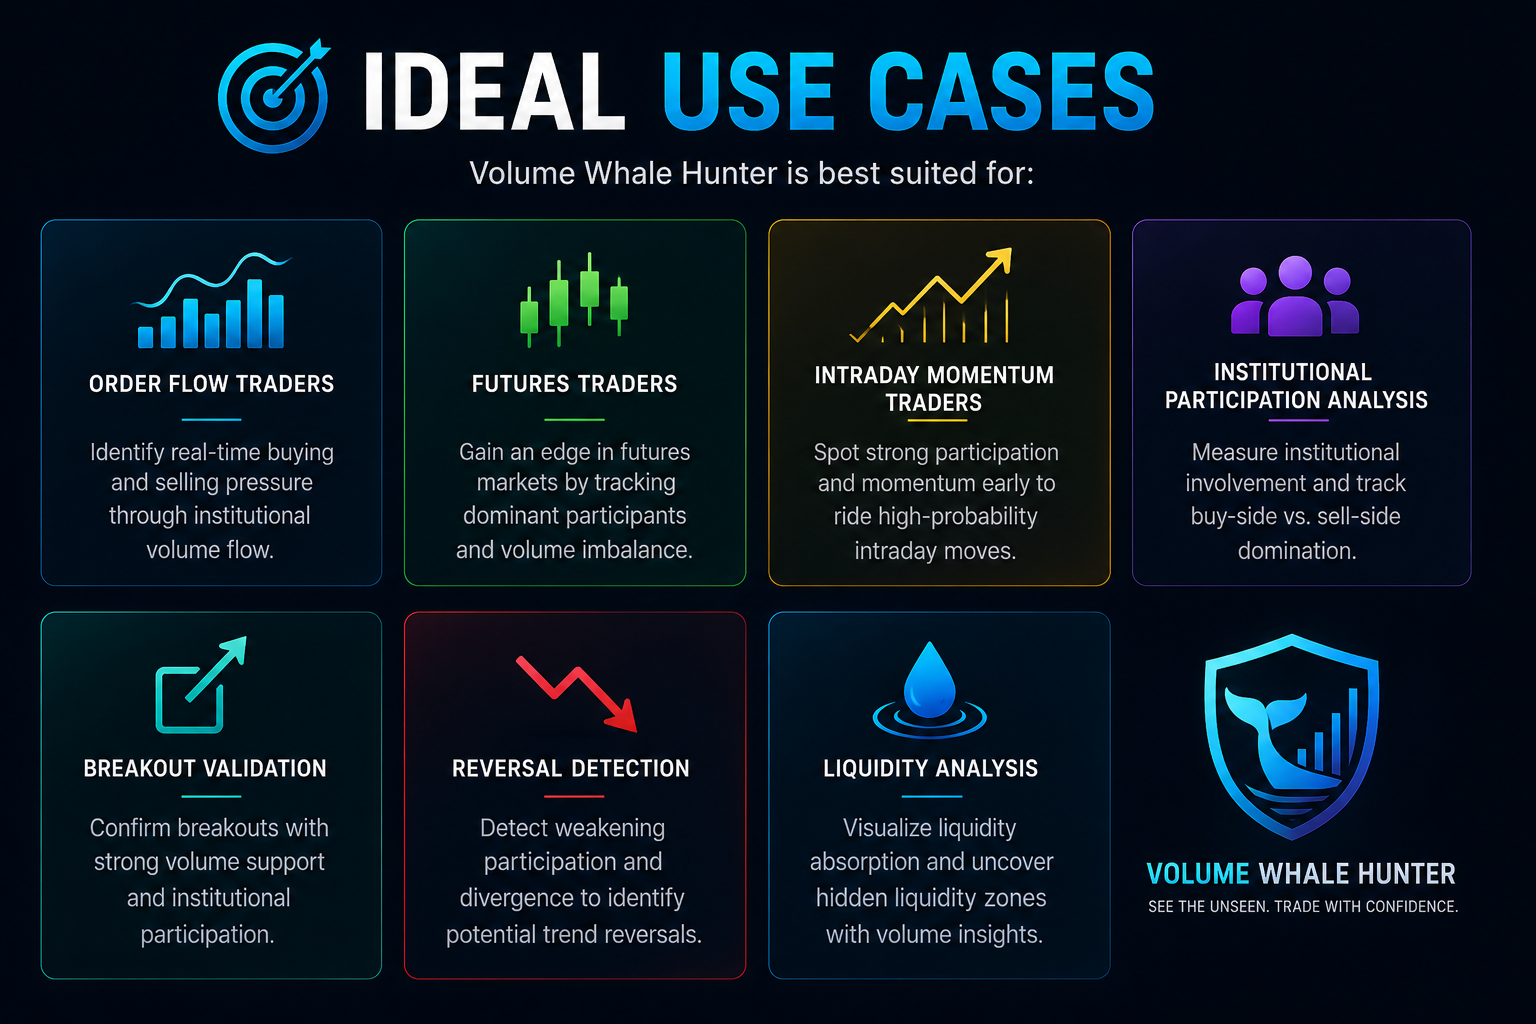
Ideal Use Cases
Volume Whale Hunter is best suited for:
- Order flow traders
- Futures traders
- Intraday momentum traders
- Institutional participation analysis
- Breakout validation
- Reversal detection
- Liquidity analysis
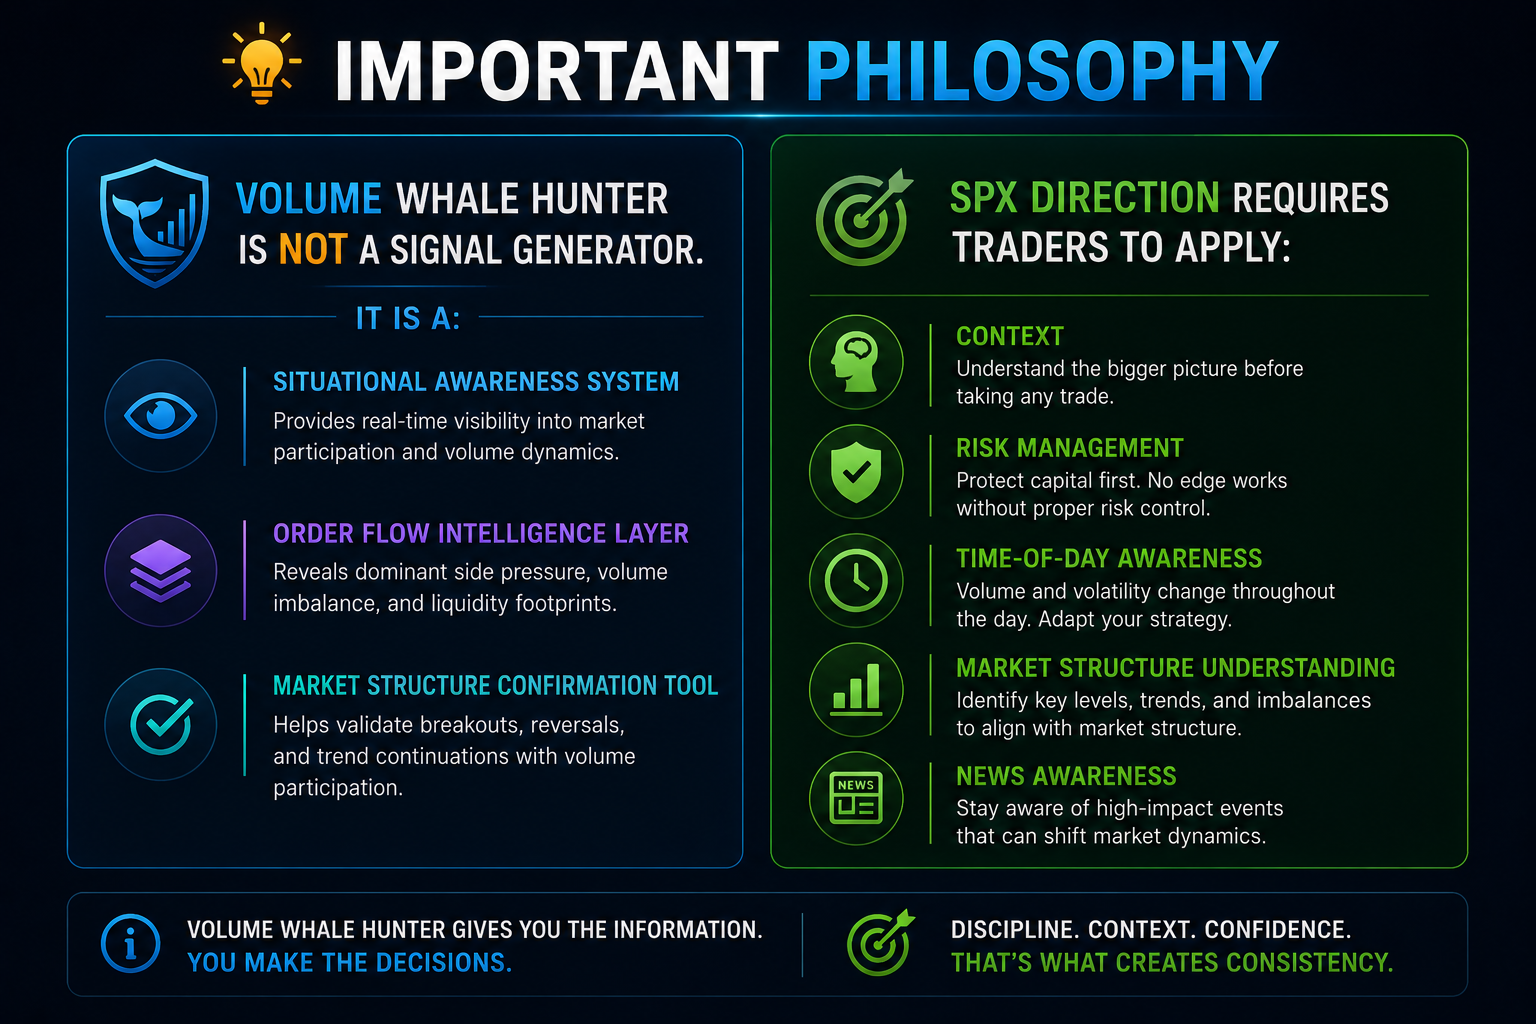
Important Philosophy
Volume Whale Hunter is not a signal generator.
It is a:
- Situational awareness system
- Order flow intelligence layer
- Market structure confirmation tool
SPX Direction requires traders to apply:
- Context
- Risk management
- Time-of-day awareness
- Market structure understanding
- News awareness