Momentum Analysis (MA)
Contact customer support at support@spxdirection.com
Momentum Acceleration (MA)
Measures how fast momentum is increasing or decreasing — not just direction, but change in speed
🧠 Formula
MA = (Current 5m return) − (Previous 5m return)
Where:
- 5m return = % change of each 5-minute candle
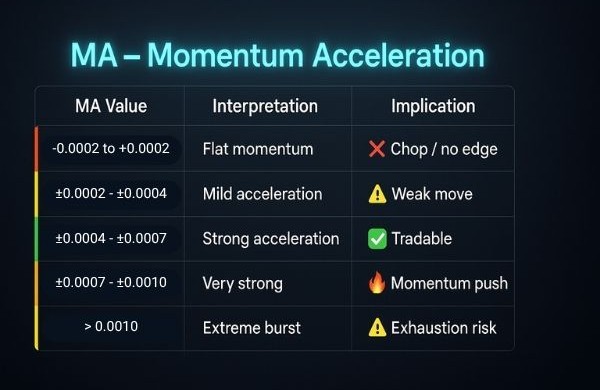
🧠 HOW TO INTERPRET MA FOR ES
|
MA Value |
Interpretation | Implication |
|
-0.0002 to +0.0002 |
Flat momentum |
❌ Chop / no edge |
|
±0.0002 – ±0.0004 |
Mild acceleration |
⚠️ Weak move |
|
±0.0004 – ±0.0007 |
Strong acceleration |
✅ Tradable |
|
±0.0007 – ±0.0010 |
Very strong |
🔥 Momentum push |
|
> ±0.0010 |
Extreme burst |
⚠️ Exhaustion risk |
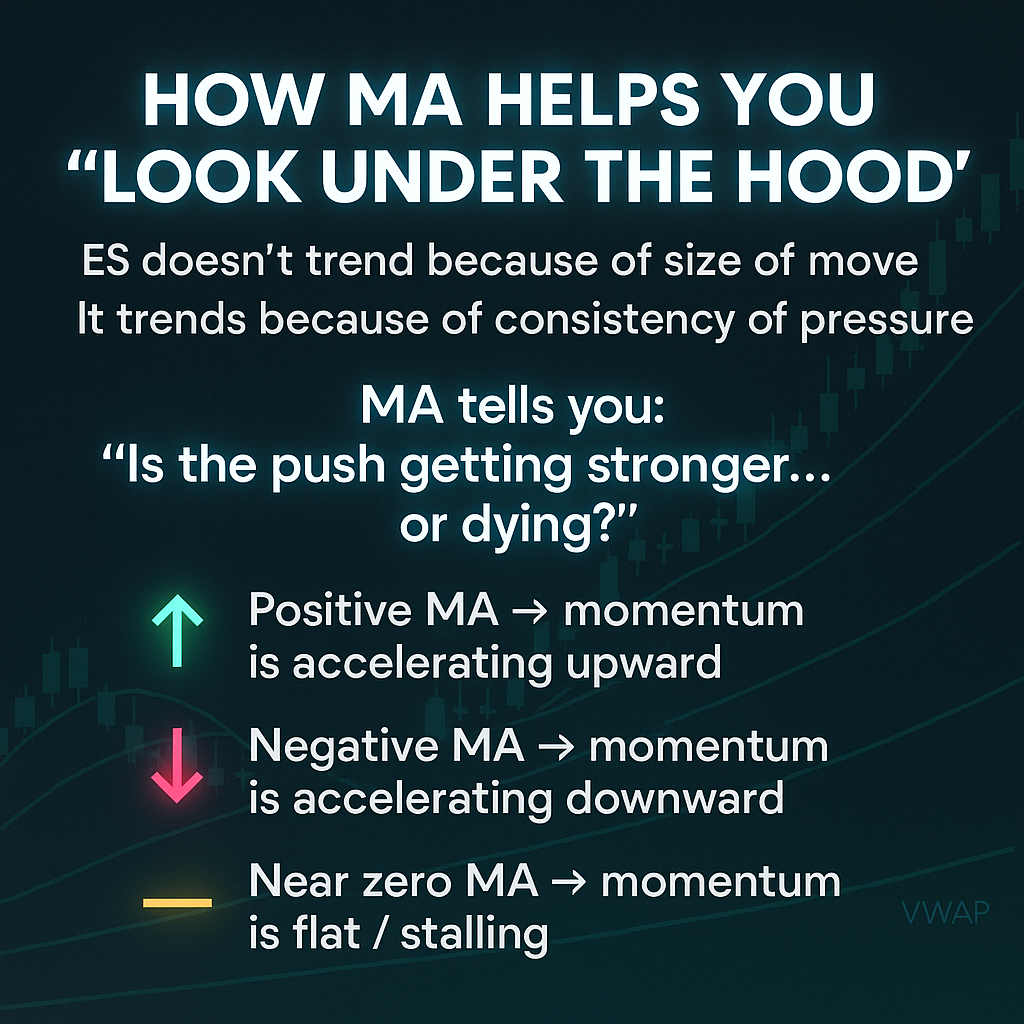
🧠 HOW MA HELPS YOU “LOOK UNDER THE HOOD”
- ES doesn’t trend because of size of move
- It trends because of consistency of pressure
MA tells you:
“Is the push getting stronger… or dying?”
- Positive MA → momentum is accelerating upward
- Negative MA → momentum is accelerating downward
- Near zero MA → momentum is flat / stalling
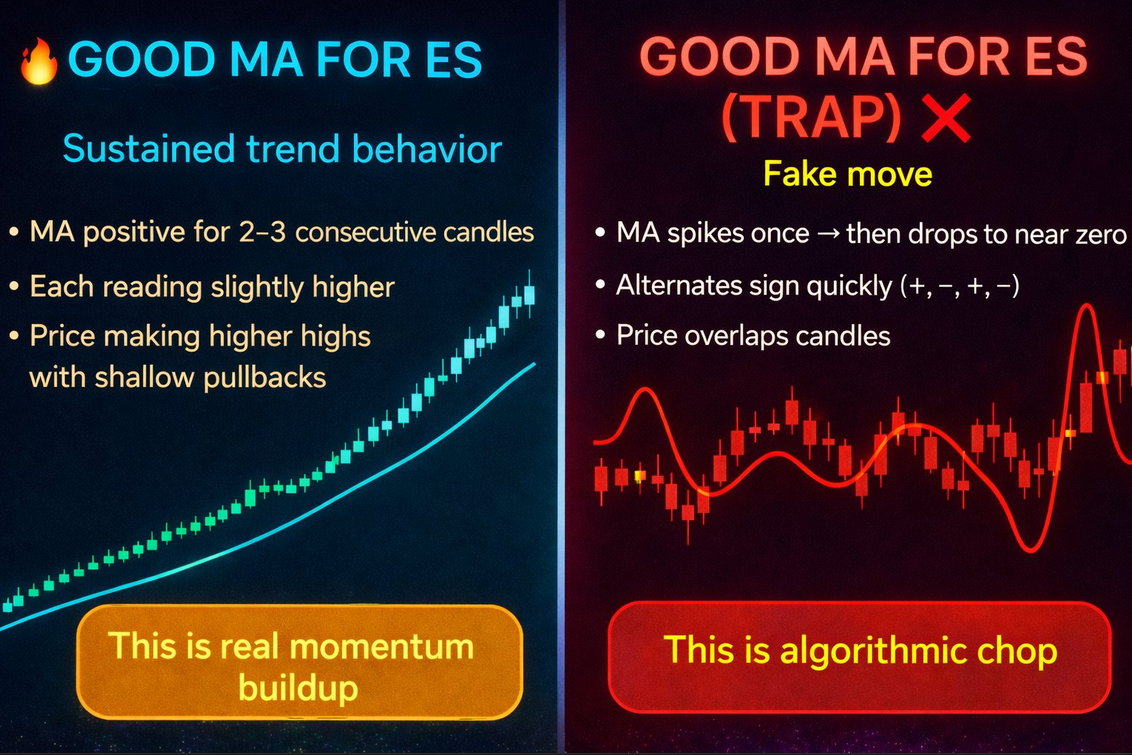
🔥 GOOD MA FOR ES
✅ Sustained trend behavior
- MA positive for 2–3 consecutive candles
- Each reading slightly higher
- Price making higher highs with shallow pullbacks
👉 This is real momentum buildup
❌ GOOD MA FOR ES (TRAP)
🚩 Fake move
- MA spikes once → then drops to near zero
- Alternates sign quickly (+, -, +, -)
- Price overlaps candles
👉 This is algorithmic chop
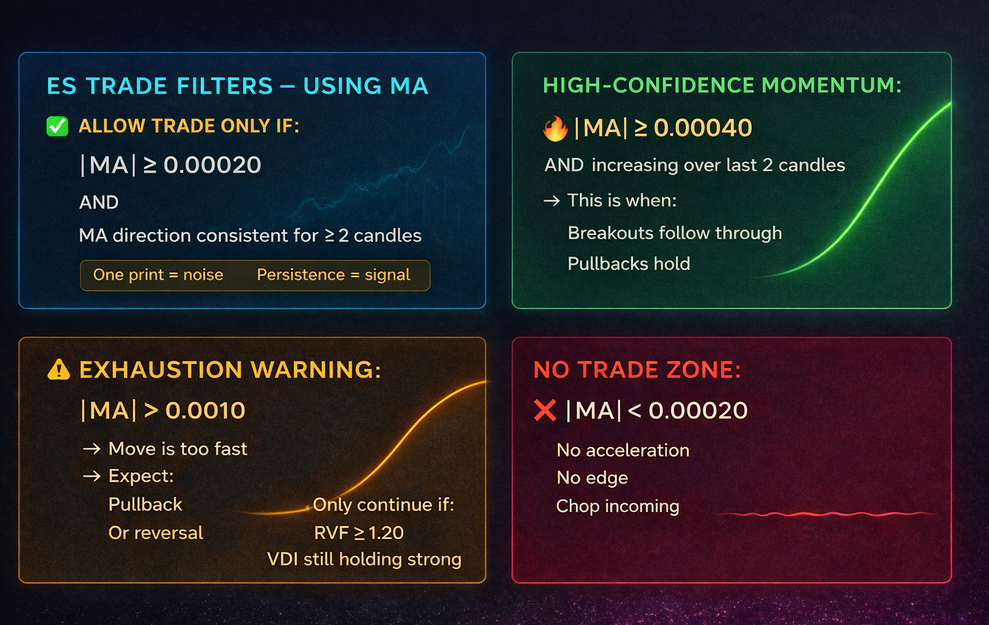
🛡️ ES TRADE FILTERS — USING MA
✅ ALLOW TRADE ONLY IF:
|MA| ≥ 0.00020
AND
MA direction consistent for ≥ 2 candles
👉 One print = noise
👉 Persistence = signal
🔥 HIGH-CONFIDENCE MOMENTUM:
|MA| ≥ 0.00040
AND
increasing over last 2 candles
→ This is when:
- Breakouts follow through
- Pullbacks hold
⚠️ EXHAUSTION WARNING:
|MA| > 0.0010
→ Move is too fast
→ Expect:
- Pullback
- Or reversal
Only continue if:
- RVF ≥ 1.20
- VDI still holding strong
❌ NO TRADE ZONE:
|MA| < 0.00020
- No acceleration
- No edge
- Chop incoming
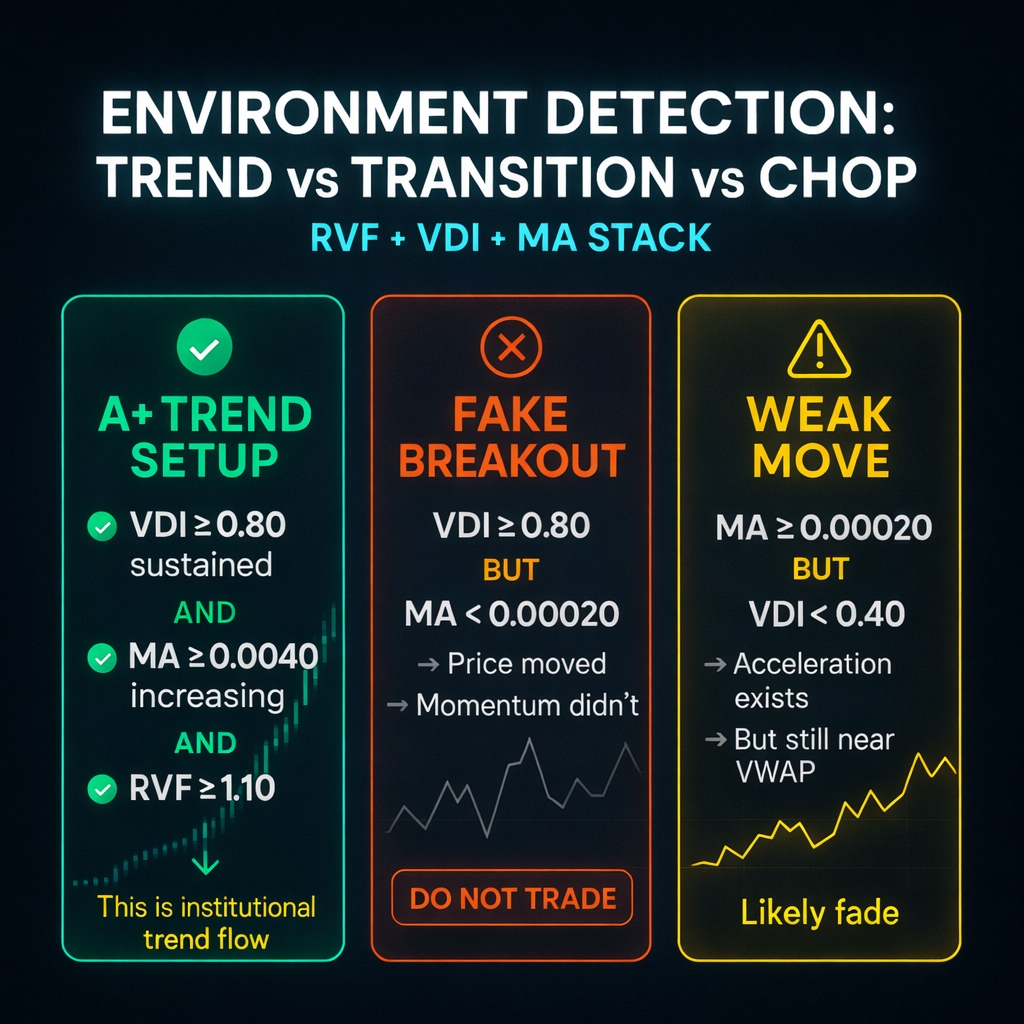
🔁 ENVIRONMENT DETECTION (TREND vs TRANSITION vs CHOP) WITH RVF + VDI + MA STACK
🔥 A+ TREND SETUP
VDI ≥ 0.80 sustained
AND
MA ≥ 0.00040 increasing
AND
RVF ≥ 1.10
→ This is institutional trend flow
❌ FAKE BREAKOUT
VDI ≥ 0.80
BUT
MA < 0.00020
→ Price moved
→ Momentum didn’t
👉 DO NOT TRADE
⚠️ WEAK MOVE
MA ≥ 0.00020
BUT
VDI < 0.40
→ Acceleration exists
→ But still near VWAP
👉 Likely fade
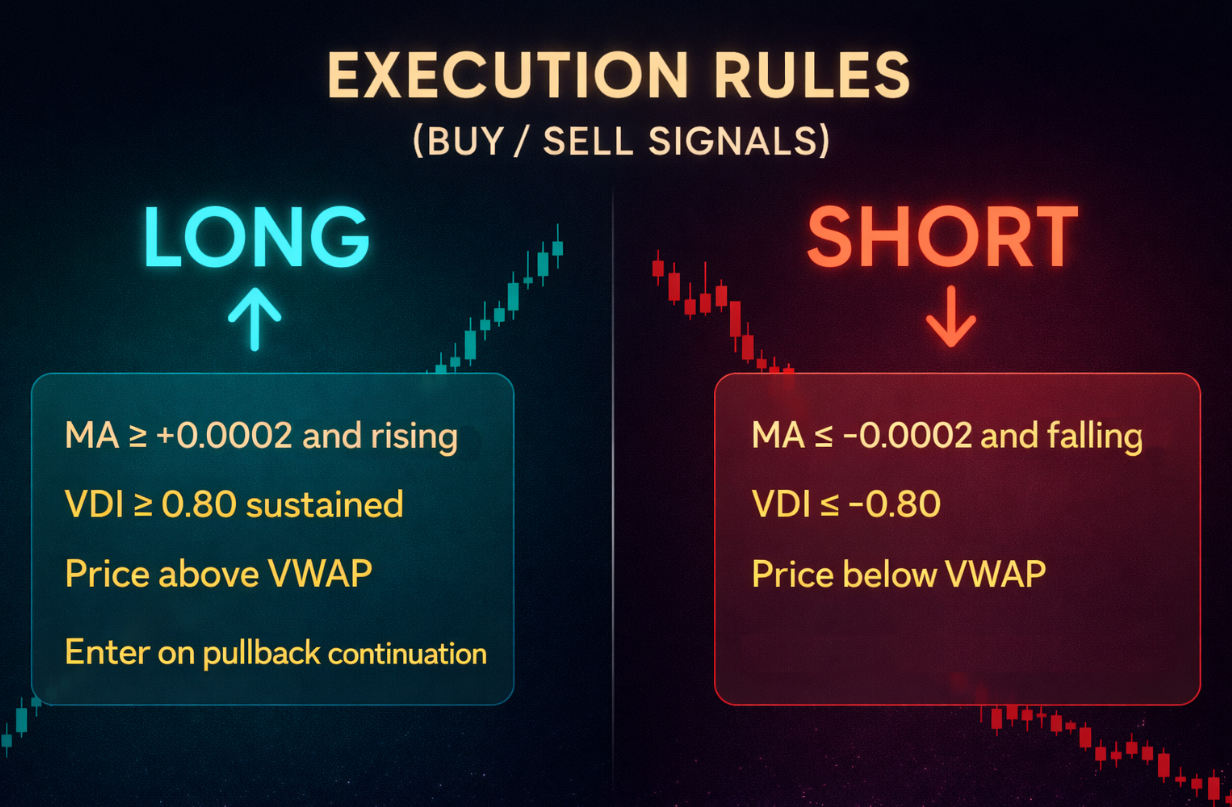
⚡ EXECUTION RULES (BUY / SELL SIGNALS)
LONG
- MA ≥ +0.0002 and rising
- VDI ≥ +0.80 sustained
- Price above VWAP
- Enter on pullback continuation
SHORT
- MA ≤ -0.0002 and falling
- VDI ≤ -0.80
- Price below VWAP
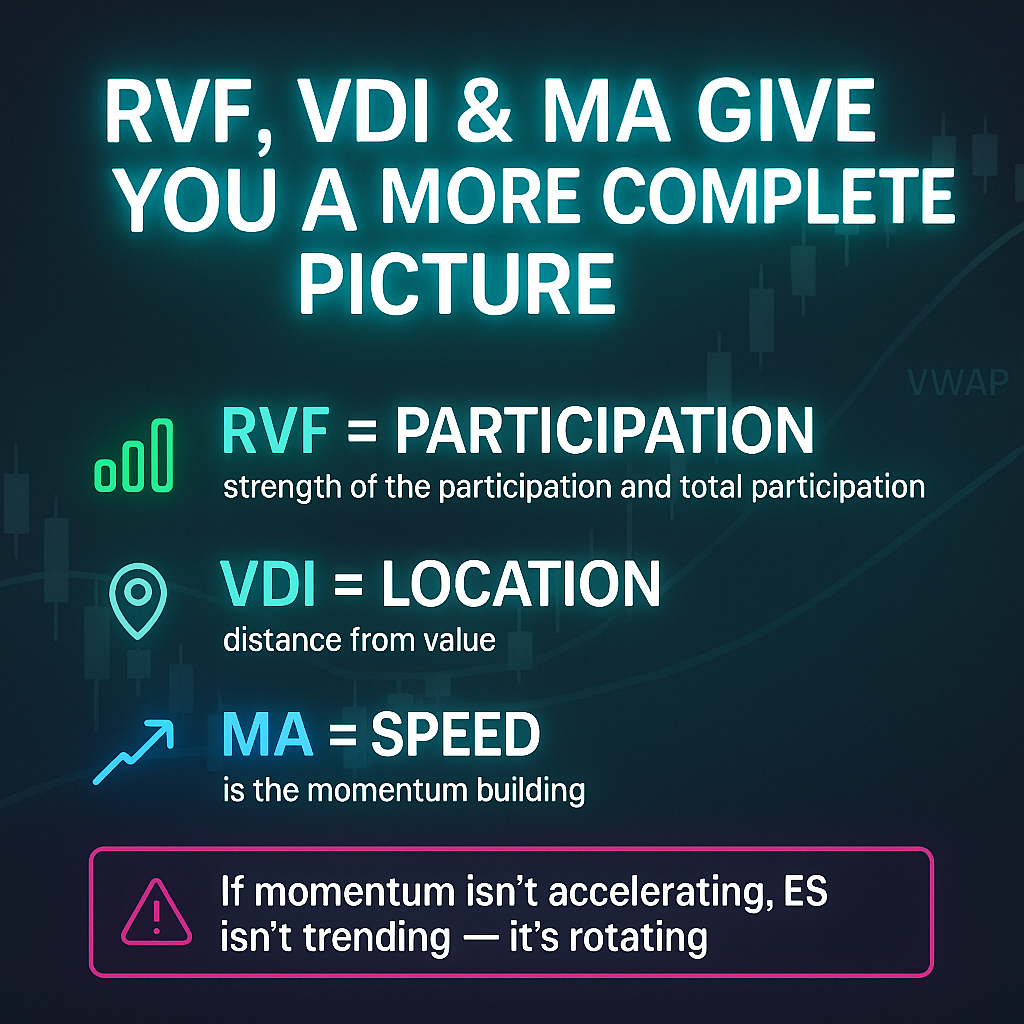
🧠 RVF, VDI & MA GIVE YOU A MORE COMPLETE PICTURE
- RVF = participation (strength of the participation and total participation)
- VDI = location (distance from value)
- MA = speed (is the momentum building)
If momentum isn’t accelerating, ES isn’t trending — it’s rotating.