Relative Volume Factor (RVF)
Contact customer support at support@spxdirection.com
Relative Volume Factor (RVF)
Price can move without volume - but it won’t sustain without it. RVF is the truth filter for our members. It tells you:
“How much participation is there right now compared to normal at this exact time of day over the past 5 days?”
🧠 Formula
RVF = Current cumulative volume ÷ Average cumulative volume at same time (last 5 days)
📊 Example
At 10:00 AM:
- Today volume so far = 1.2 million
- 10-day average at 10:00 AM = 1.0 million
RVF = 1.2 / 1.0 = 1.20
👉 That means 20% more participation than normal. SPX Direction calibrates RVF in real time to help members understand ES’s institutional, stable flow.
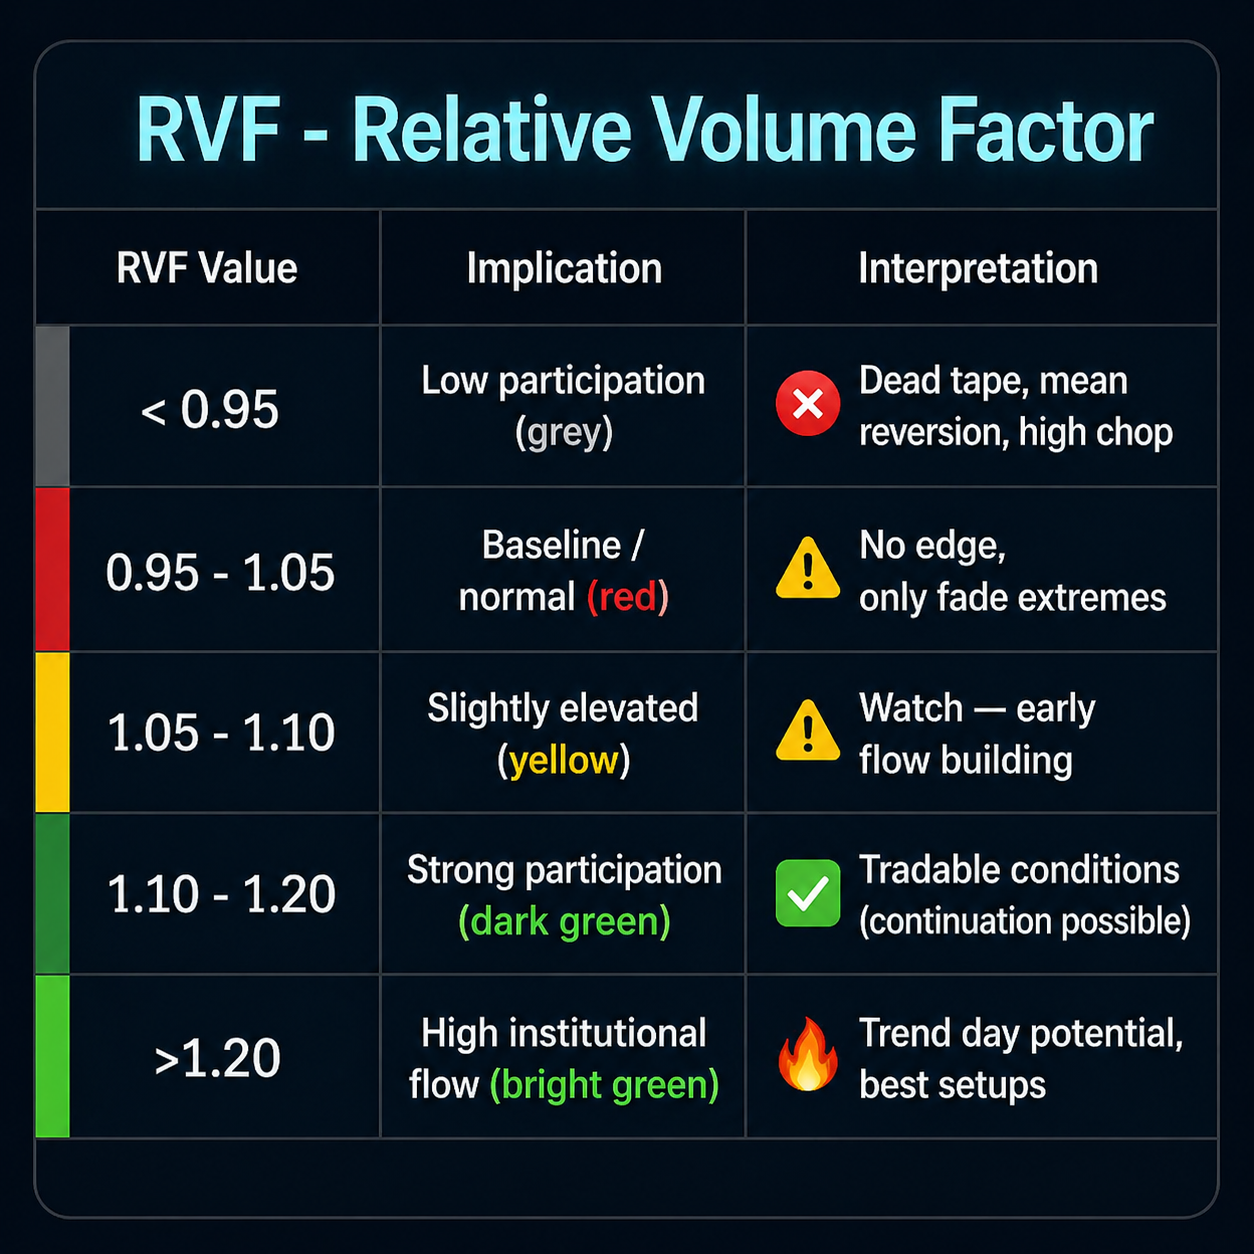
🎯 HOW TO INTERPRET RVF FOR ES
|
RVF |
Implication |
Interpretation |
|
< 0.95 |
Low participation (grey) |
❌ Dead tape, mean reversion, high chop risk |
|
0.95 – 1.05 |
Baseline / normal (red) |
⚠️ No edge, only fade extremes |
|
1.05 – 1.10 |
Slightly elevated (yellow) |
⚠️ Watch — early flow building |
|
1.10 – 1.20 |
Strong participation (dark green) |
✅ Tradable conditions (continuation possible) |
|
> 1.20 |
High institutional flow (bright green) |
🔥 Trend day potential, best setups |
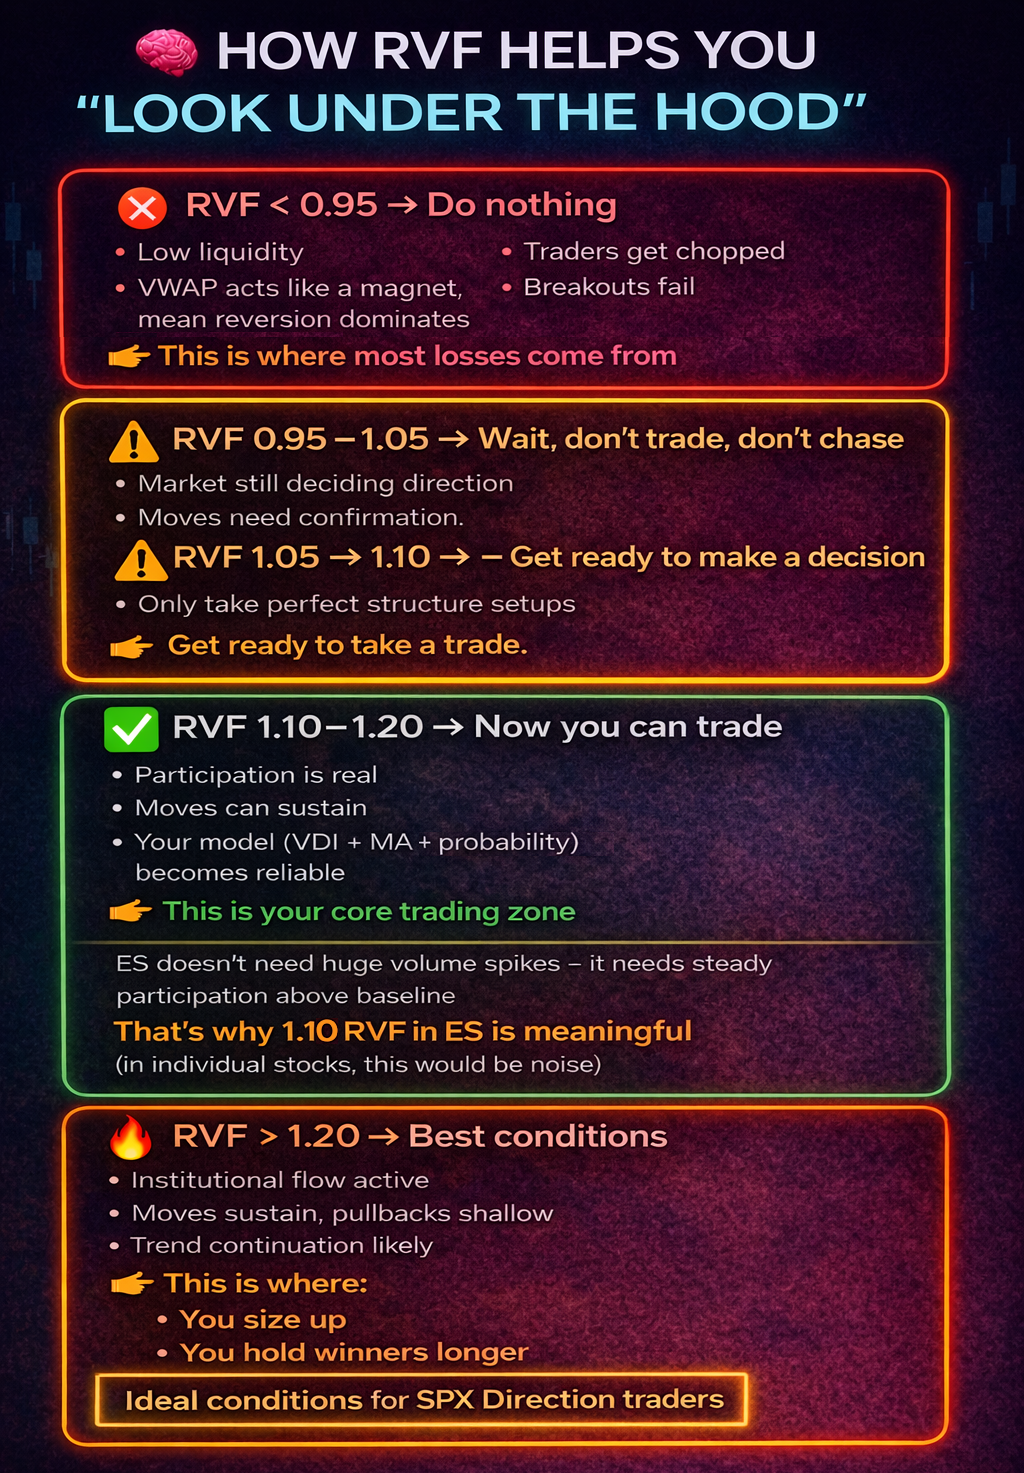
🧠 HOW RVF HELPS YOU “LOOK UNDER THE HOOD”
❌ RVF < 0.95 → Do nothing
- Low liquidity
- VWAP acts like a magnet, mean reversion dominates
- Breakouts fail
- Traders get chopped
👉 This is where most losses come from
⚠️ RVF 0.95 – 1.05 → Wait, don’t trade, don’t chase
- Market still deciding direction
- Moves need confirmation.
⚠️ RVF 1.05 → 1.10 → Get ready to make a decision
- Only take perfect structure setups
👉 Get ready to take a trade.
✅ RVF 1.10–1.20 → Now you can trade
- Participation is real
- Moves can sustain
- Your model (VDI + MA + probability) becomes reliable
👉 This is your core trading zone
ES doesn’t need huge volume spikes - it needs steady participation above baseline
That’s why 1.12 RVF in ES is meaningful (in individual stocks, this would be noise)
🔥 RVF > 1.20 → Best conditions
- Institutional flow active
- Moves sustain, pullbacks shallow
- Trend continuation likely
👉 This is where:
- You size up
- You hold winners longer
Ideal conditions for SPX Direction traders
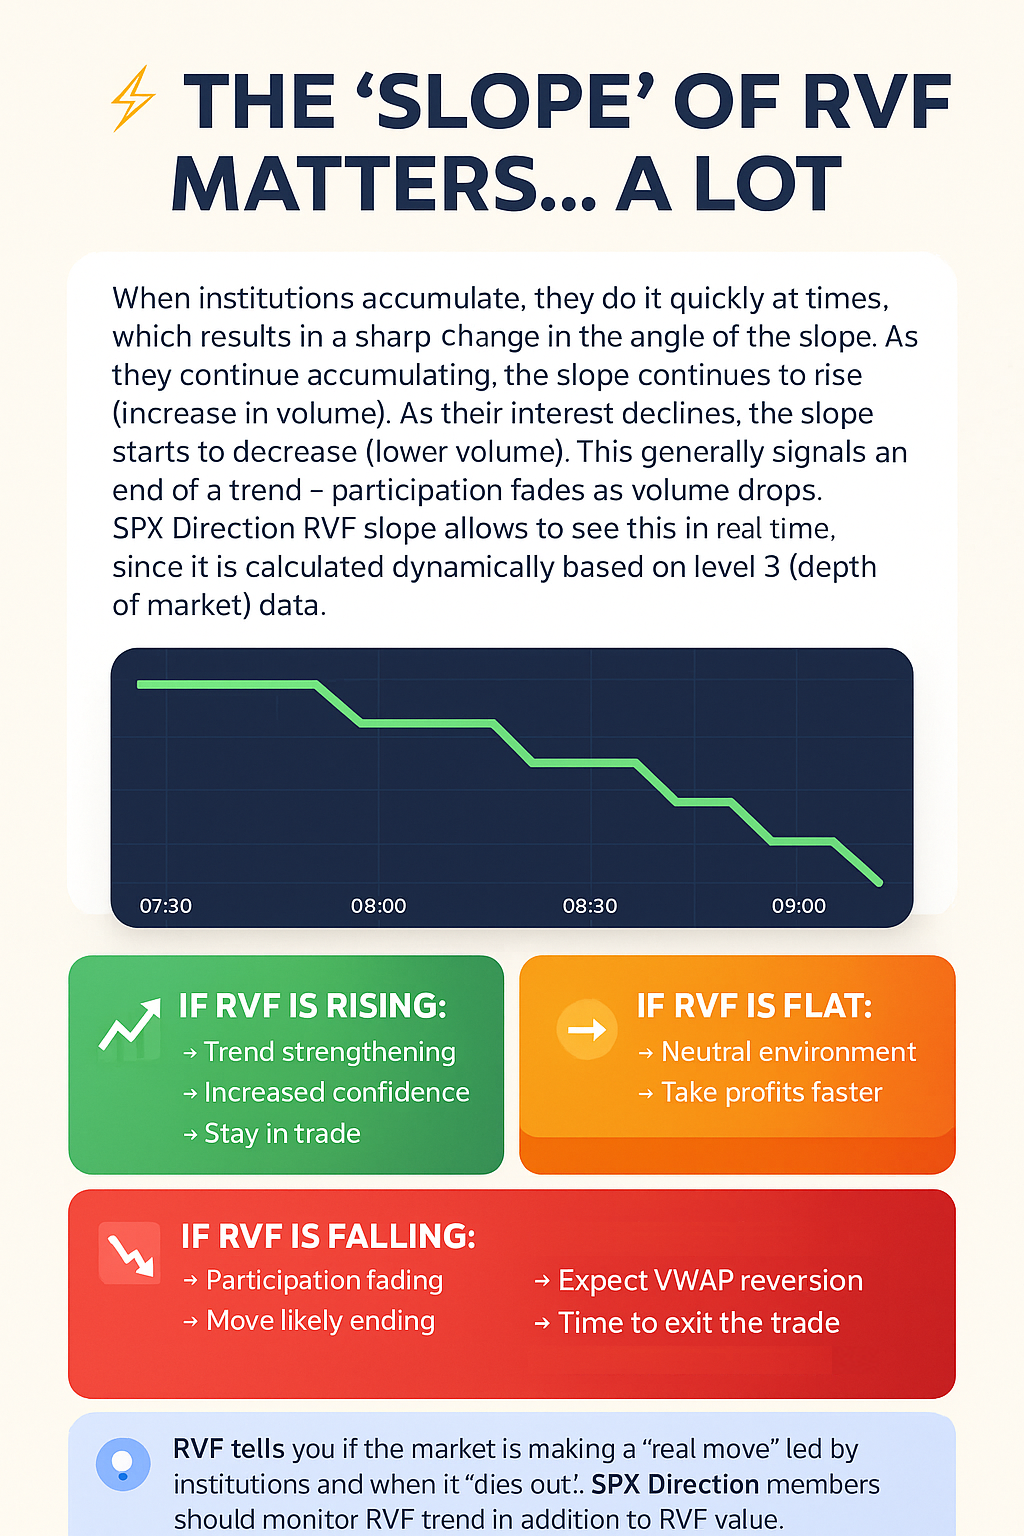
⚡ THE ‘SLOPE’ OF RVF MATTERS… A LOT
The sharper the angle of the slope, the faster the change in volume.
When institutions accumulate, they do it quickly at times, which results in a sharp change in the angle of the slope. As they continue accumulating, the slope continues to rise (increase in volume). As their interest declines, the slope starts to fall (decrease in volume). This generally signals the end of a trend - participation fades as volume drops. The SPX Direction RVF slope allows you to see this in real time, since it is calculated dynamically based on level 3 (depth of market) data.
If RVF is rising, it means:
→ Trend strengthening
→ Increased confidence
→ Stay in trade
If RVF is flat, it means:
→ Neutral environment
→ Take profits faster
If RVF is falling, it means:
→ Participation fading
→ Move likely ending
→ Expect VWAP reversion
→ Time to exit the trade
RVF tells you if the market is making a ‘real move’ led by institutions and when it ‘dies out’. SPX Direction members should monitor RVF trend in addition to RVF value.
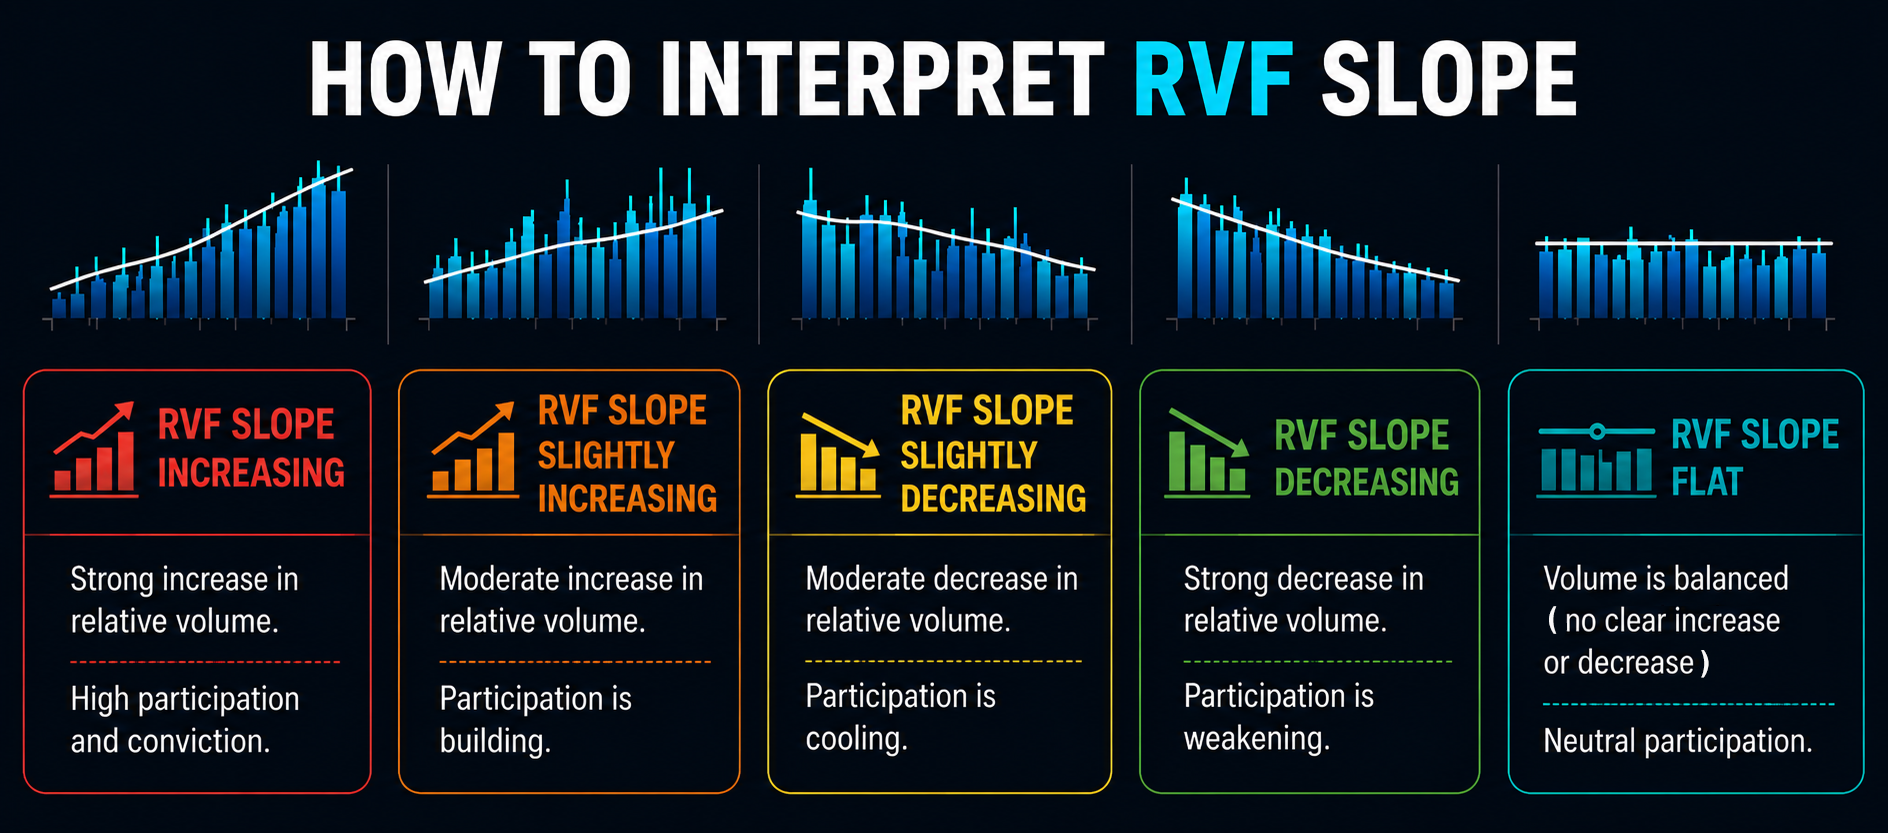
🧠 HOW TO INTERPRET RVF SLOPE
RVF helps SPX Direction members evaluate whether market participation is strengthening, weakening, or remaining neutral.
As RVF increases:
- participation improves
- continuation probability increases
- institutional activity becomes more likely
As RVF decreases:
- participation weakens
- continuation probability declines
- rotational or mean reversion behavior becomes more likely
Flat RVF usually signals balanced participation and lower directional conviction.
⚡ ES TRADE FILTERS - USING RVF
Trade only if:
RVF ≥ 1.10 (ES)
Reject trade if:
RVF < 1.10
Even if:
- VDI looks good
- MA looks good
Without RVF → move likely fails

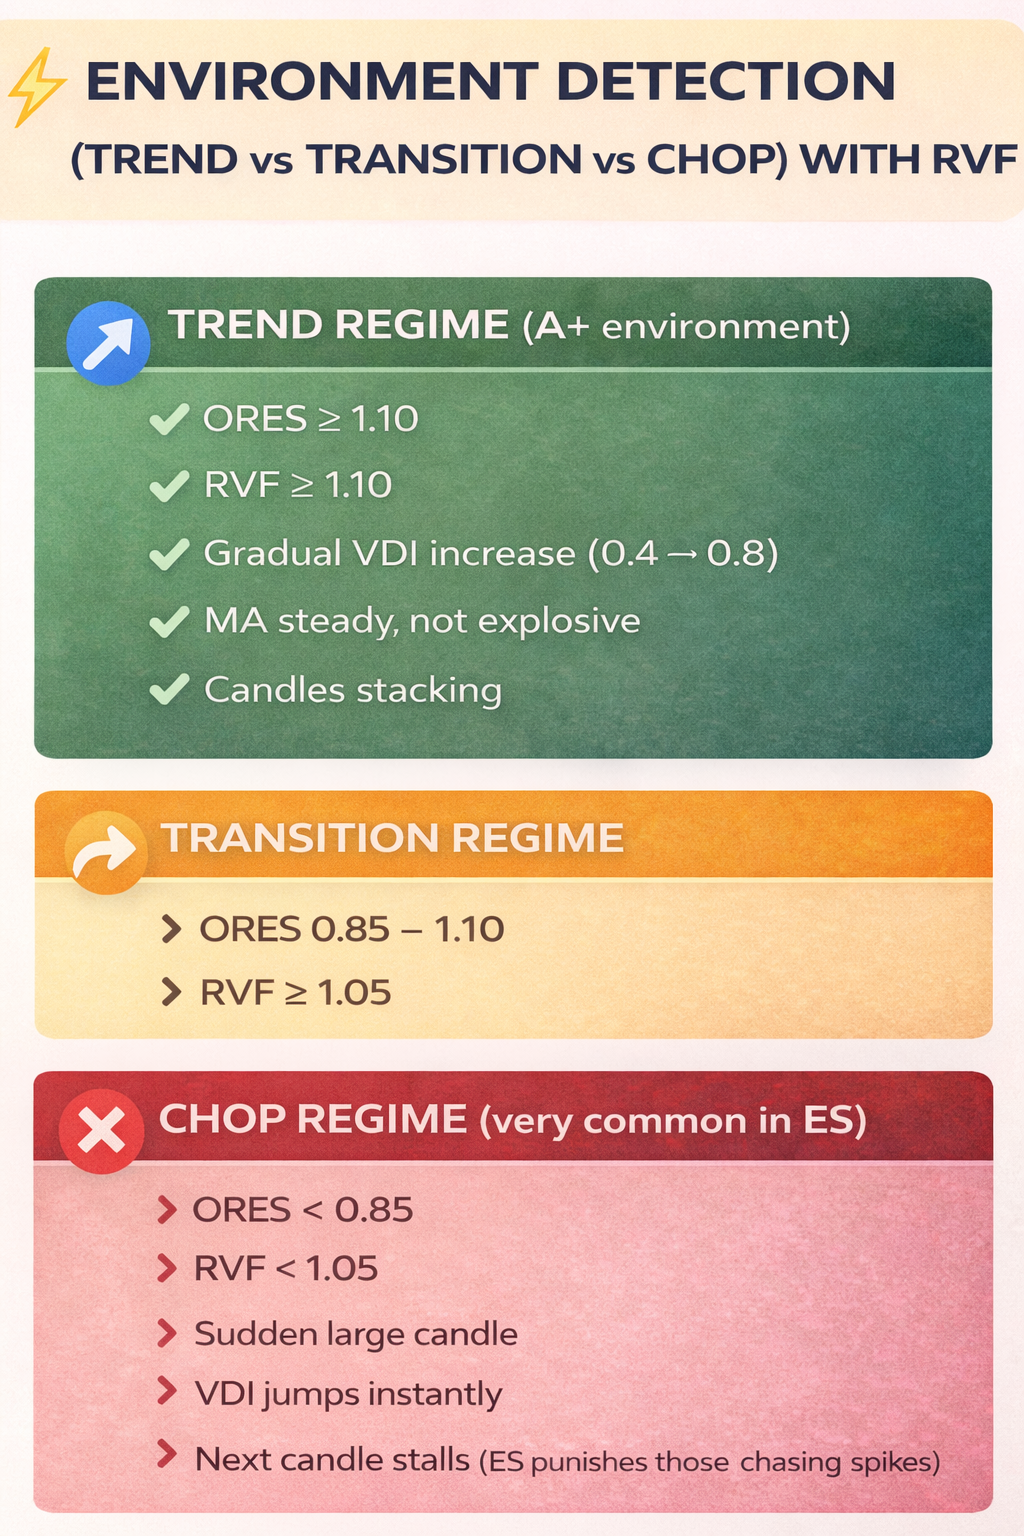
ENVIRONMENT DETECTION (TREND vs TRANSITION vs CHOP) WITH RVF
🔵 TREND REGIME (A+ environment)
ORES ≥ 1.10
RVF ≥ 1.10
Gradual VDI increase (0.4 → 0.8)
MA steady, not explosive
Candles stacking
🟡 TRANSITION REGIME
ORES 0.85 – 1.10
AND
RVF ≥ 1.05
❌ CHOP REGIME (very common in ES)
ORES < 0.85
RVF < 1.05
Sudden large candle
VDI jumps instantly
Next candle stalls
(ES punishes those chasing spikes)
🛡️ CRITICAL CHOP FILTER WITH ES
Reject trade if:
VDI oscillates between -0.5 and +0.5 for 5+ candles
OR
Price crosses VWAP > 3 times in 20 minutes
This is classic ES chop.

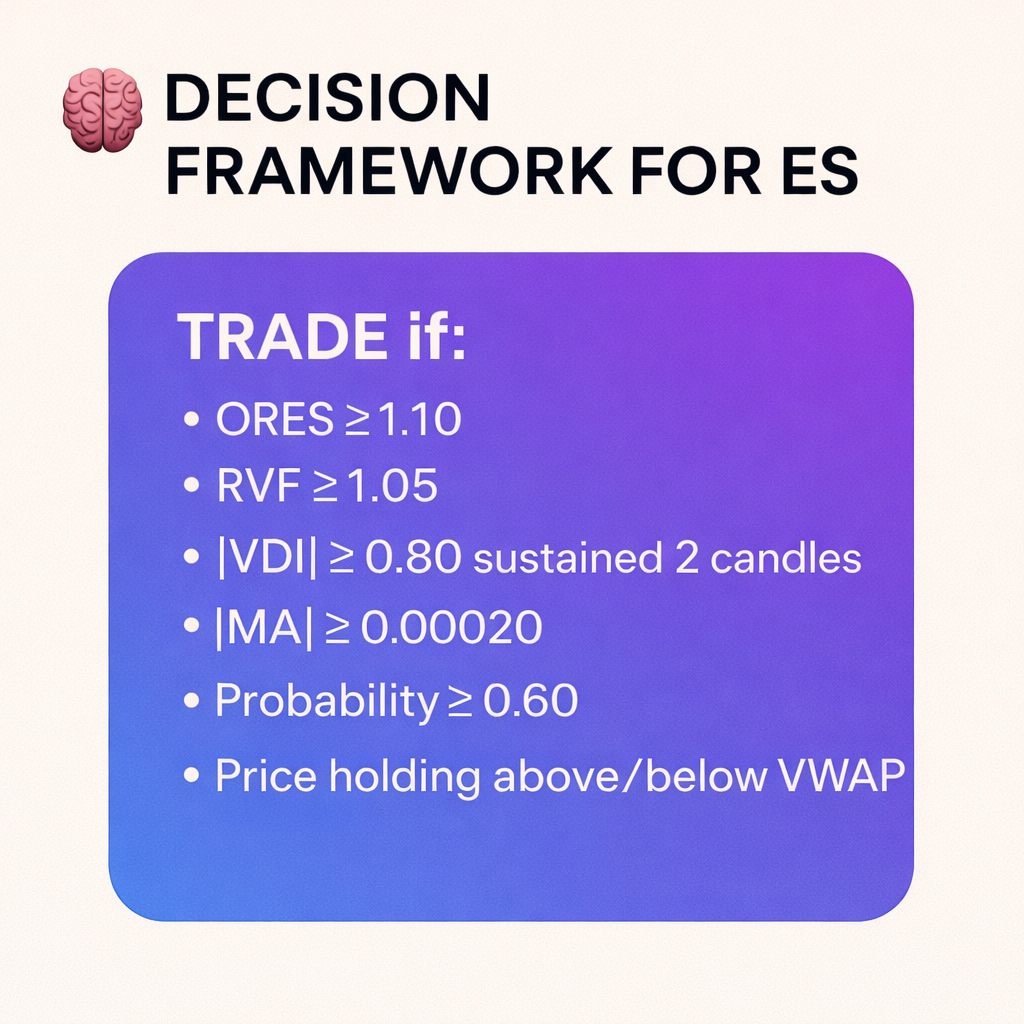
🧠 DECISION FRAMEWORK FOR ES
TRADE if:
ORES ≥ 1.10
AND
RVF ≥ 1.05
AND
|VDI| ≥ 0.80 sustained 2 candles
AND
|MA| ≥ 0.00020
AND
Probability ≥ 0.60
AND
Price holding above/below VWAP
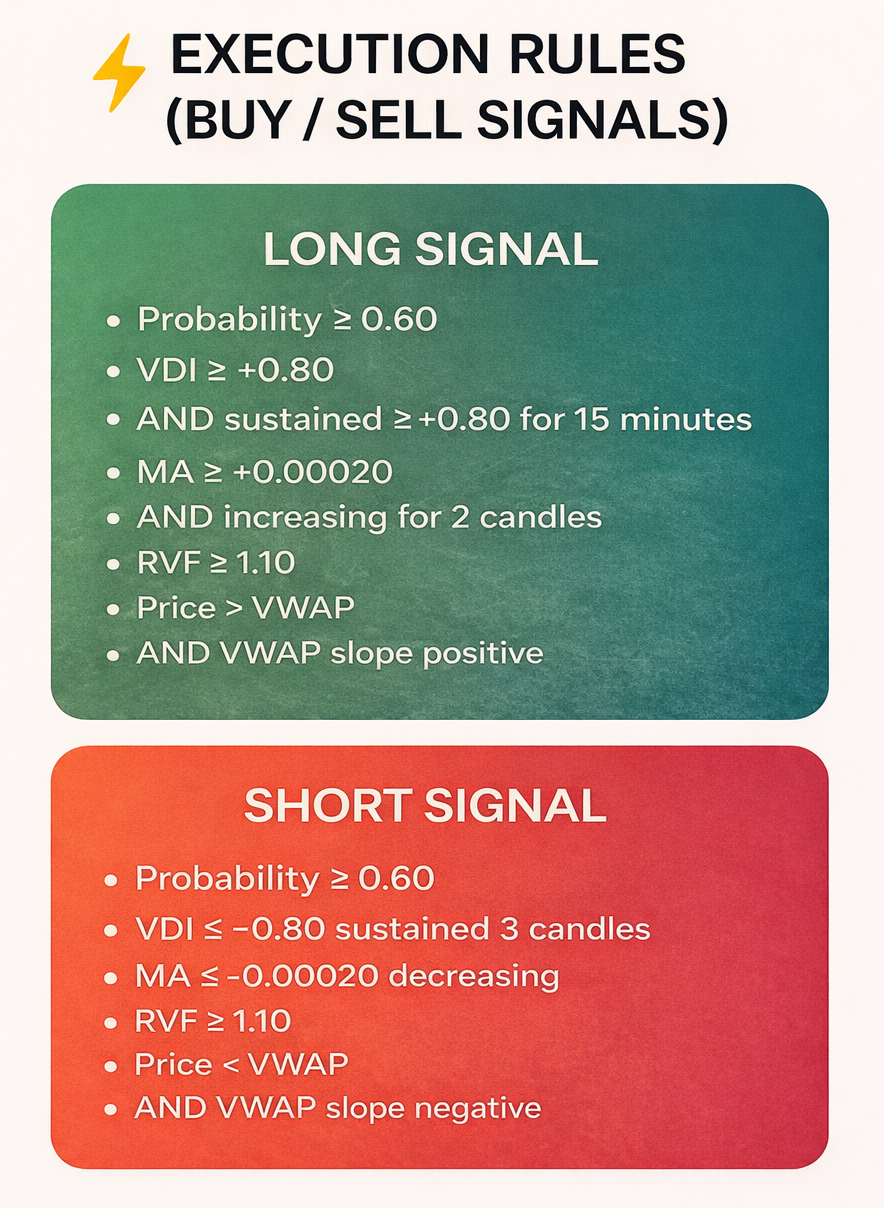
⚡ EXECUTION RULES (BUY / SELL SIGNALS)
LONG SIGNAL
Probability ≥ 0.60
VDI ≥ +0.80
AND sustained ≥ +0.80 for 15 minutes
MA ≥ +0.00020
AND increasing for 2 candles
RVF ≥ 1.10
Price > VWAP
AND VWAP slope positive
SHORT SIGNAL
Probability ≥ 0.60
VDI ≤ -0.80 sustained 3 candles
MA ≤ -0.00020 decreasing
RVF ≥ 1.10
Price < VWAP
AND VWAP slope negative
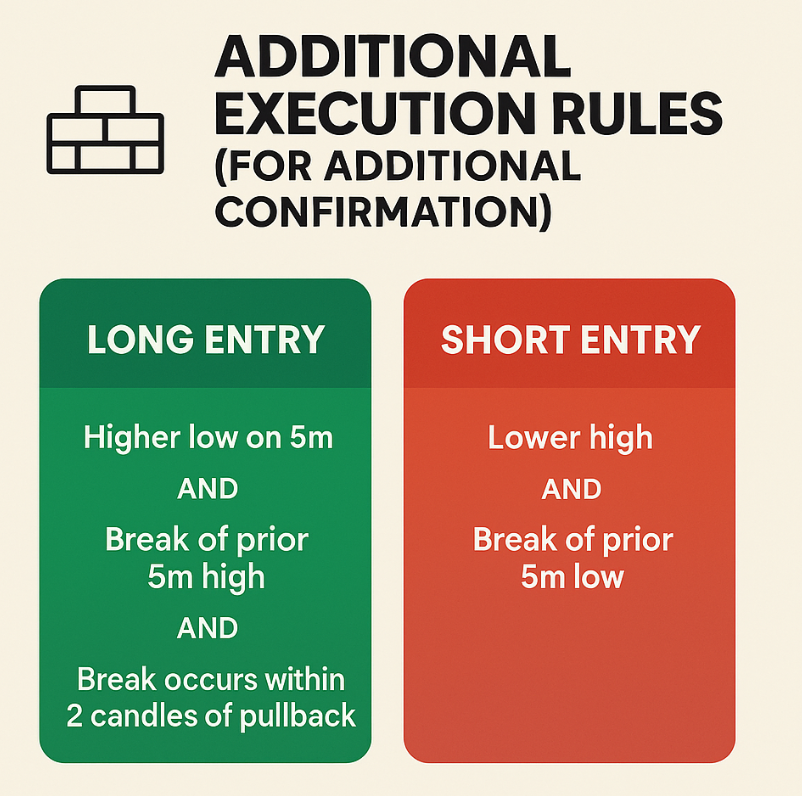
🧱 ADDITIONAL EXECUTION RULES ( FOR ADDITIONAL CONFIRMATION)
LONG ENTRY
Higher low on 5m
AND
Break of prior 5m high
AND
Break occurs within 2 candles of pullback
SHORT ENTRY
Lower high
AND
Break of prior 5m low
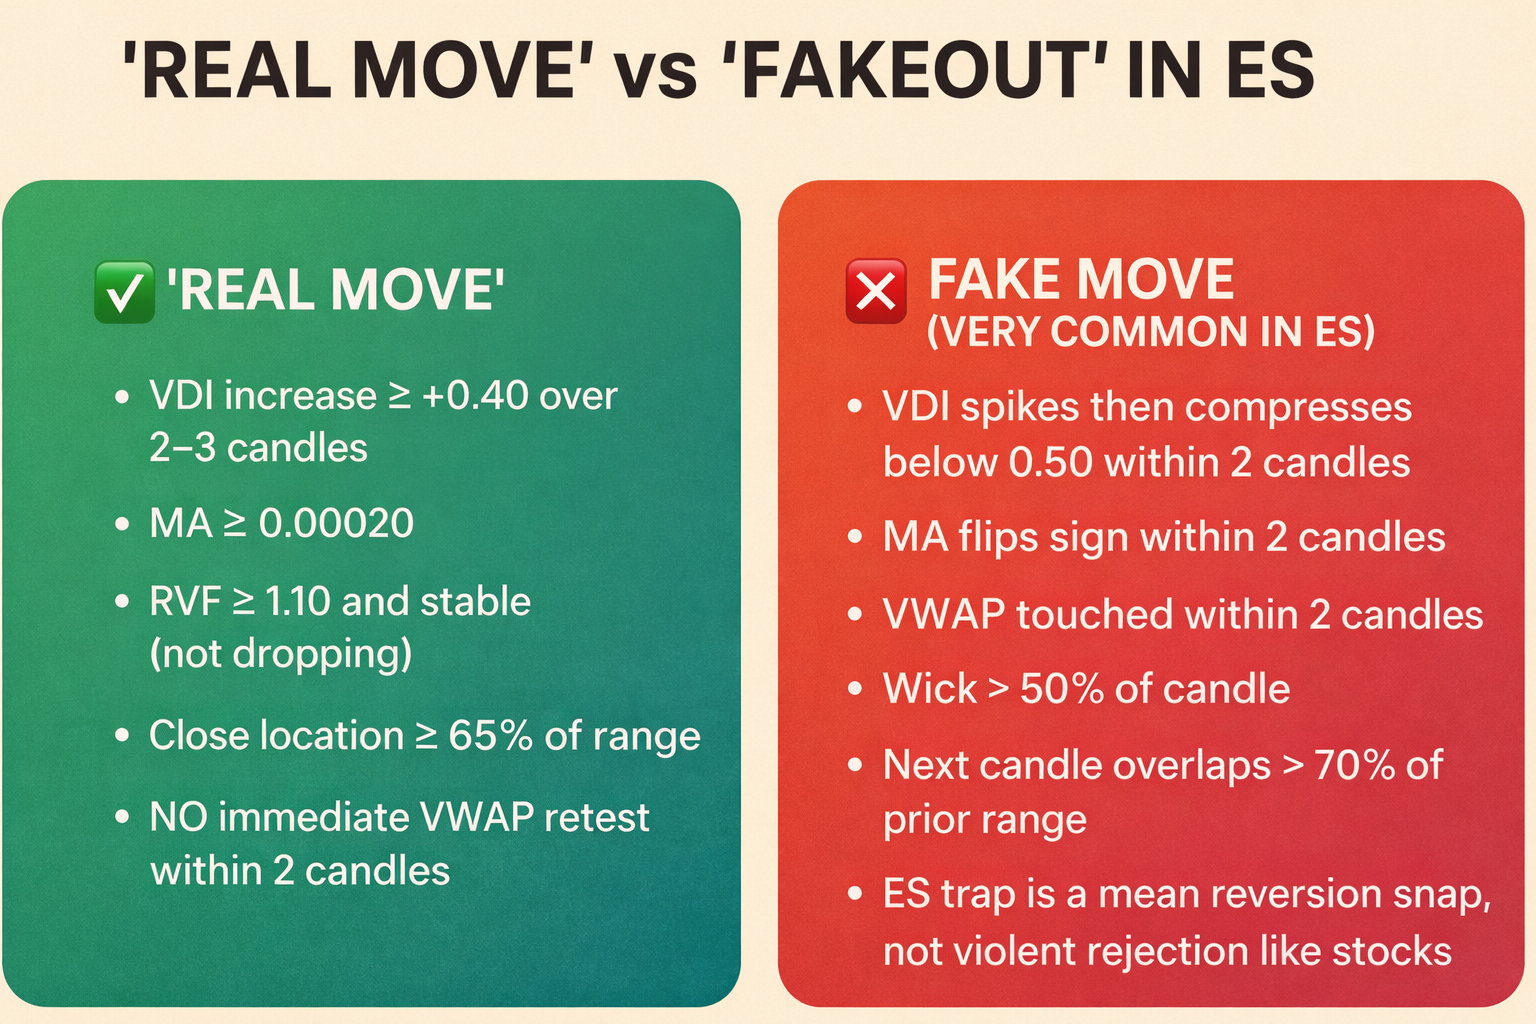
🔥 ‘REAL MOVE’ vs ‘FAKEOUT’ IN ES
✅ ‘REAL MOVE’
VDI increase ≥ +0.40 over 2–3 candles
MA ≥ +0.00020
RVF ≥ 1.10 and stable (not dropping)
Close location ≥ 65% of range
NO immediate VWAP retest within 2 candles
❌ FAKE MOVE (VERY COMMON IN ES)
VDI spikes then compresses below 0.50 within 2 candles
MA flips sign within 2 candles
VWAP touched within 2 candles
Wick > 50% of candle
Next candle overlaps > 70% of prior range
ES trap is a mean reversion snap, not violent rejection like stocks
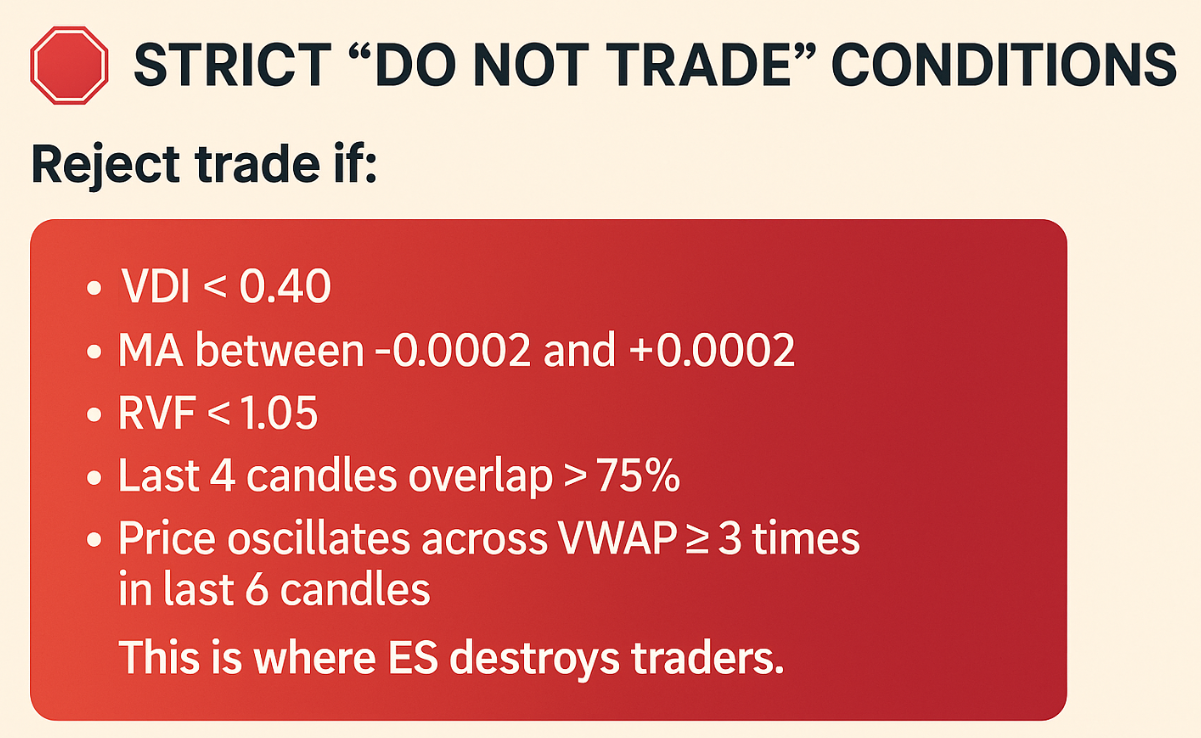
🛡️ STRICT “DO NOT TRADE” CONDITIONS
Reject trade if:
|VDI| < 0.40
MA between -0.0002 and +0.0002
RVF < 1.05
Last 4 candles overlap > 75%
Price oscillates across VWAP ≥ 3 times in last 6 candles
This is where ES destroys traders.
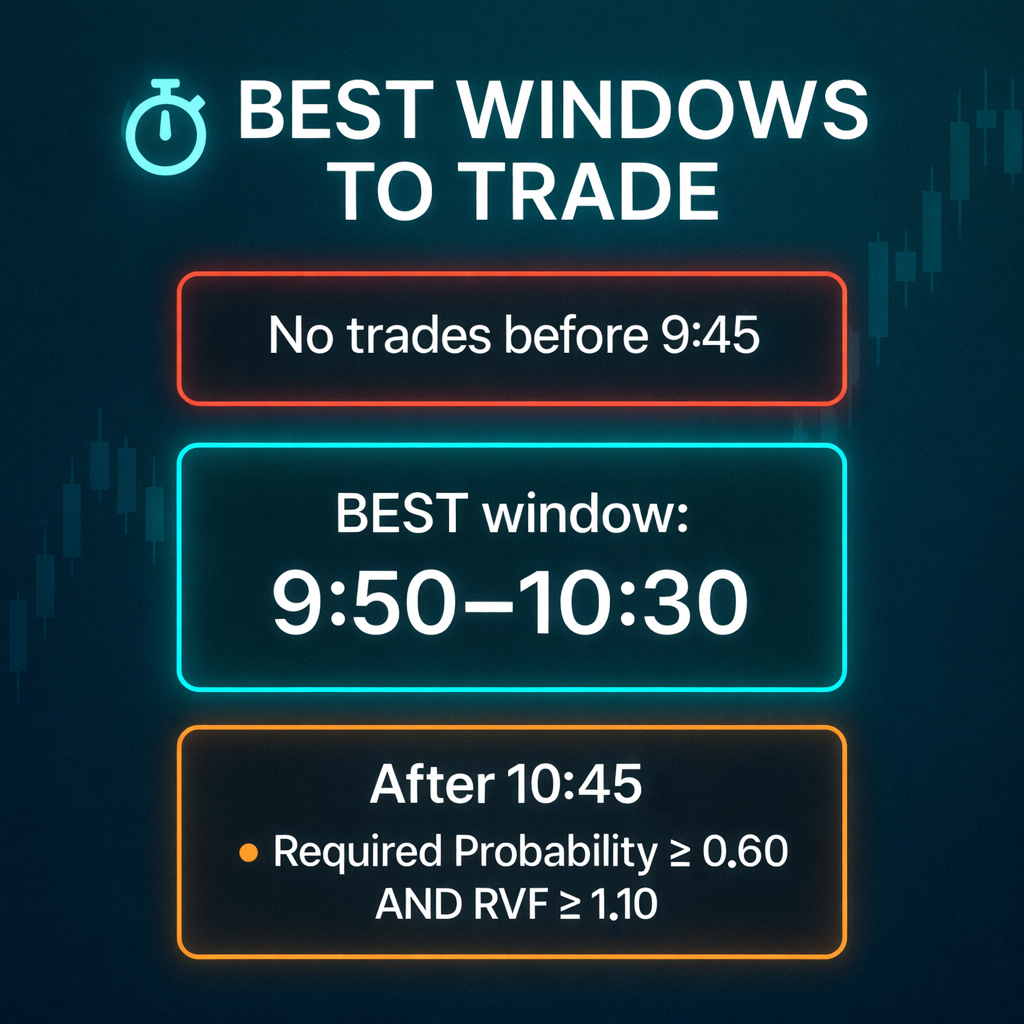
⏱️ BEST WINDOWS TO TRADE
No trades before 9:45
BEST window: 9:50–10:30
After 10:45:
Required Probability ≥ 0.60 AND RVF ≥ 1.10
💰 PROFIT TARGET & STOP LOSS
ES = 20 points profit with 10 points stop loss or 10 points profit with 5 points stop loss (higher profitability in trending conditions)

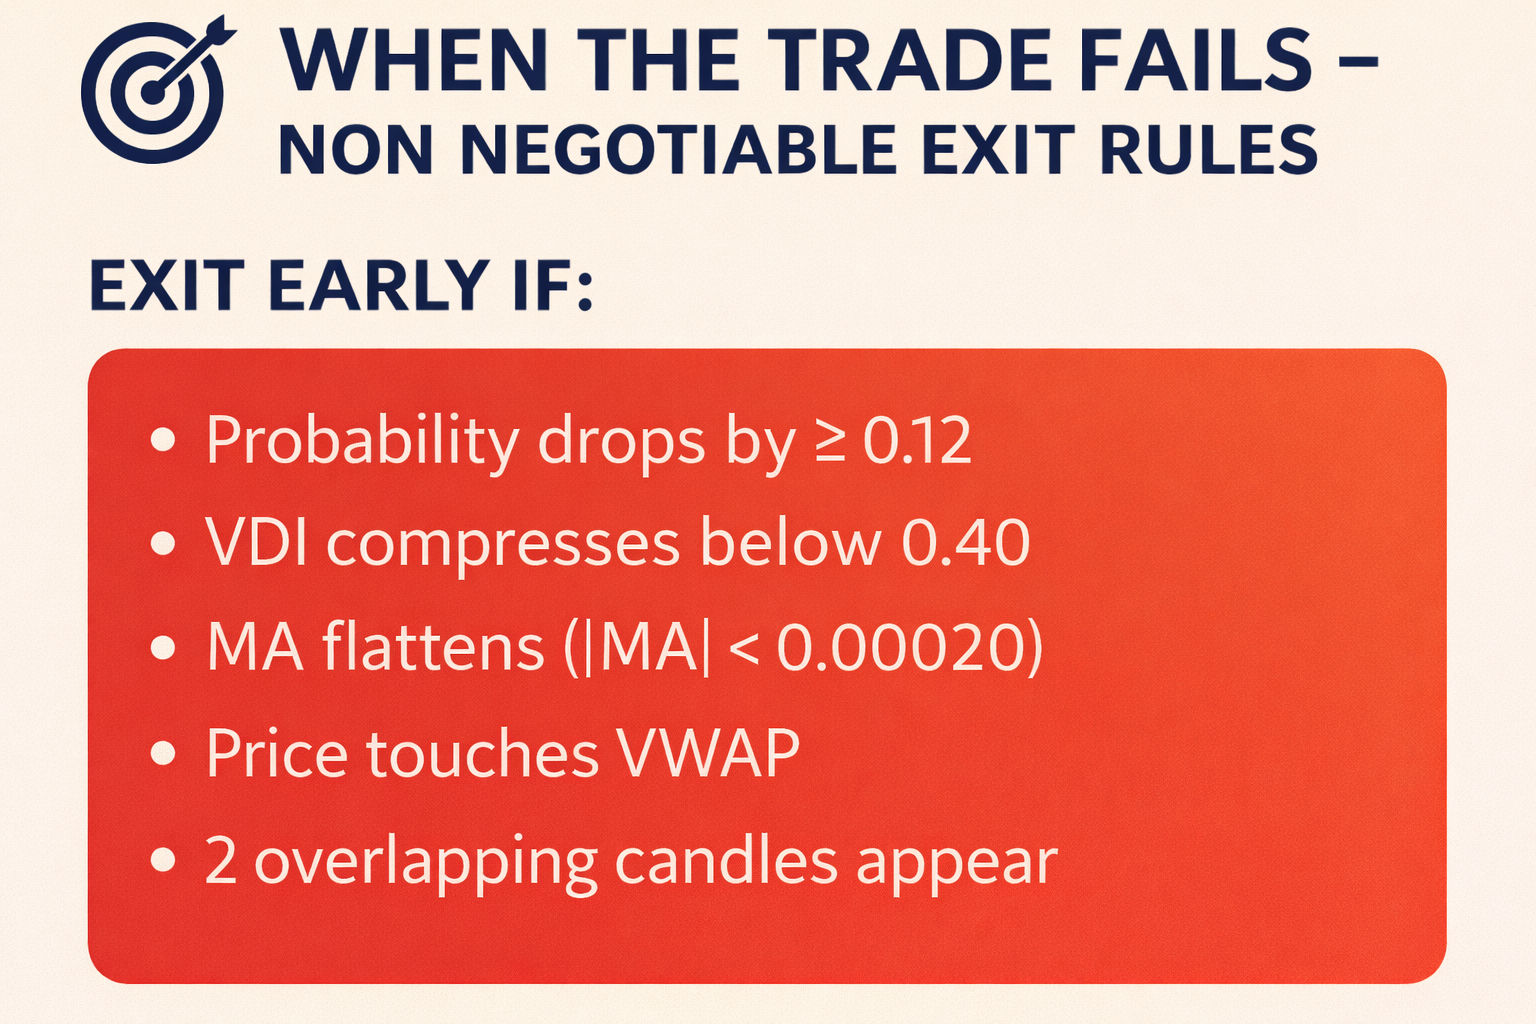
🎯 WHEN THE TRADE FAILS - NON NEGOTIABLE EXIT RULES
EXIT EARLY IF:
Probability drops by ≥ 0.12
VDI compresses below 0.40
MA flattens (|MA| < 0.00020)
Price touches VWAP
2 overlapping candles appear
🔁 TRADE FREQUENCY
Max 3 trades/day
Stop after 2 losses
Stop after 2 wins (optional lock-in)
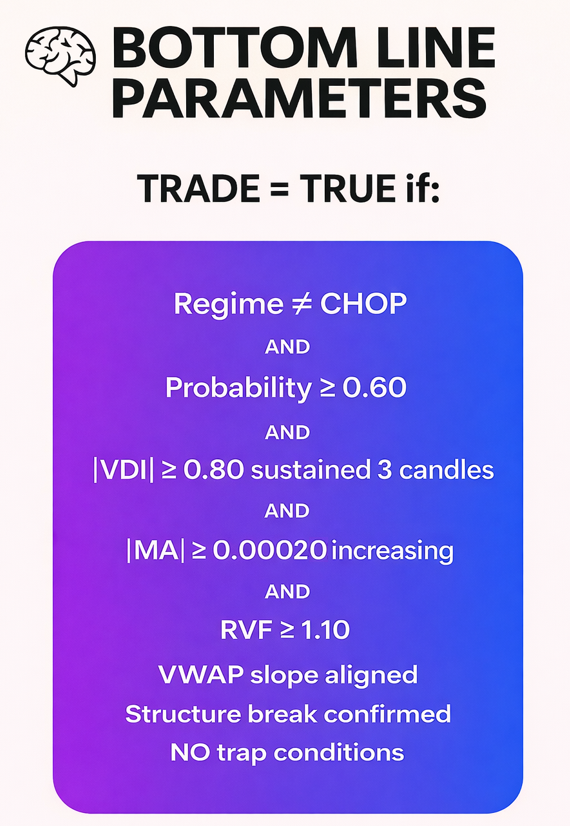
🧠 BOTTOM LINE PARAMETERS
TRADE = TRUE if:
Regime ≠ CHOP
AND
Probability ≥ 0.60
AND
|VDI| ≥ 0.80 sustained 3 candles
AND
|MA| ≥ 0.00020 increasing
AND
RVF ≥ 1.10
AND
VWAP slope aligned
AND
Structure break confirmed
AND
NO trap conditions