VWAP Displacement Index (VDI)
Contact customer support at support@spxdirection.com
VWAP Displacement Index (VDI)
Measures how far price is from VWAP, normalized by short-term volatility
🧠 FORMULA
VDI = (Price − VWAP) ÷ ATR(5m)
- Uses 5-minute ATR
- Gives you standardized distance from value (VWAP)
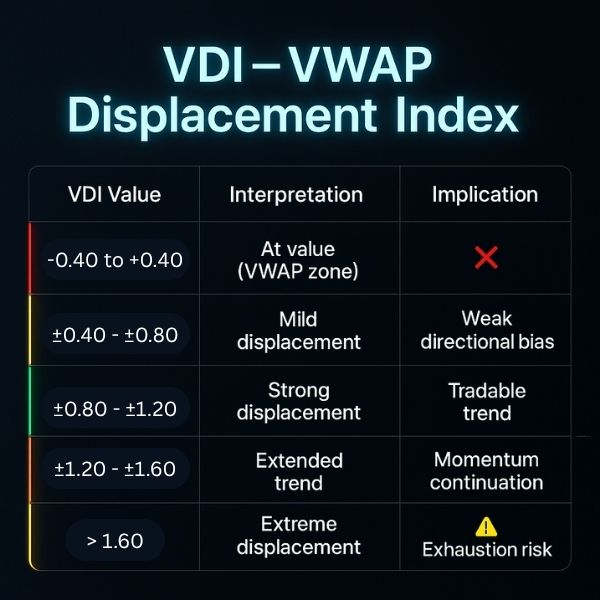
📊 HOW TO INTERPRET VDI FOR ES
|
VDI |
Interpretation |
Implication |
|
-0.40 to +0.40 |
At value (VWAP zone) |
❌ Chop / rotation |
|
±0.40 – ±0.80 |
Mild displacement |
⚠️ Weak directional bias |
|
±0.80 – ±1.20 |
Strong displacement |
✅ Tradable trend |
|
±1.20 – ±1.60 |
Extended trend |
🔥 Momentum continuation |
|
> ±1.60 |
Extreme displacement |
⚠️ Exhaustion risk |
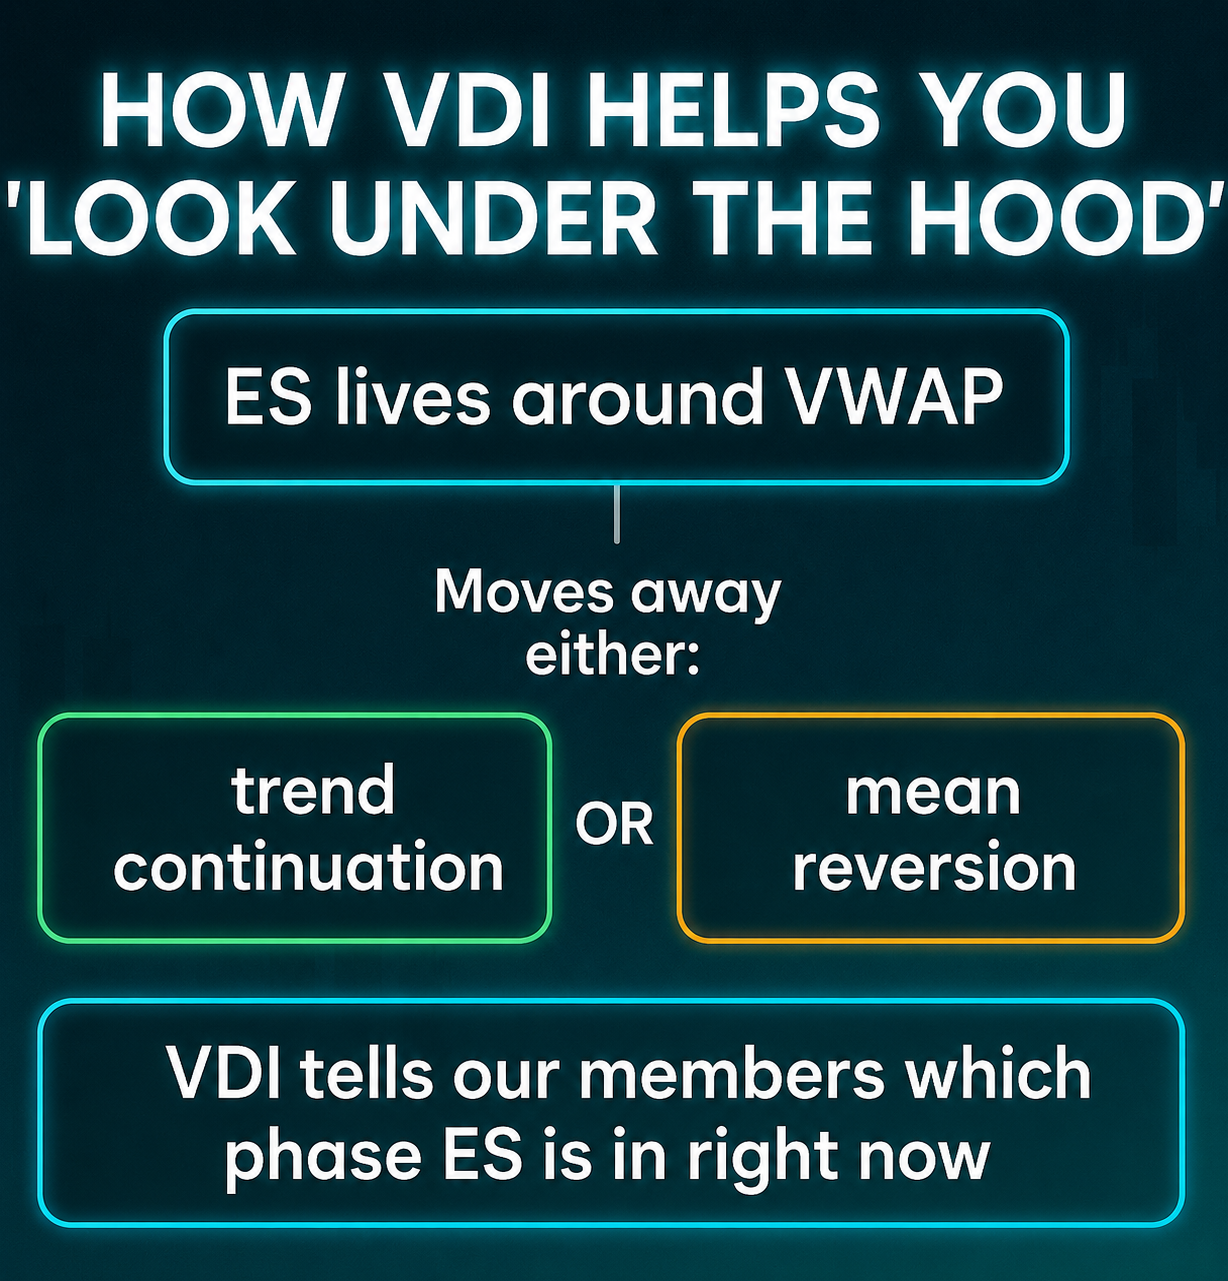
🧠 HOW VDI HELPS YOU ‘LOOK UNDER THE HOOD’
- ES lives around VWAP
- Moves away → either:
- trend continuation
- OR mean reversion
VDI tells our members which phase ES is in right now
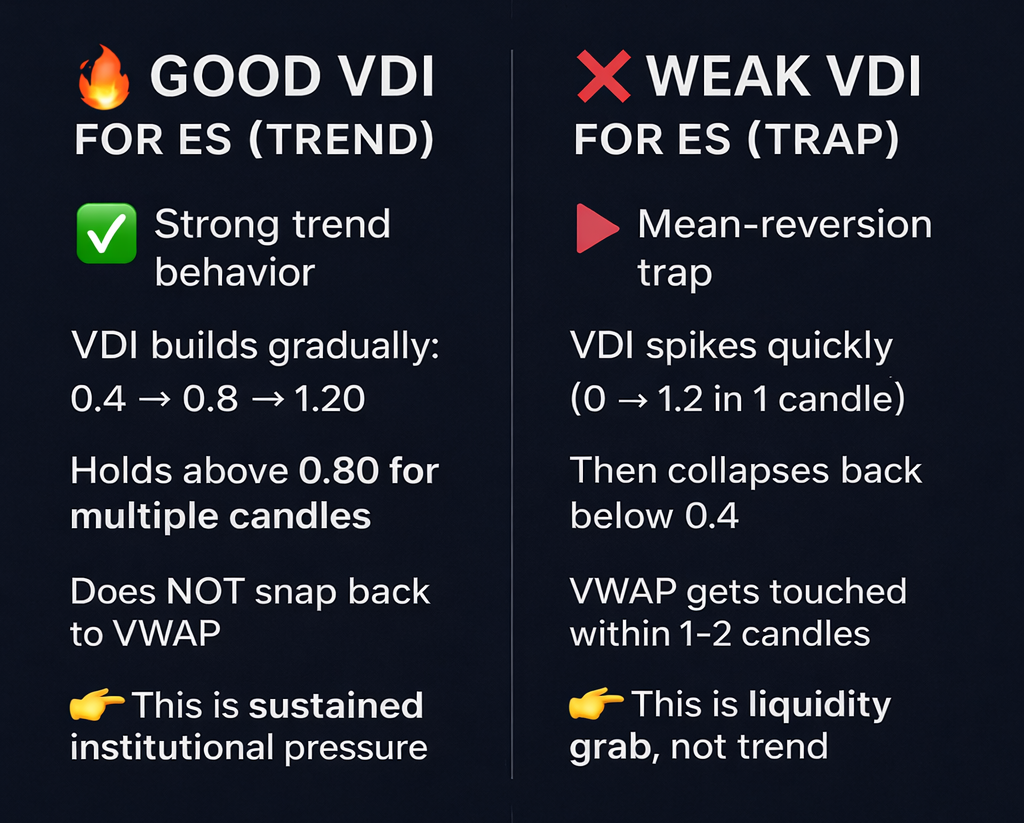
🔥 GOOD VDI FOR ES (TREND)
✅ Strong trend behavior
- VDI builds gradually:
0.4 → 0.8 → 1.20 - Holds above 0.80 for multiple candles
- Does NOT snap back to VWAP
👉 This is sustained institutional pressure
❌ WEAK VDI FOR ES (TRAP)
🚩 Mean-reversion trap
- VDI spikes quickly (0 → 1.2 in 1 candle)
- Then collapses back below 0.4
- VWAP gets touched within 1–2 candles
👉 This is liquidity grab, not trend
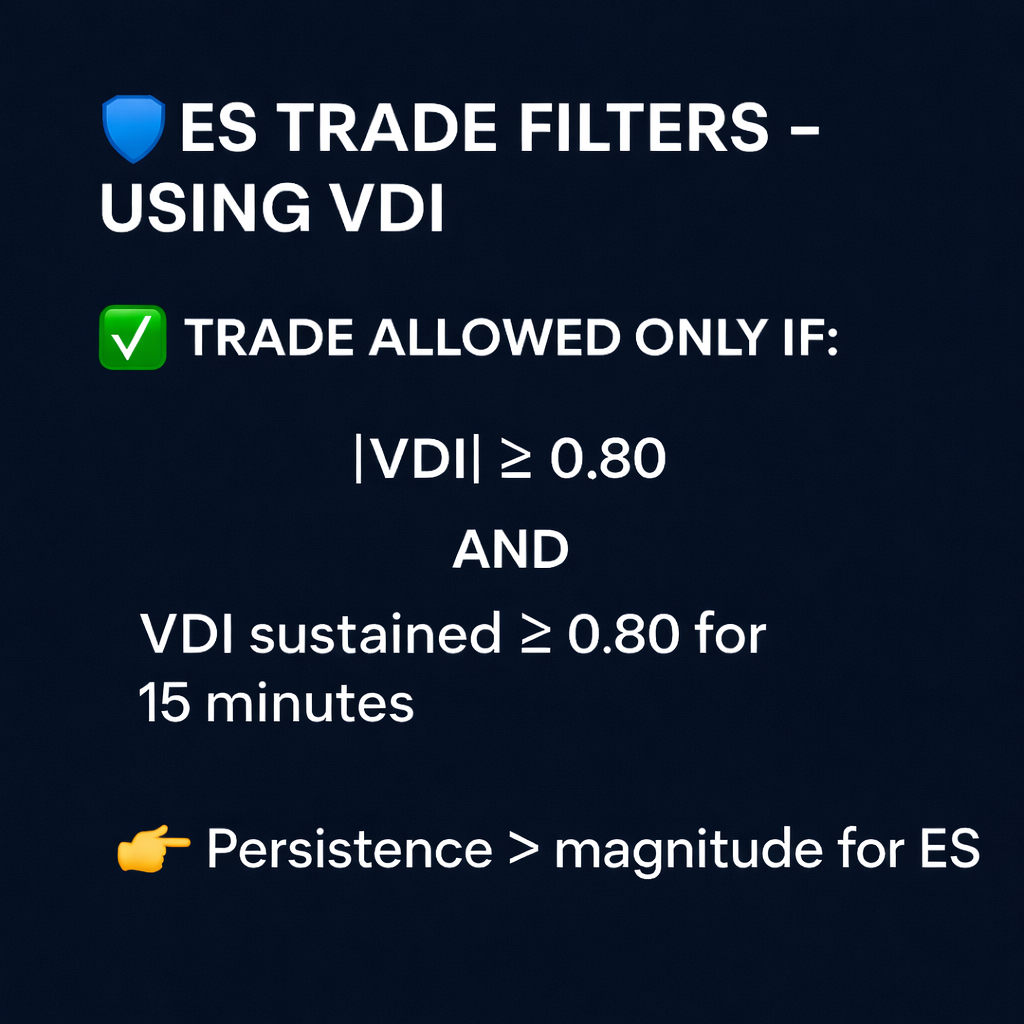
🛡️ ES TRADE FILTERS - USING VDI
✅ TRADE ALLOWED ONLY IF:
|VDI| ≥ 0.80
AND
VDI sustained ≥ 0.80 for 15 minutes
👉 Persistence > magnitude for ES
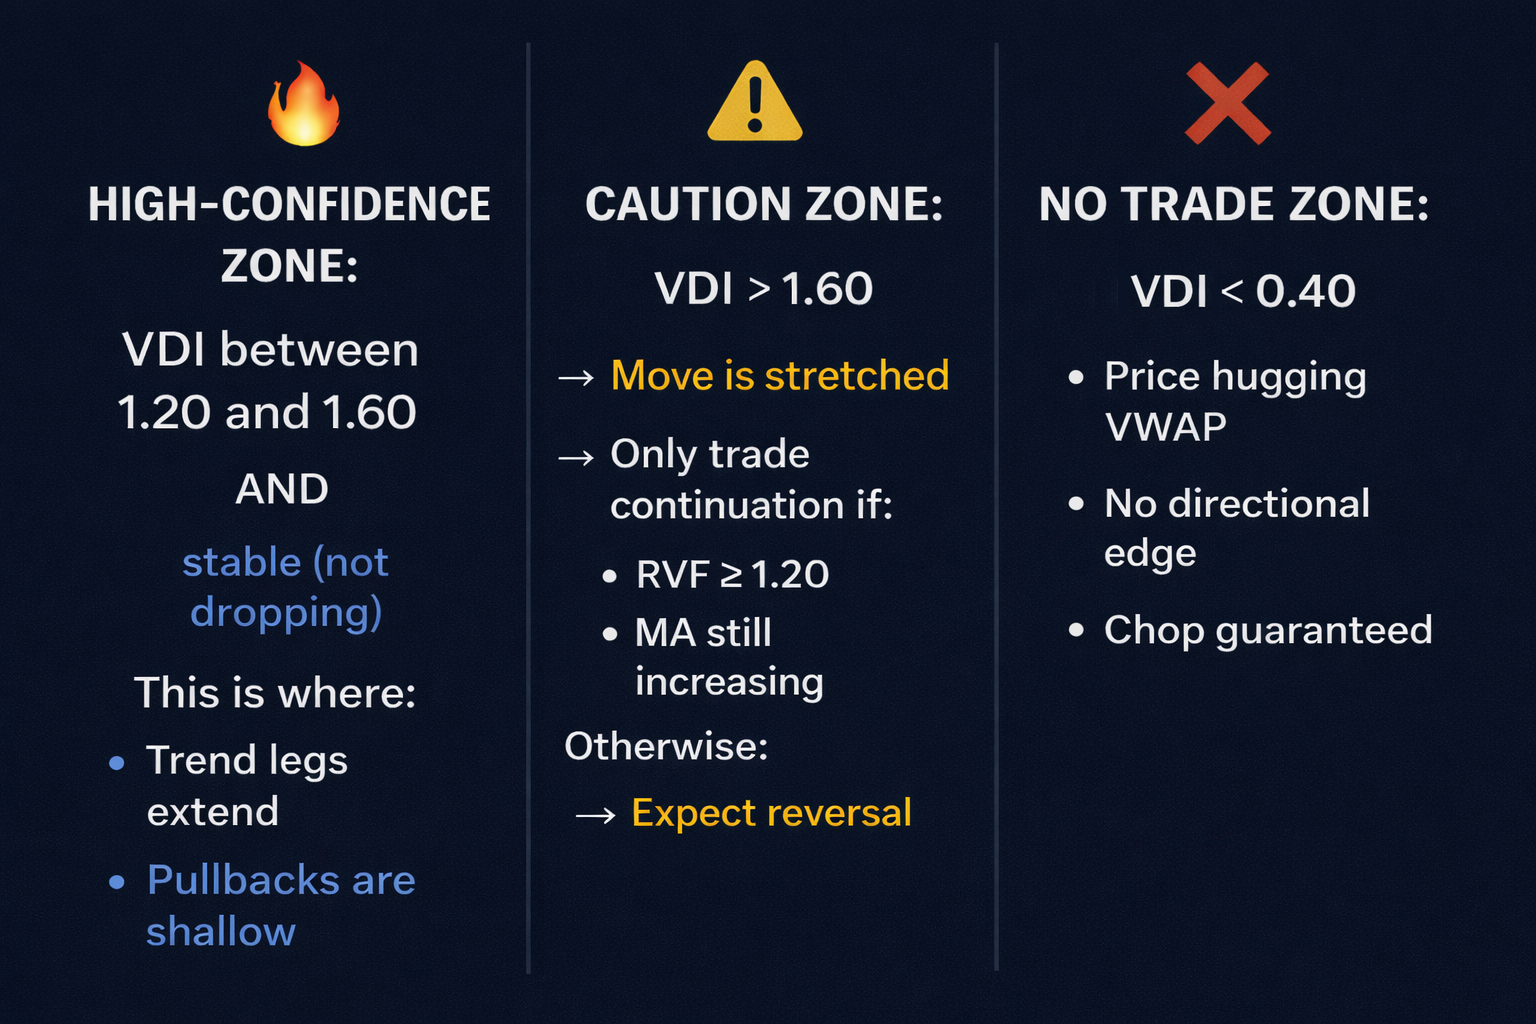
🔥 HIGH-CONFIDENCE ZONE:
VDI between 1.20 and 1.60
AND
stable (not dropping)
This is where:
- Trend legs extend
- Pullbacks are shallow
⚠️ CAUTION ZONE:
VDI > 1.60
→ Move is stretched
→ Only trade continuation if:
- RVF ≥ 1.20
- MA still increasing
Otherwise:
→ Expect reversal
❌ NO TRADE ZONE:
|VDI| < 0.40
- Price hugging VWAP
- No directional edge
- Chop guaranteed
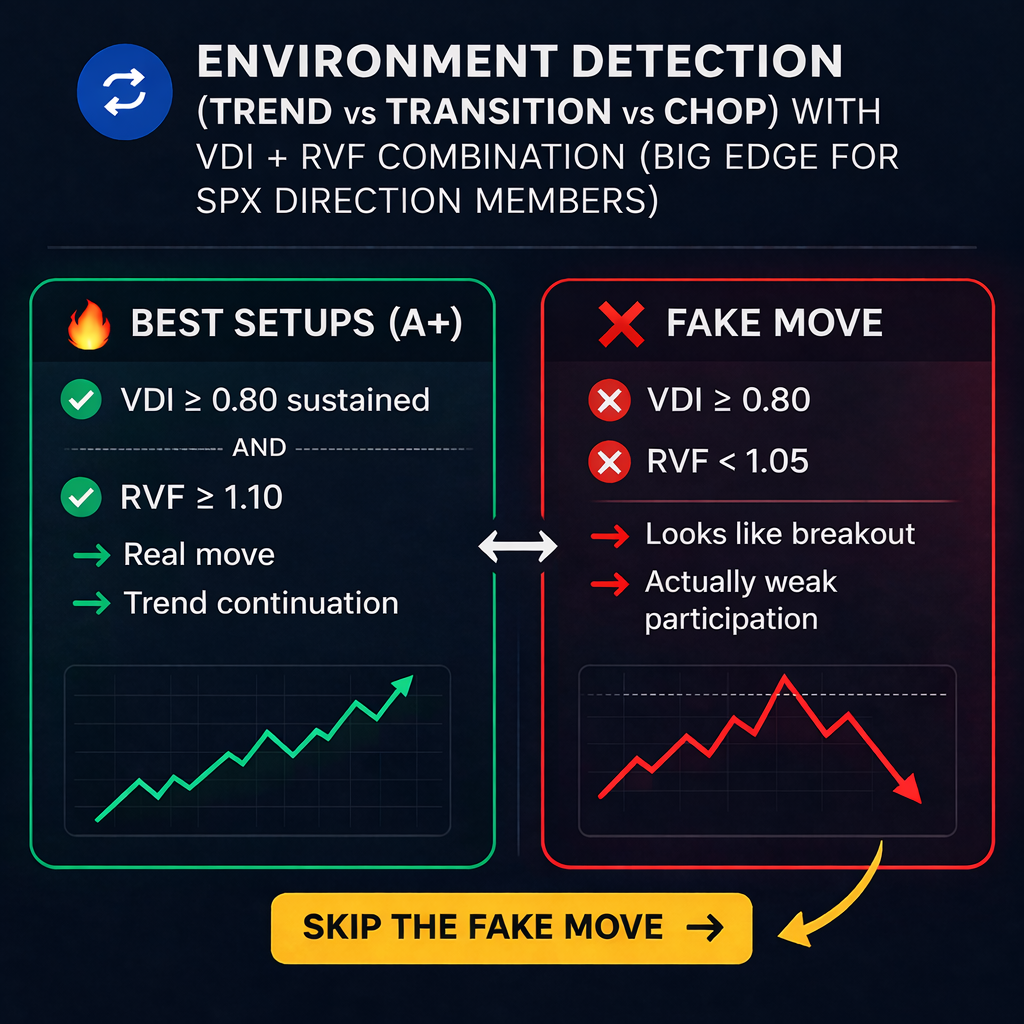
🔁 ENVIRONMENT DETECTION (TREND vs TRANSITION vs CHOP) WITH VDI + RVF COMBINATION (BIG EDGE FOR SPX DIRECTION MEMBERS)
🔥 BEST SETUPS (A+)
VDI ≥ 0.80 sustained
AND
RVF ≥ 1.10
→ Real move
→ Trend continuation
❌ FAKE MOVE
VDI ≥ 0.80
BUT
RVF < 1.05
→ Looks like breakout
→ Actually weak participation
👉 Skip
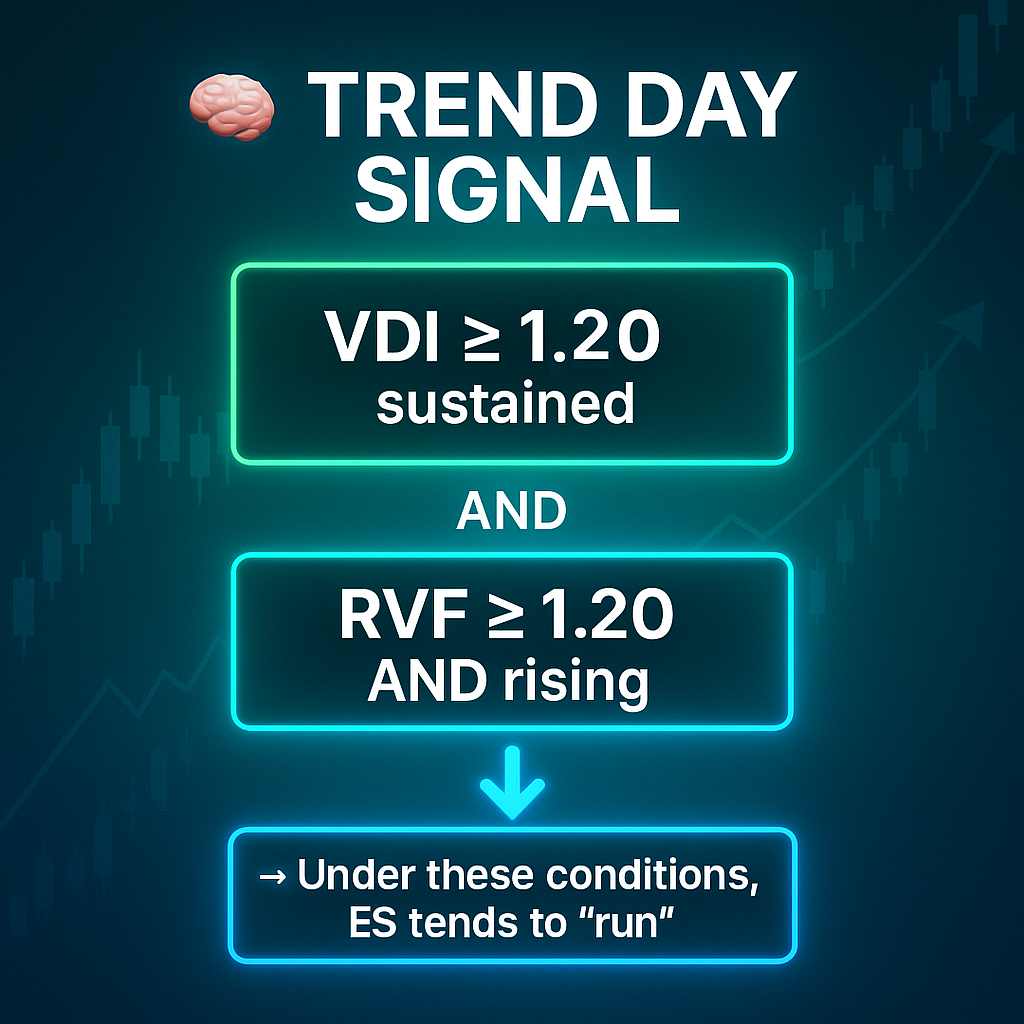
🧠 TREND DAY SIGNAL
VDI ≥ 1.20 sustained
AND
RVF ≥ 1.20 AND rising
→ Under these conditions, ES tends to ‘run’
⚡ EXECUTION RULES (BUY / SELL SIGNALS)
LONG
- VDI ≥ +0.80 sustained
- Price above VWAP
- Enter on pullback → continuation
SHORT
- VDI ≤ -0.80 sustained
- Price below VWAP

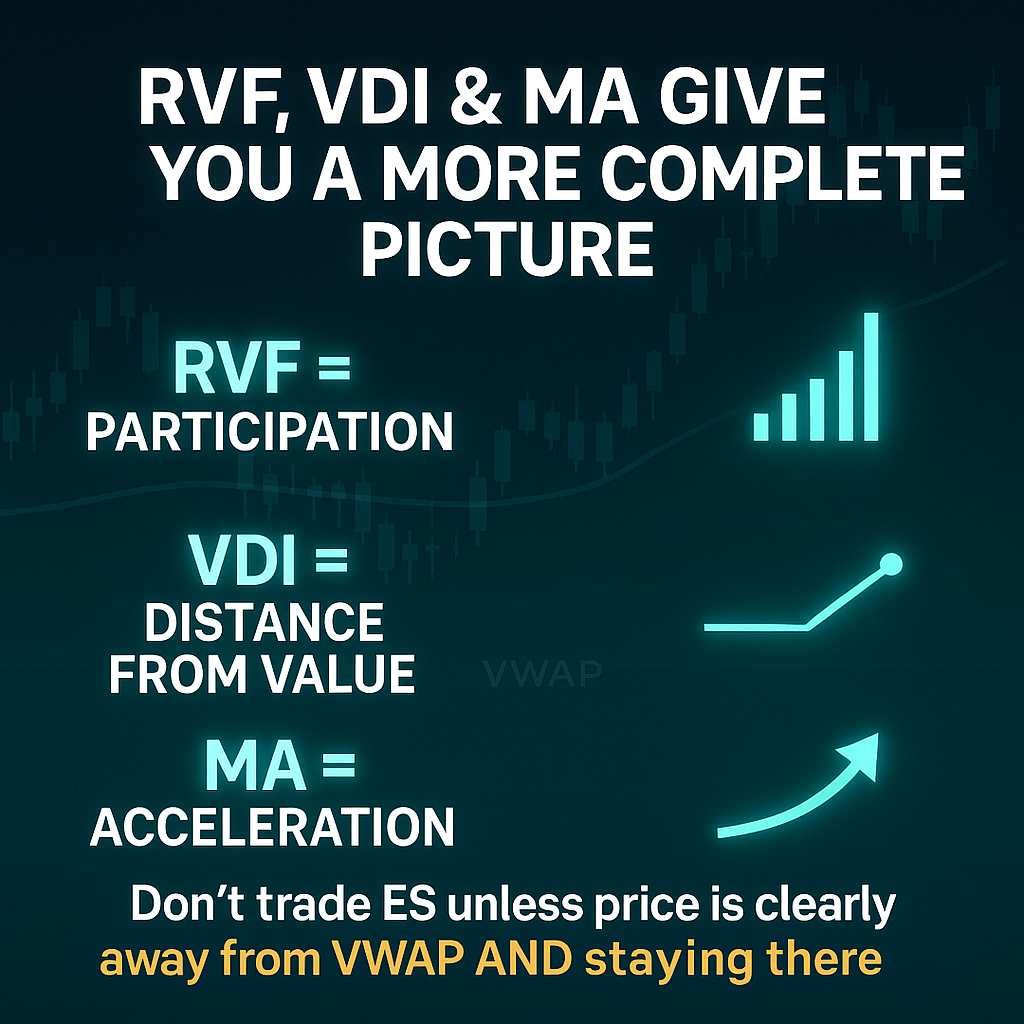
🧠 RVF, VDI & MA GIVE YOU A MORE COMPLETE PICTURE
- RVF = participation
- VDI = distance from value
- MA = acceleration
Don’t trade ES unless price is clearly away from VWAP AND staying there