How to use SPX Direction parameters with VWAP
Contact customer support at support@spxdirection.com
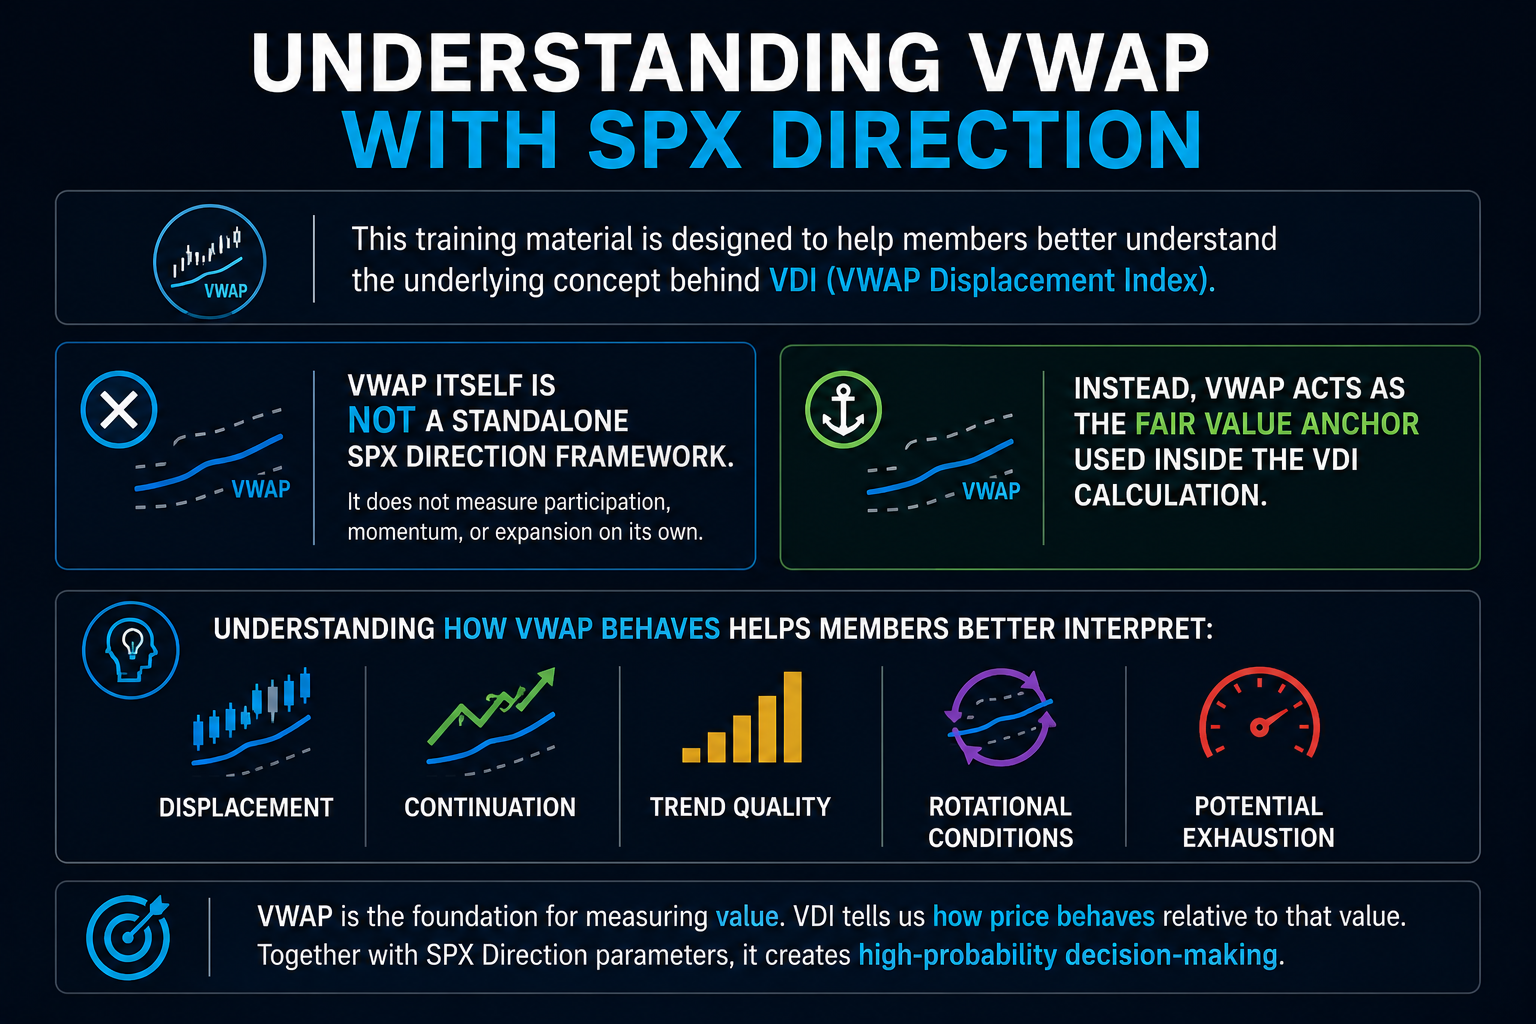
UNDERSTANDING VWAP WITH SPX DIRECTION
This training material is designed to help members better understand the underlying concept behind VDI (VWAP Displacement Index).
VWAP itself is NOT a standalone SPX Direction framework.
Instead, VWAP acts as the fair value anchor used inside the VDI calculation.
Understanding how VWAP behaves helps members better interpret:
- displacement
- continuation
- trend quality
- rotational conditions
- potential exhaustion
🧠 WHAT VWAP ACTUALLY REPRESENTS
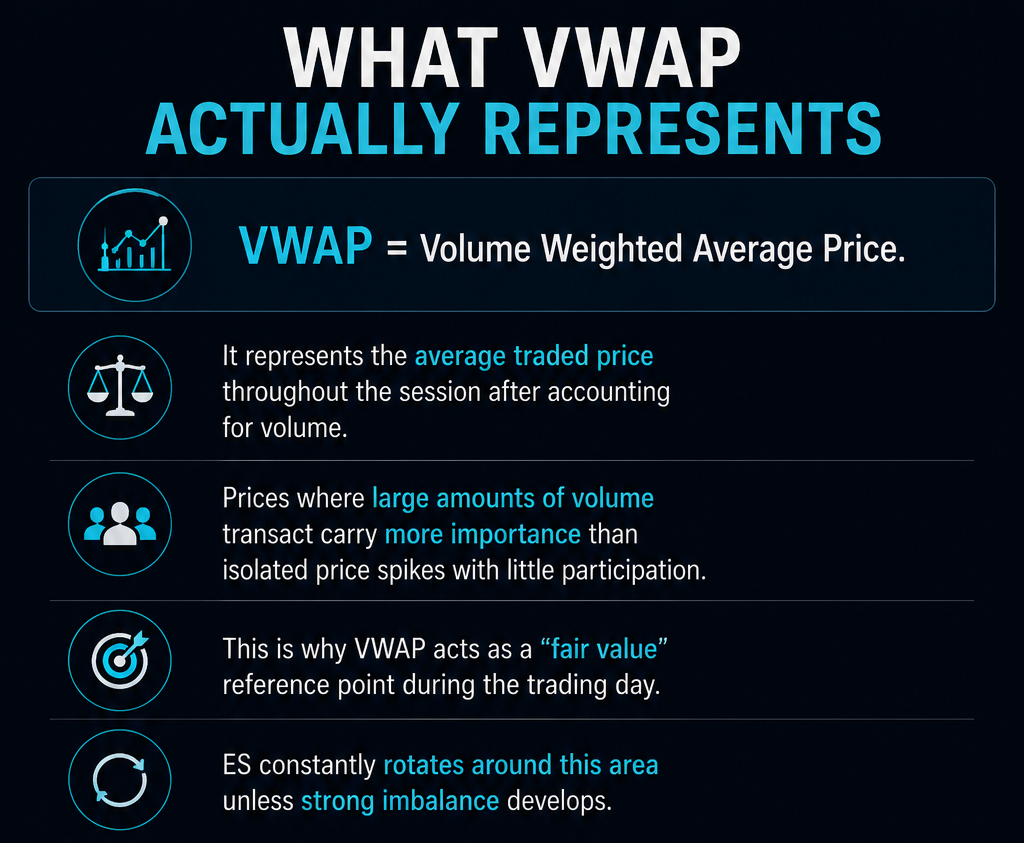
VWAP = Volume Weighted Average Price.
It represents the average traded price throughout the session after accounting for volume.
Prices where large amounts of volume transact carry more importance than isolated price spikes with little participation.
This is why VWAP acts as a “fair value” reference point during the trading day.
ES constantly rotates around this area unless strong imbalance develops.
🧠 WHY VWAP MATTERS FOR SPX DIRECTION
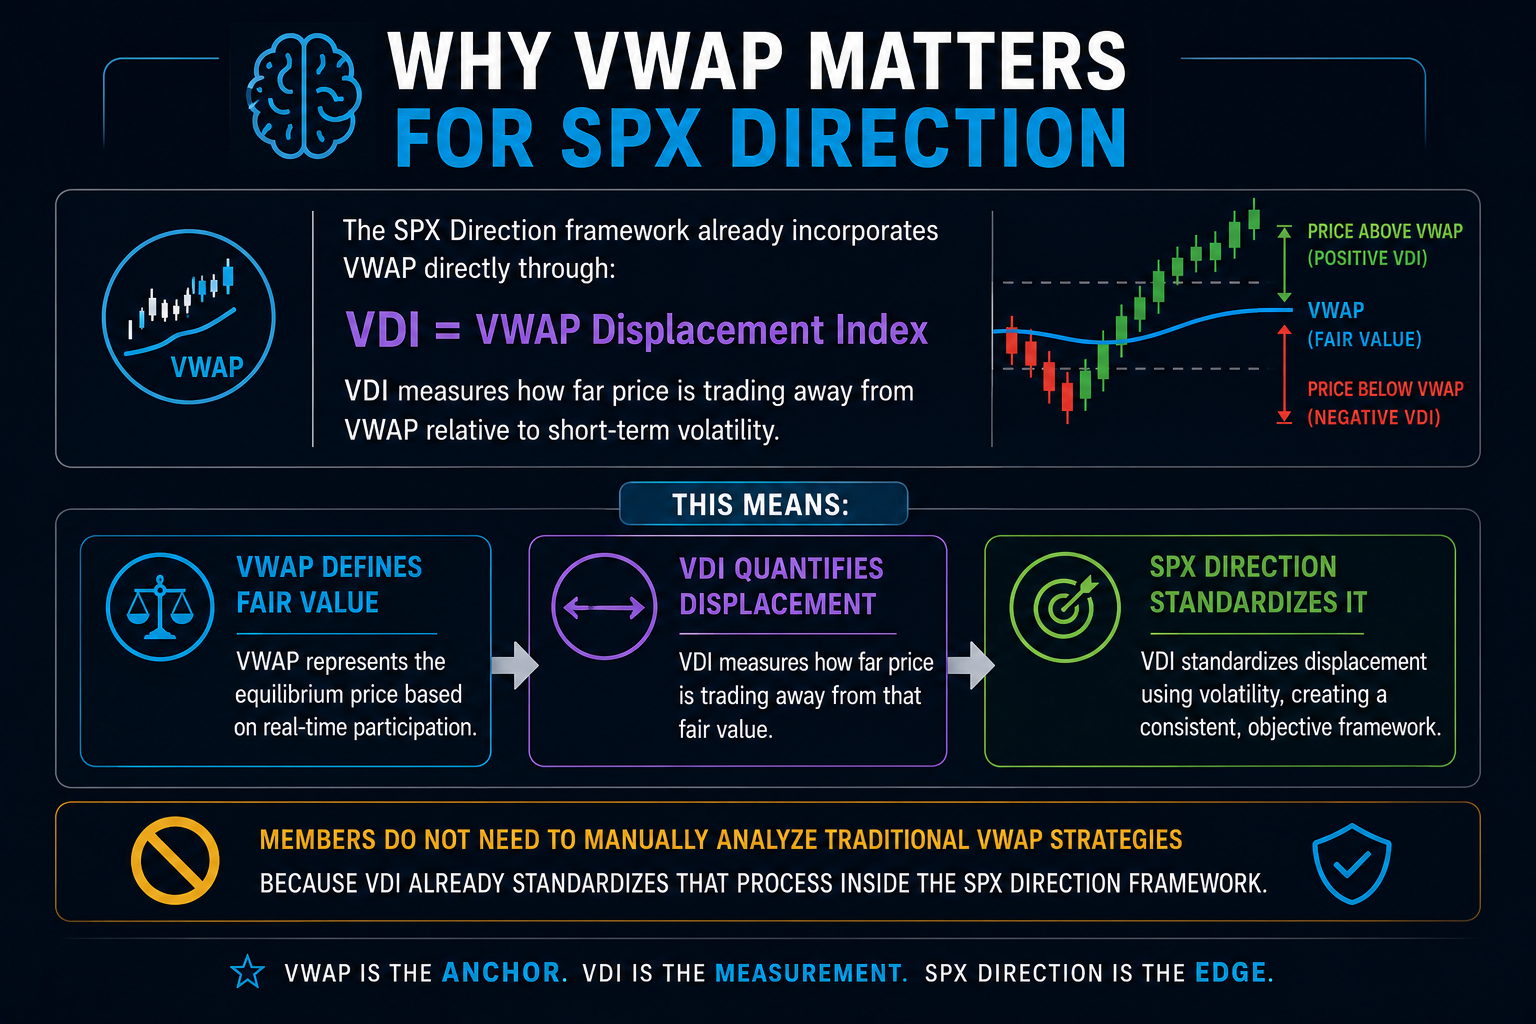
The SPX Direction framework already incorporates VWAP directly through:
VDI = VWAP Displacement Index
VDI measures how far price is trading away from VWAP relative to short-term volatility.
This means:
- VWAP defines fair value
- VDI quantifies displacement away from fair value
Members do NOT need to manually analyze traditional VWAP strategies because VDI already standardizes that process inside the SPX Direction framework.
🧠 UNDERSTANDING VWAP DISPLACEMENT
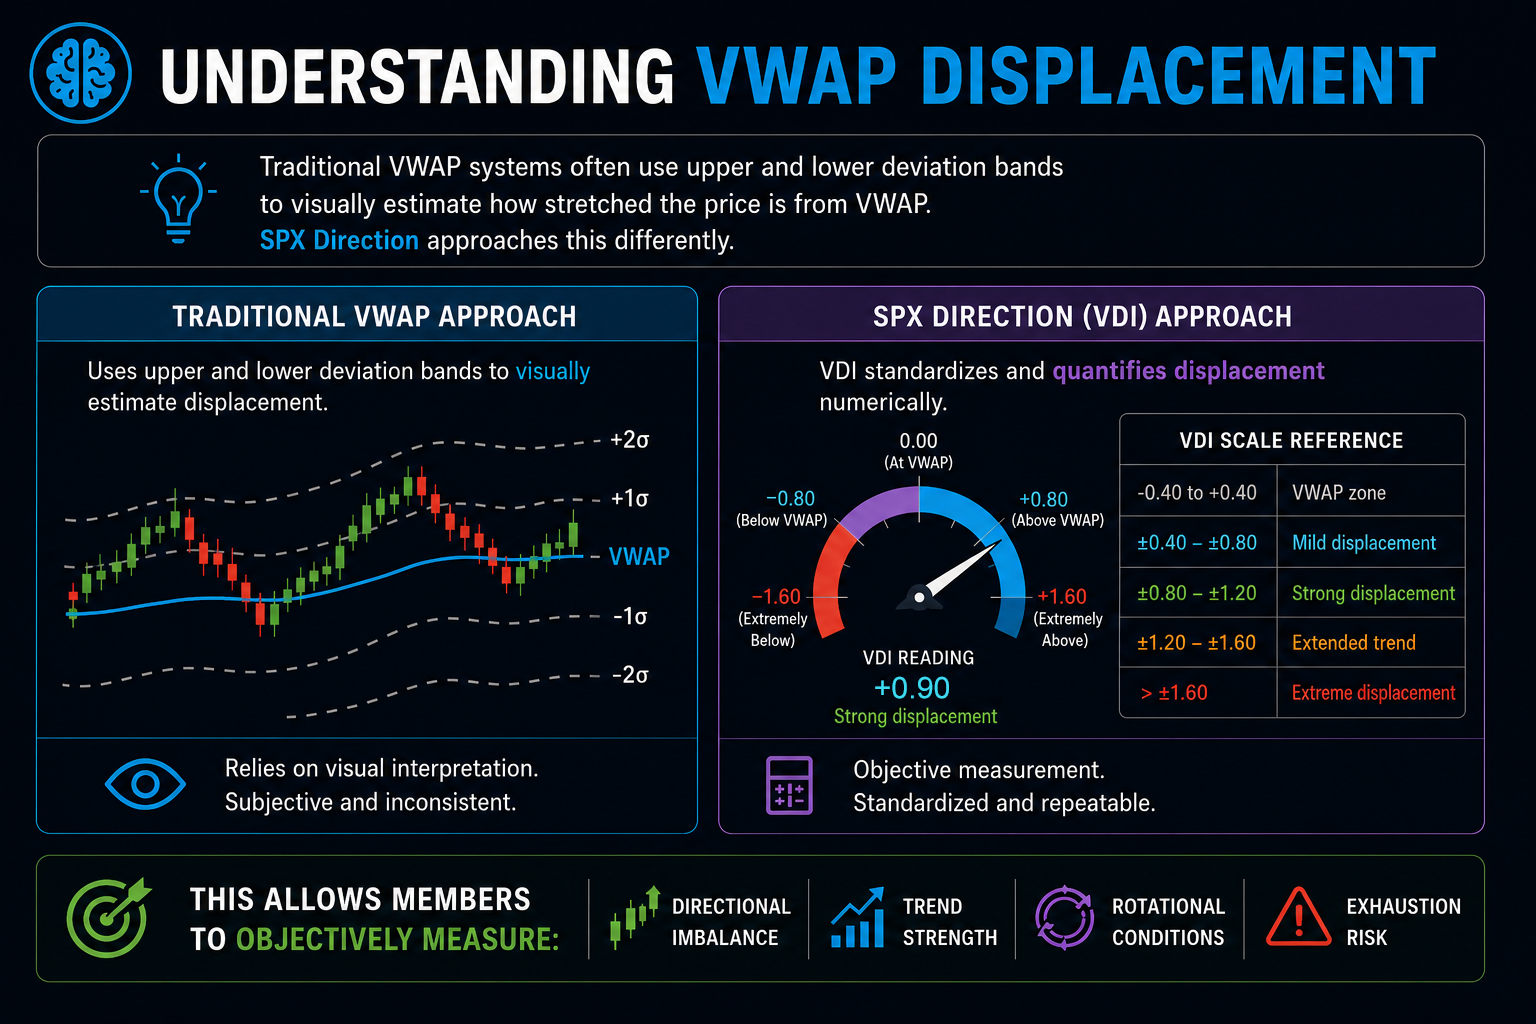
Traditional VWAP systems often use upper and lower deviation bands to visually estimate how stretched the price is from VWAP.
SPX Direction approaches this differently.
Instead of relying on visual interpretation alone, VDI standardizes and quantifies displacement numerically.
This allows members to objectively measure:
- directional imbalance
- trend strength
- rotational conditions
- exhaustion risk
🧠 HOW VWAP BANDS RELATE TO VDI
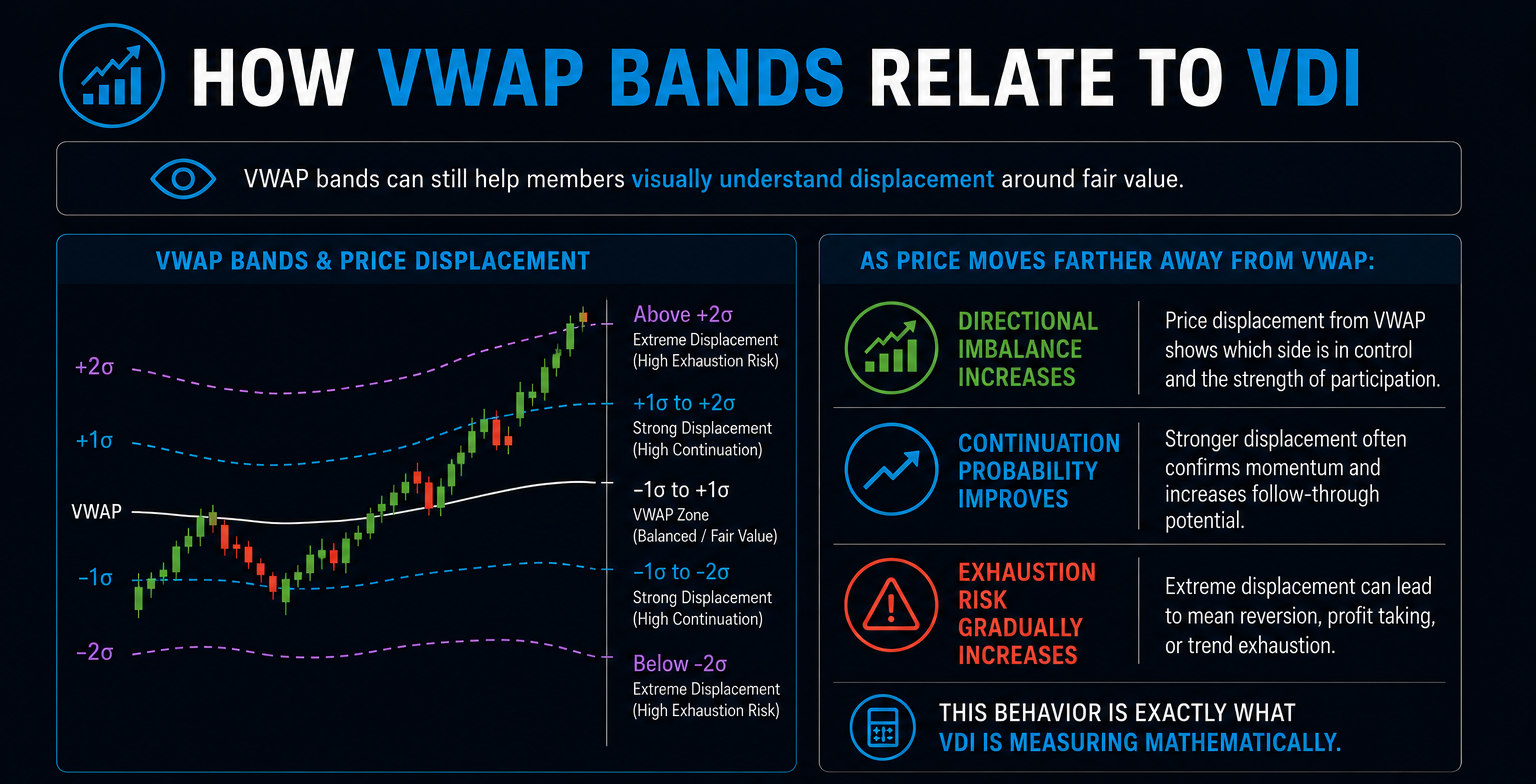
VWAP bands can still help members visually understand displacement around fair value.
As price moves farther away from VWAP:
- directional imbalance increases
- continuation probability improves
- exhaustion risk gradually increases
This behavior is exactly what VDI is measuring mathematically.
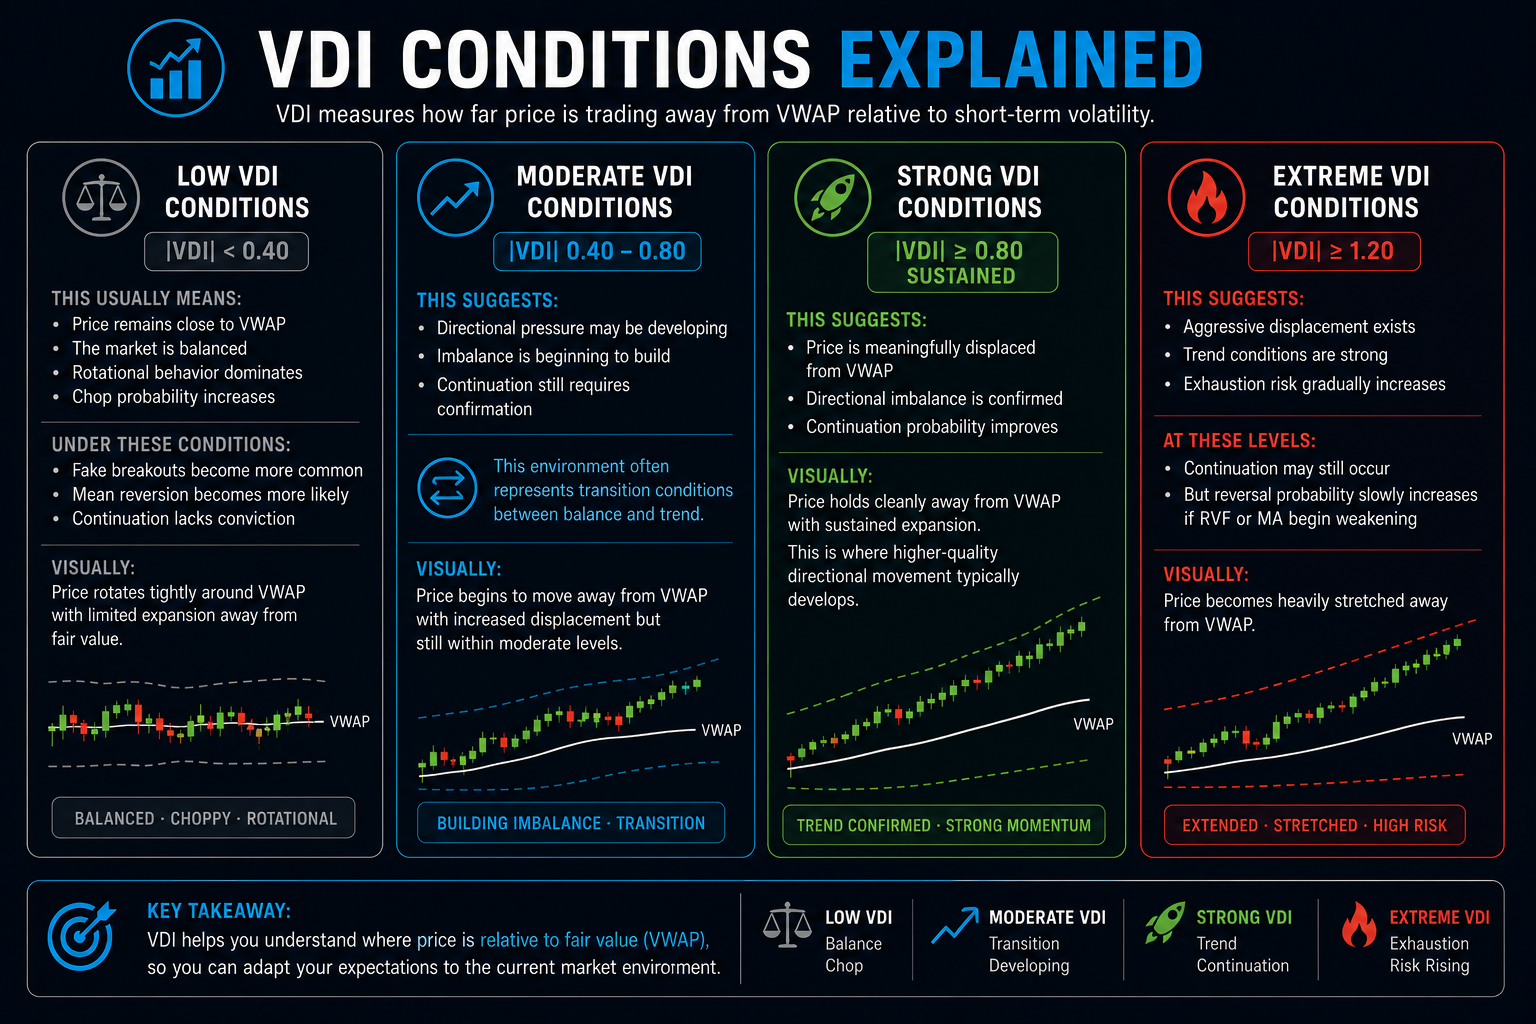
📊 LOW VDI CONDITIONS
|VDI| < 0.40
This usually means:
- price remains close to VWAP
- the market is balanced
- rotational behavior dominates
- chop probability increases
Under these conditions:
- fake breakouts become more common
- mean reversion becomes more likely
- continuation lacks conviction
Visually, this often resembles price rotating tightly around VWAP with limited expansion away from fair value.
📈 MODERATE VDI CONDITIONS
|VDI| between 0.40 and 0.80
This suggests:
- directional pressure may be developing
- imbalance is beginning to build
- continuation still requires confirmation
This environment often represents transition conditions between balance and trend.
🔥 STRONG VDI CONDITIONS
|VDI| ≥ 0.80 sustained
This suggests:
- price is meaningfully displaced from VWAP
- directional imbalance is confirmed
- continuation probability improves
Visually, this often resembles price holding cleanly away from VWAP with sustained expansion.
This is where higher-quality directional movement typically develops.
🚀 EXTREME VDI CONDITIONS
|VDI| ≥ 1.20
This suggests:
- aggressive displacement exists
- trend conditions are strong
- exhaustion risk gradually increases
At these levels:
- continuation may still occur
- but reversal probability slowly increases if RVF or MA begin weakening
Visually, this often resembles price becoming heavily stretched away from VWAP.
🧠 VWAP SLOPE AND MARKET STRUCTURE
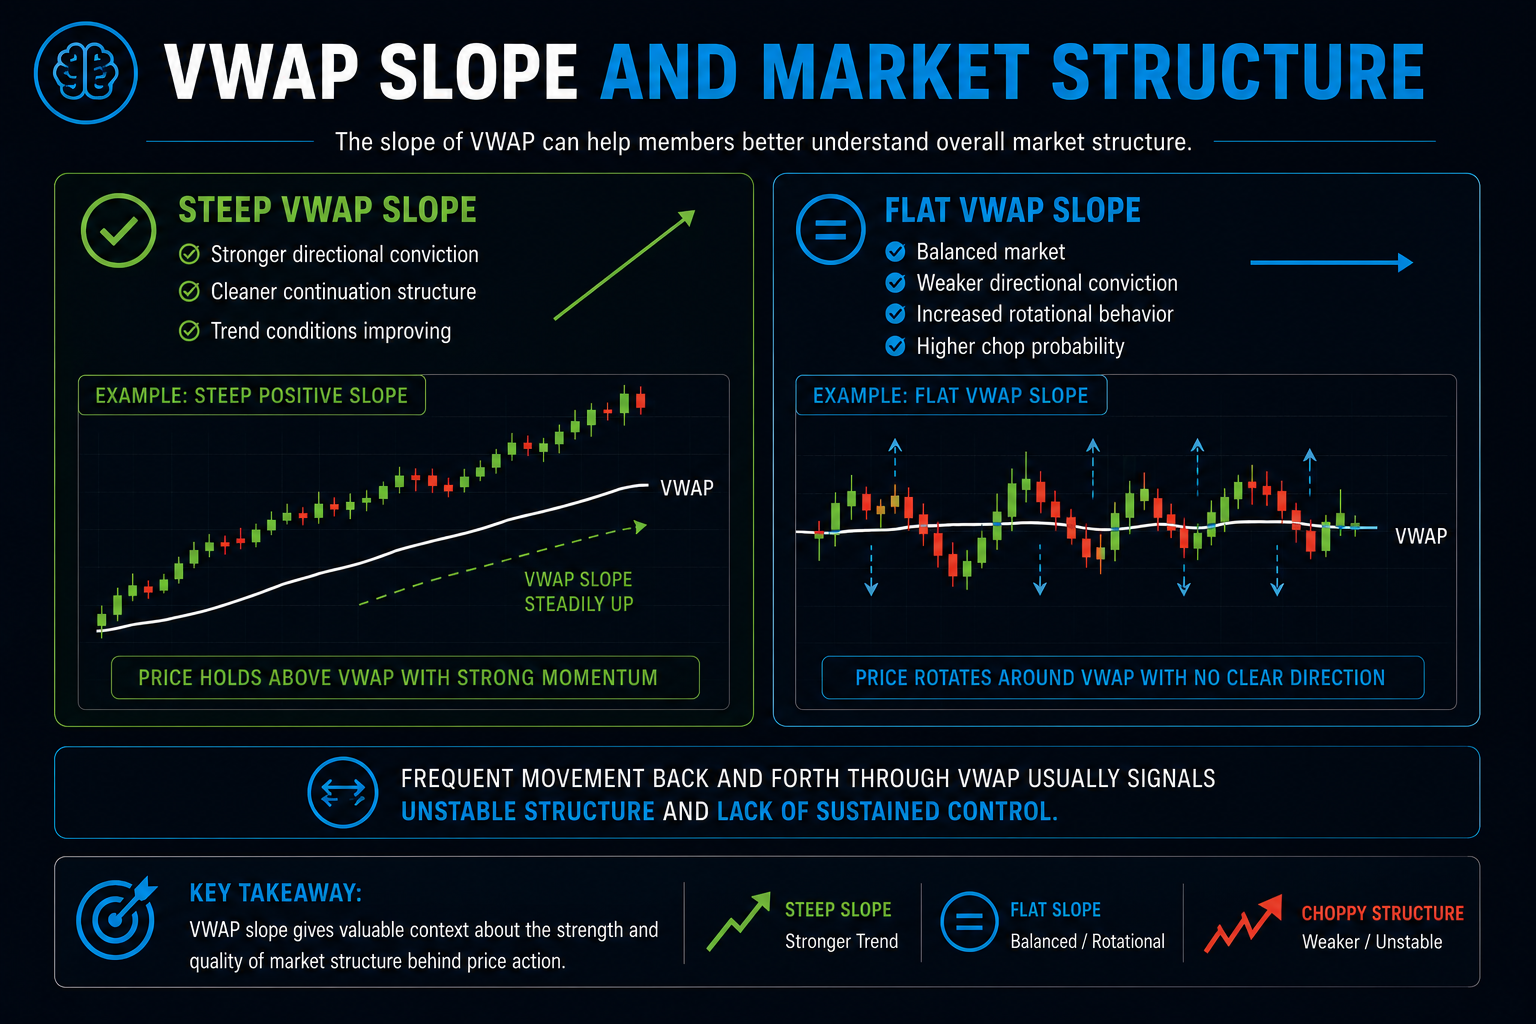
The slope of VWAP can help members better understand overall market structure.
✅ Steep VWAP slope
- stronger directional conviction
- cleaner continuation structure
- trend conditions improving
✅ Flat VWAP slope
- balanced market
- weaker directional conviction
- increased rotational behavior
- higher chop probability
Frequent movement back and forth through VWAP usually signals unstable structure and lack of sustained control.
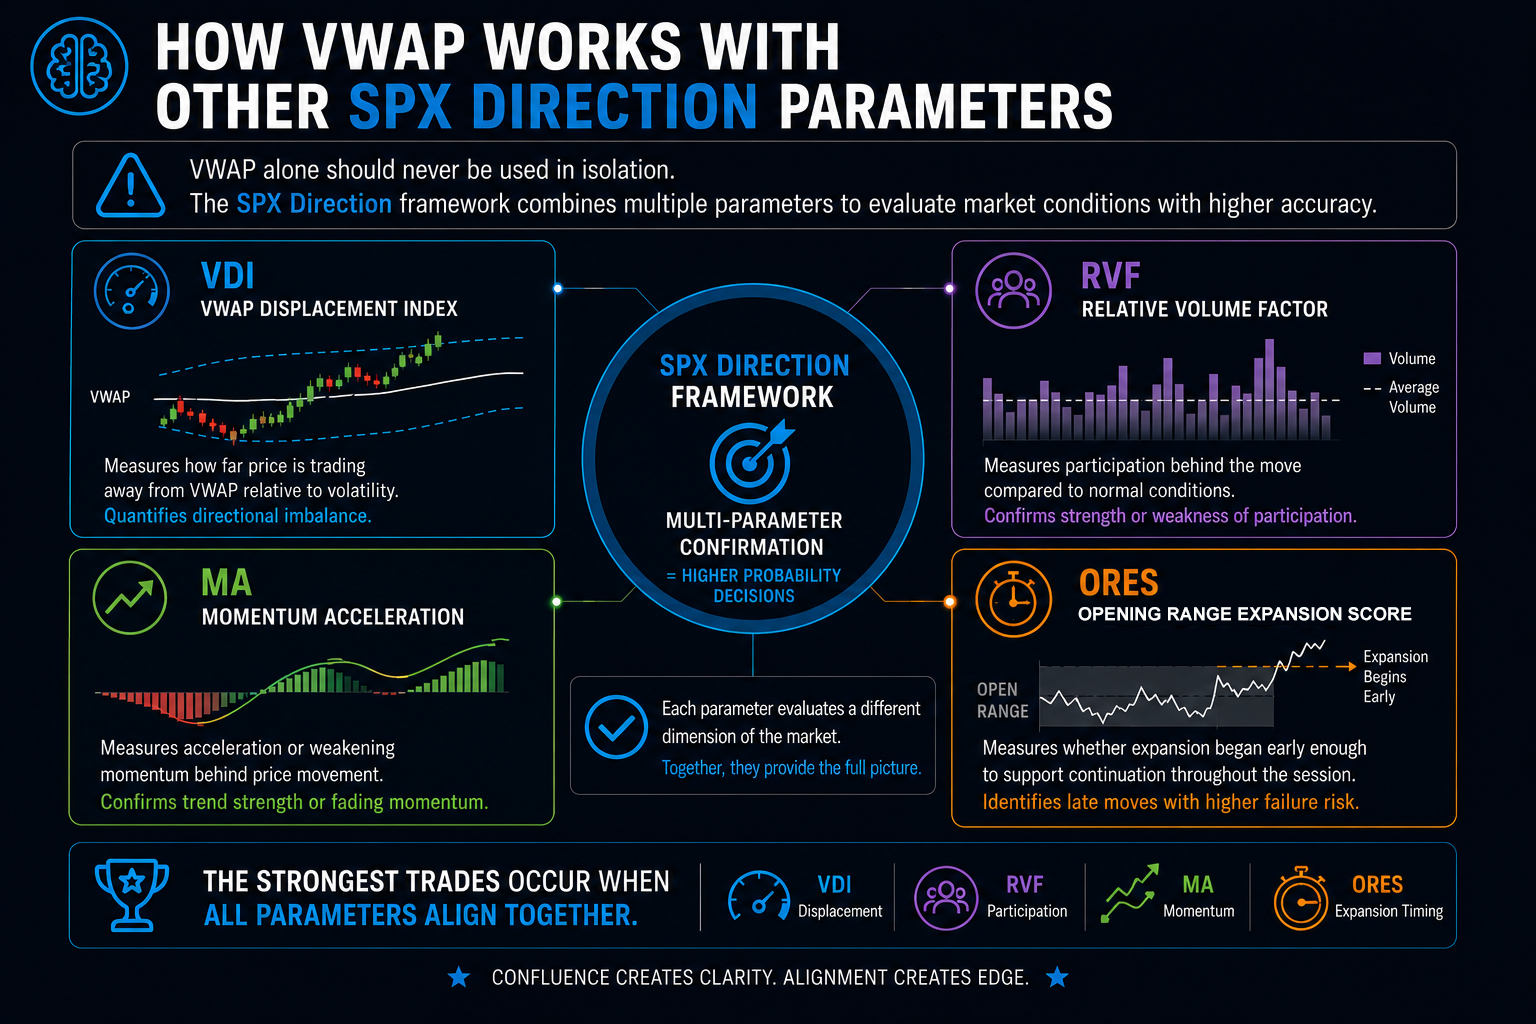
🧠 HOW VWAP WORKS WITH OTHER SPX DIRECTION PARAMETERS
VWAP alone should never be used in isolation.
The SPX Direction framework combines:
VDI
Measures displacement away from VWAP
RVF
Measures participation behind the move
MA
Measures acceleration or weakening momentum
ORES
Measures whether expansion began early enough to support continuation
The strongest trades occur when all parameters align together.
🧠 FINAL TAKEAWAY
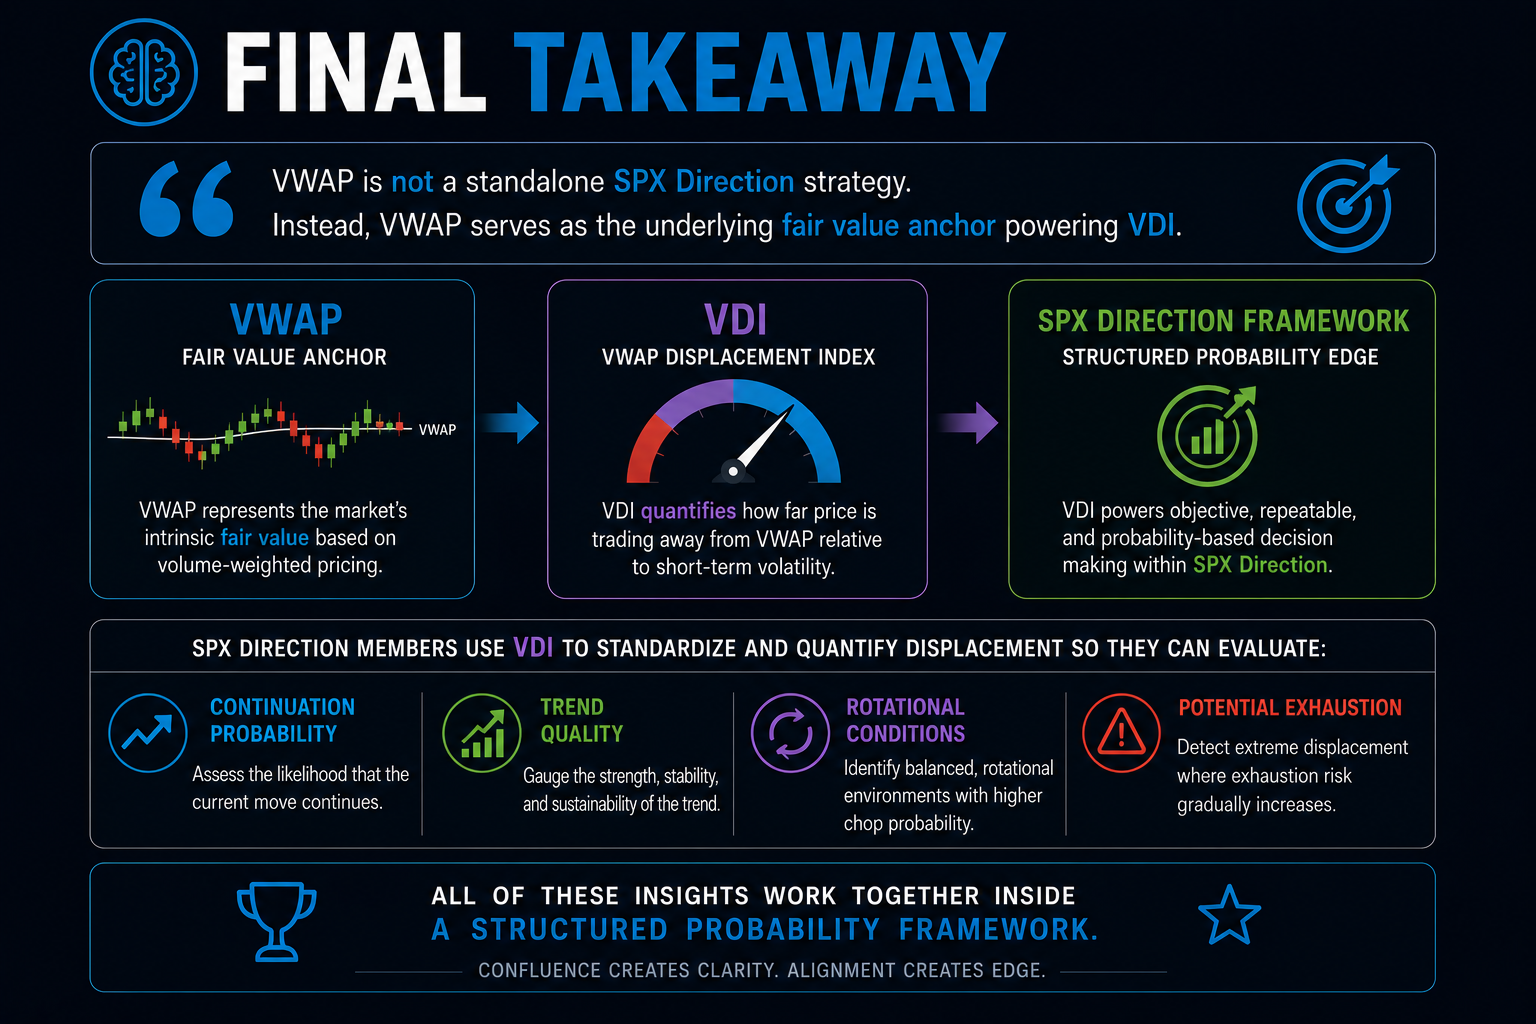
VWAP is not a standalone SPX Direction strategy.
Instead, VWAP serves as the underlying fair value anchor powering VDI.
SPX Direction members use VDI to standardize and quantify displacement so they can evaluate:
- continuation probability
- trend quality
- rotational conditions
- potential exhaustion
inside a structured probability framework.