SPX Direction Momentum
Contact customer support at support@spxdirection.com to get access to all Tradingview indicators.
TradingView link: https://www.tradingview.com/script/5UkWNu2I-SPX-Direction-Momentum/
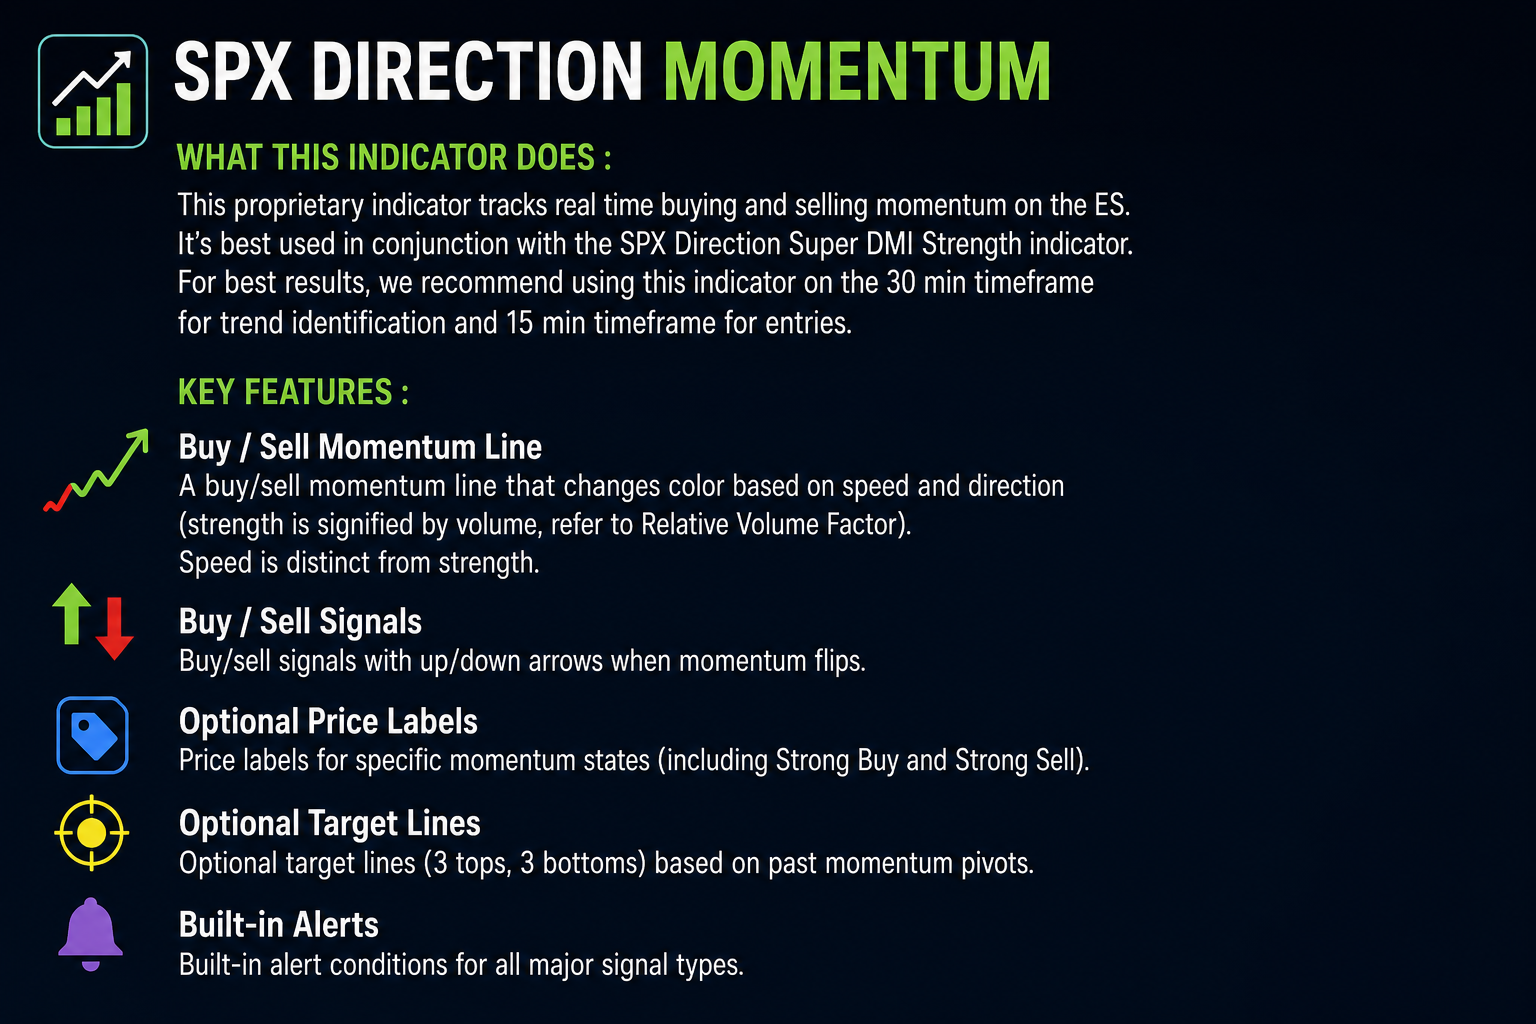
What this indicator does :
This proprietary indicator tracks real time buying and selling momentum on the ES. It's best used in conjunction with the SPX Direction Super DMI Strength indicator. For best results, we recommend using this indicator on the 30 min timeframe for trend identification and 15 min timeframe for entries.
- A buy / sell momentum line that changes color based on speed and direction (strength is signified by volume, refer to Relative Volume Factor). Speed is distinct from strength.
- Buy/sell signals with up/down arrows when momentum flips
- Optional price labels for specific momentum states (including Strong Buy and Strong Sell)
- Optional target lines (3 tops, 3 bottoms) based on past momentum pivots
- Built-in alert conditions for all major signal types
1) Set up the most important input: Resolution
To review and adjust resolution:
- Hover over the indicator on your chart

- Click the Settings (gear) icon.

- Locate "Resolution" - this controls the timeframe used for the automatic real time output, even if the user's chart is on a different timeframe. As an example, this gives a user the flexibility to display the momentum calculation on a 5 minute timeframe while viewing 1 hour candles. For best results, we recommend using this indicator on the 30 min timeframe for trend identification and 15 min timeframe for entries.
Recommended scenarios for resolution:
- Scalping: 1 min or 2 min

- Intraday: 5 min or 15 min

- Swing: 1H to 4H

Tip: You can also select "chart" to use the default chart timeframe (indicator default)
2) How to interpret SPX Direction Momentum
A) The Momentum Line
Color interpretation (state of momentum):
- Green: momentum rising
- Purple: momentum falling
- Blue: transition / flat momentum
- Red: weak drop zone (slightly negative shift)
- Bright green: strong upside momentum burst
It is recommended you leave this ON (it's ON by default). If you turn OFF “Show Momentum Strength”, the momentum line will display in a single color.
B) Buy / Sell Signals (Change in the State of Momentum)
The arrows appear when momentum changes direction on that timeframe:
- Up arrow: momentum slope flips to rising
- Down arrow: momentum slope flips to falling
These are significant "shifts" in the market.
C) Price Labels (optional)
This script can print price labels on the arrow bar or on specific momentum states.
In the settings, you will see toggles like:
- Show Market Price Label
- Show Strong Buyer Momentum Bright Green Price Label
- Show Strong Seller Momentum Red Price Label
- Show Transition Blue Price Label
- Show Double Buy Price Label
- Show Double Sell Price Label

When you add this indicator to your chart, it will automatically display our default recommended settings.
3) How to trade or use signals (simple workflow)
Step 1: Pick your “signal quality” level
If you want fewer, stronger signals: focus on Double Buy and Double Sell labels.
If you want more activity: use the arrows plus the strong color shifts.
Step 2: Use the momentum color as confirmation
Examples:
- Up arrow + green/bright green momentum = stronger upside confirmation
- Down arrow + purple/red momentum = stronger downside confirmation
- Blue momentum = transition zone, be selective
Step 3: Use Double signals as “high confidence”
A Double Buy or Double Sell triggers when buy or sell conditions repeat recently, meaning momentum is not just a one-bar flip.
4) Turn on “Targets” (optional advanced feature)
If you want horizontal target lines on the momentum panel:
- Open indicator settings.
- Turn ON Show Lines.

- Set Bars To Look Back (example: 200).

- Optionally enable Target Label 1/2/3.

You will see up to:
- 3 top target lines (up trend lines)
- 3 bottom target lines (down trend lines)
These are based on past momentum pivots and can be used as reference zones.
5) Set alerts (built-in)
This indicator includes alert conditions for:
- Transition Blue
- Strong Buyer Momentum Green
- Strong Buyer Momentum Bright Green
- Strong Seller Momentum Purple
- Strong Seller Momentum Red
- Buyer Momentum (arrow up)
- Seller Momentum (arrow down)
- Double Buy
- Double Sell
How to create the alert
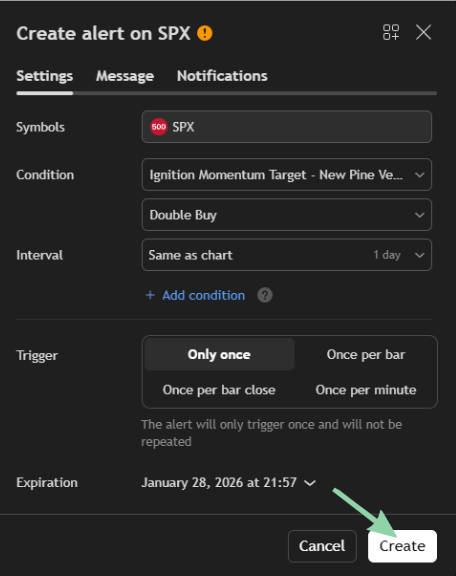
- Click the indicator name on the chart.
- Click the three dots.

- Click Add alert.

- In Condition, choose the specific alert (example: “Double Buy”).

- Set your notification (popup, app, webhook, etc).

- Click Create.

6) Troubleshooting (fast fixes)
- No signals showing: Make sure Arrow On All Times is ON
- Too many labels: Turn OFF most label toggles
- Looks different vs your timeframe: Set the Resolution to the required timeframe
- Chart feels slow: Turn OFF “Show Lines” and reduce “Bars To Look Back”