SPX Direction Super DMI Strength
Contact customer support at support@spxdirection.com to get access to all Tradingview indicators.
TradingView link: https://www.tradingview.com/script/ym9F03RO-SPX-Direction-Super-DMI-Strength/
1) What this indicator does:
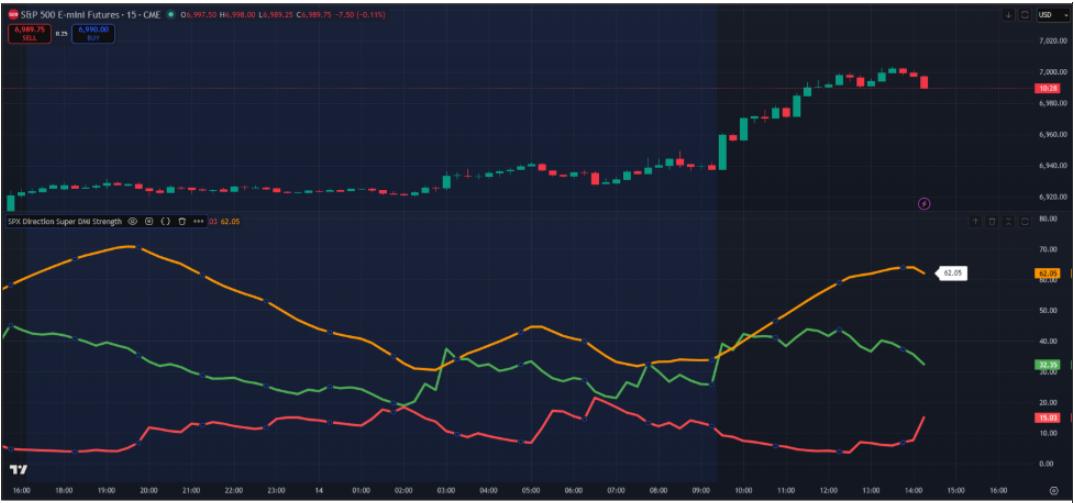
This indicator displays:
- ADX (trend strength)
- +DI and -DI (directional movement of buyers vs sellers)

The ADX line displays the "strength" of the dominating force (buyers / sellers) and how it evolves over time.
- The most important line is ADX. When you enable "ADX strength", the color of the ADX line will change dynamically based on the "strength" of the dominating force.
- +DI and -DI represent the buyers and sellers respectively.


Use SPX Direction Momentum as your "main indicator" and SPX Direction Super DMI Strength for added confirmation.
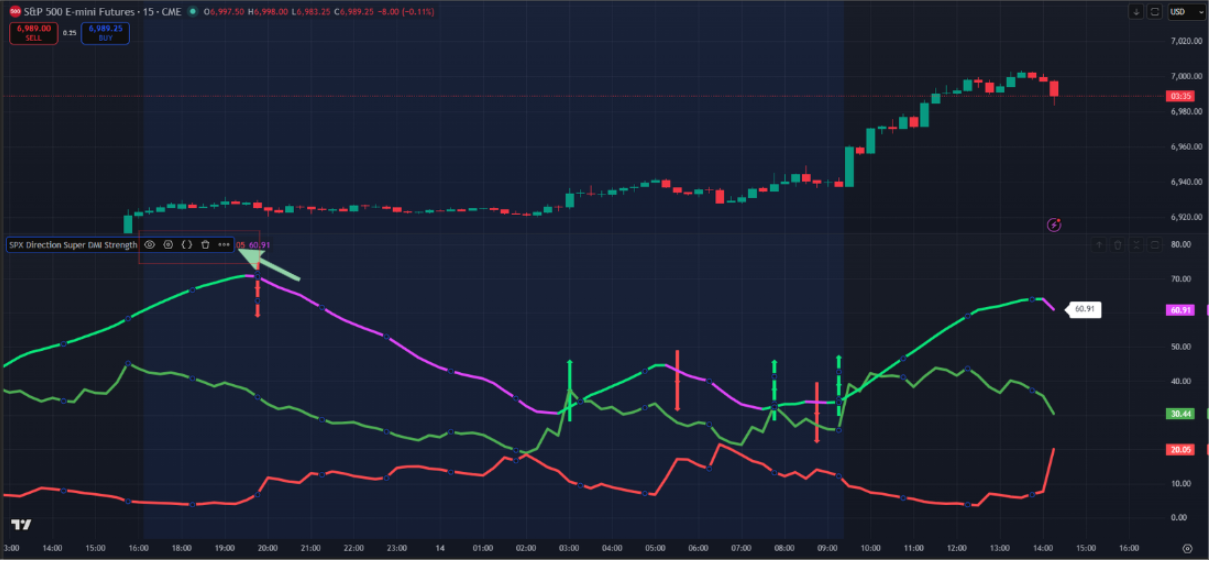
2) How to set the indicator Resolution (important)
Hover your mouse over the indicator on your chart indicator name on the chart.
Click the ⚙️ Settings icon.
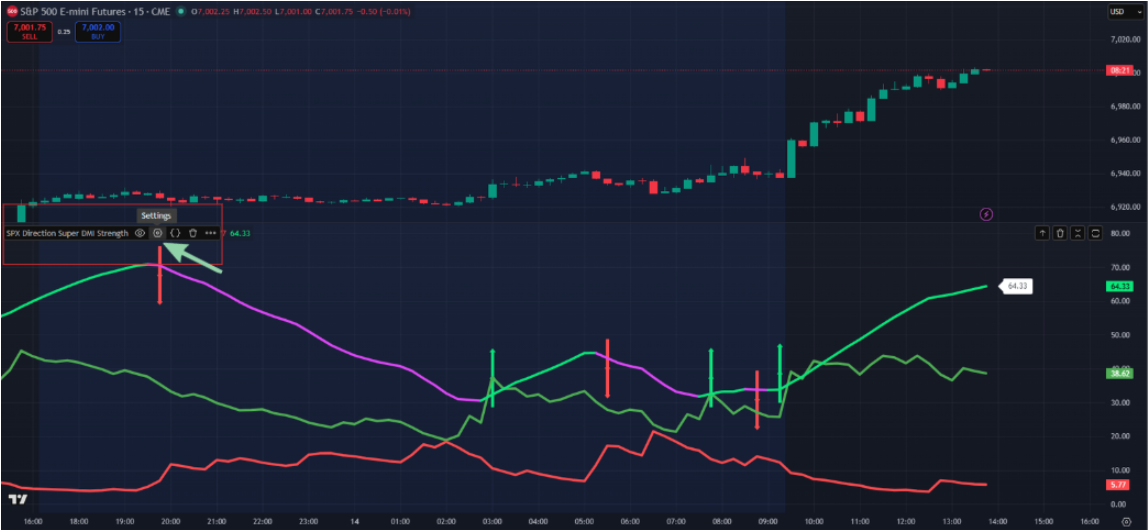
Locate Resolution.
Choose the timeframe you want the ADX/DI to be calculated from (example: 2 min, 5 min, 15 min, 1H). In most cases, you want to leave it at the "chart" default.
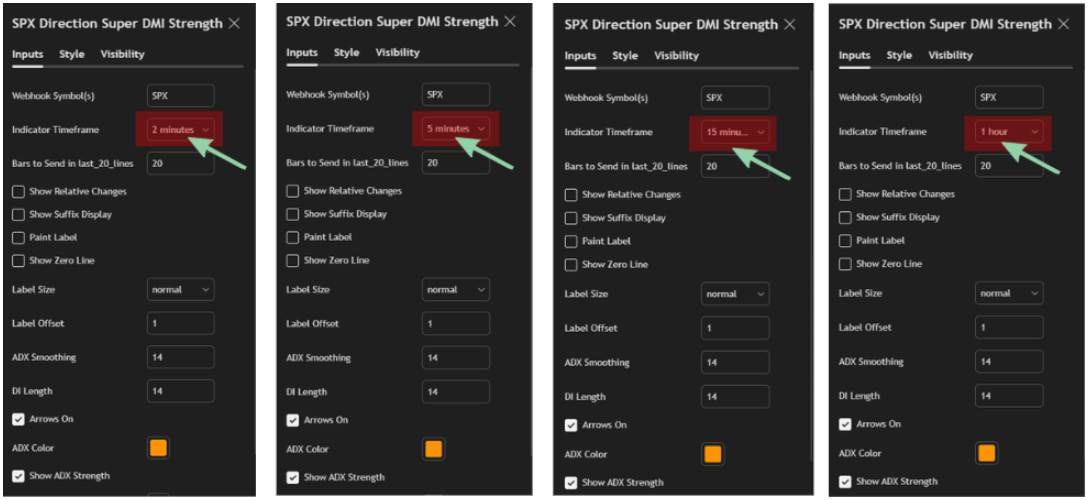
The indicator supports a "customizable resolution". Let's say your indicator is on the 1H timeframe, this indicator can calculate ADX using a different timeframe, so you can customize the indicator settings to display the 5 min ADX on a 1H timeframe.
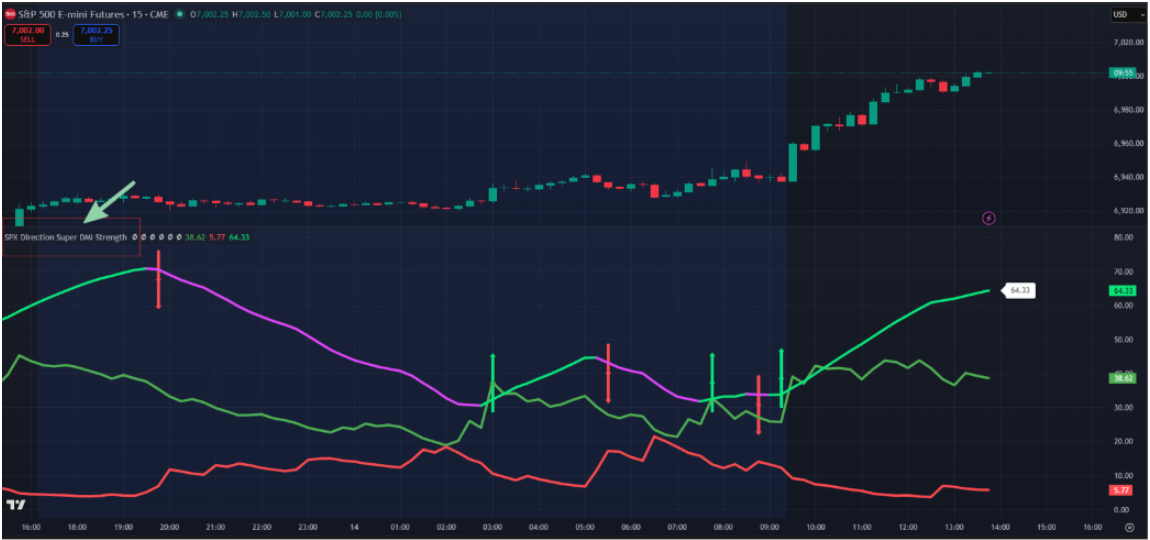
3) How the indicator identifies key shifts in the market
A) Arrow signals
This proprietary indicator autmatically displays arrows when ADX crosses important thresholds like its previous value (prevVal).
- Green Up Arrow = ADX crosses above its previous value (strength rising)

- Red Down Arrow = ADX crosses below its previous value (strength falling)
There are 2 “modes” based on the ADX level:
1) Single arrows (ADX below 25)
Triggered when ADX < 25
- Smaller arrows
- This zone usually means the market is weaker or transitioning
2) Double arrows (ADX at or above 25)
Triggered when ADX >= 25
- Bigger arrows, and you’ll see extra arrows stacked (your script plots multiple shapes for emphasis)
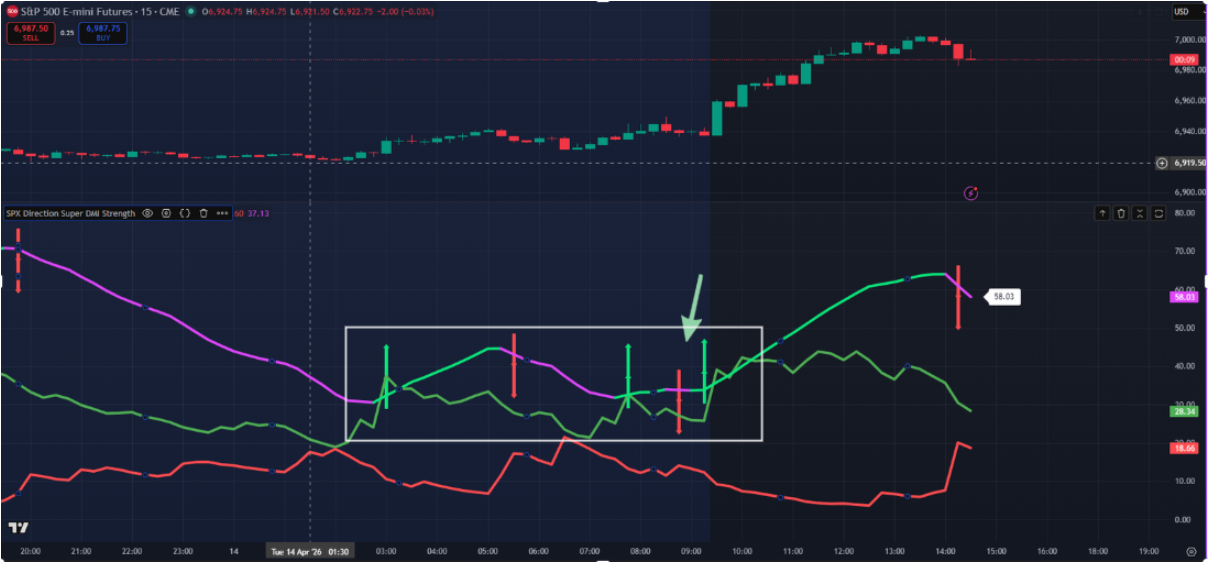
- This zone usually means trend strength is strong enough to respect
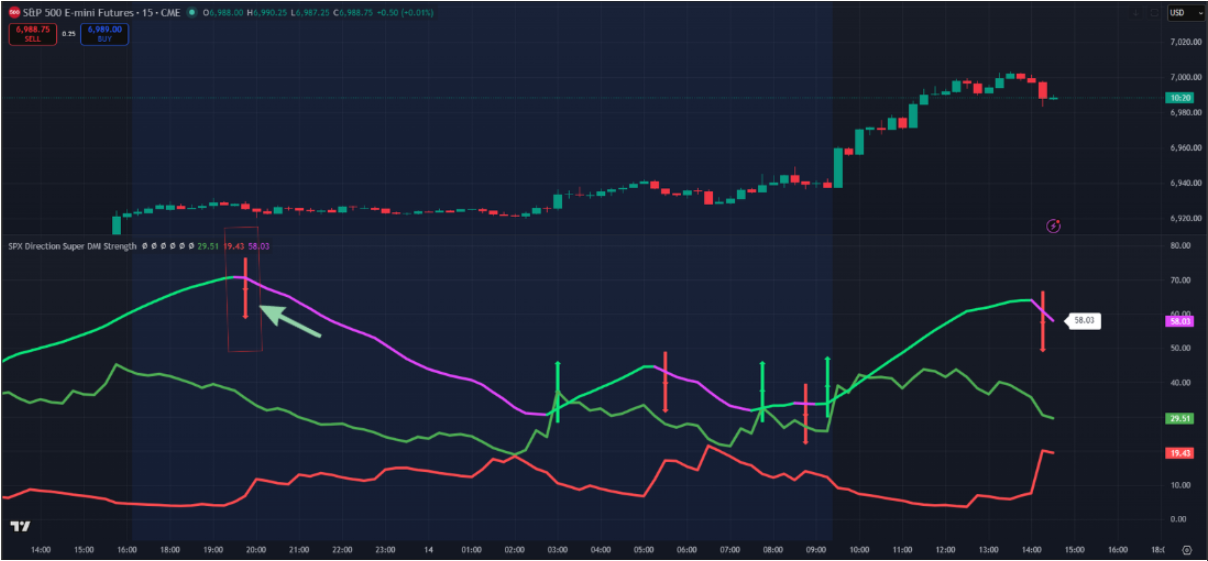
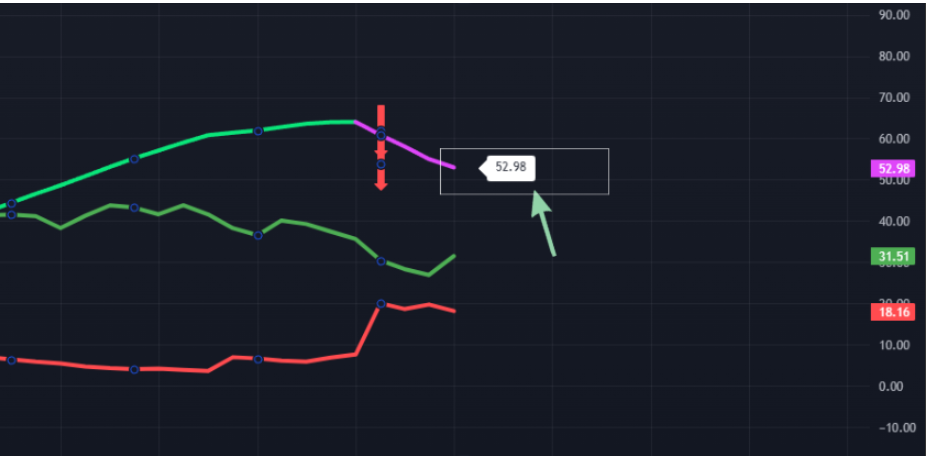
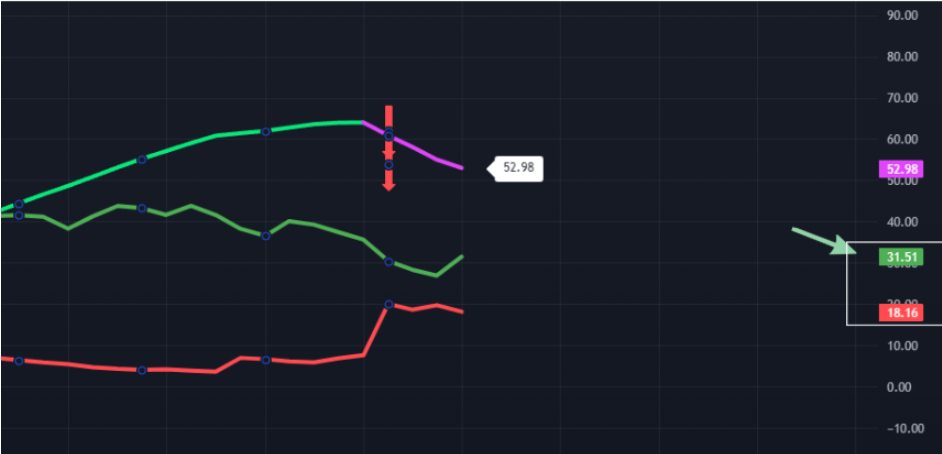
B) How to interpret ADX color
If "Show ADX strength" is ON (recommended):
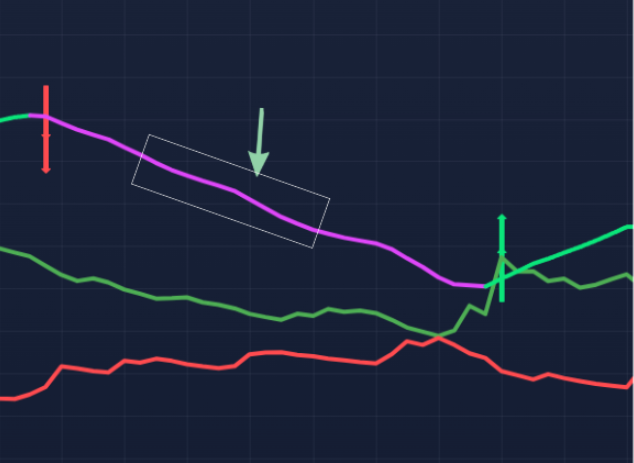
- Green ADX = ADX is rising noticeably

- Purple ADX = ADX is falling noticeably
Special color overrides:
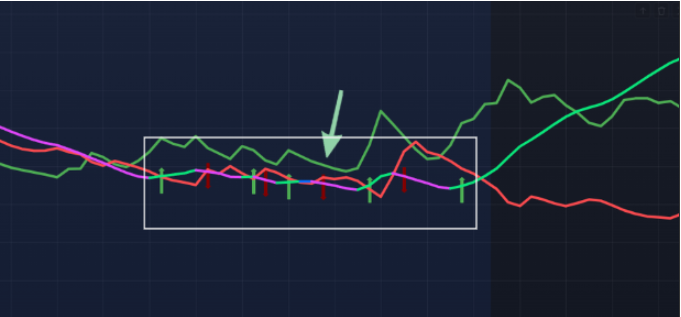
- If ADX change is slightly negative (around -0.05 to -0.02) it can turn red
- If ADX change is near flat (-0.02 to 0.02) it can turn blue
This allows you to quickly identify:
- Rising strength
- Falling strength
- Flat strength
C) The “market price” labels (optional)
If Show Market Price is ON, the script prints the current close price on the arrow bar using labels. Caution - this could make your chart a lot more cluttered.
This is helpful if you want to quickly log entries or instantly identify price around key signals.
Recommended Settings
- Resolution: Chart
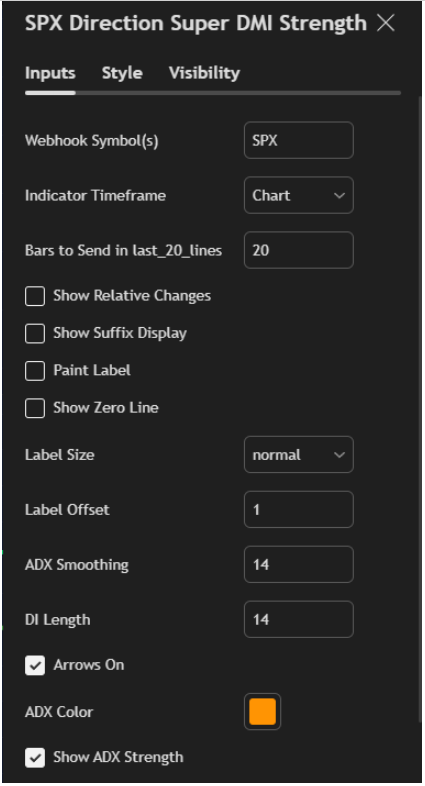
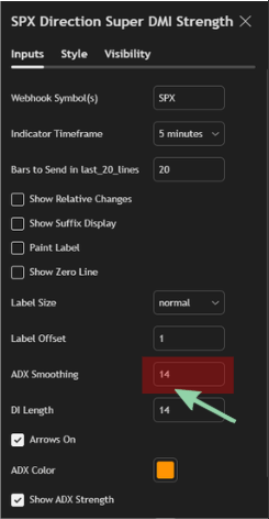
- ADX Smoothing (lensig): 14
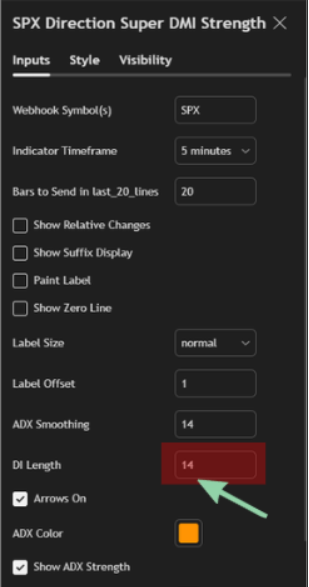
- DI Length (len): 14
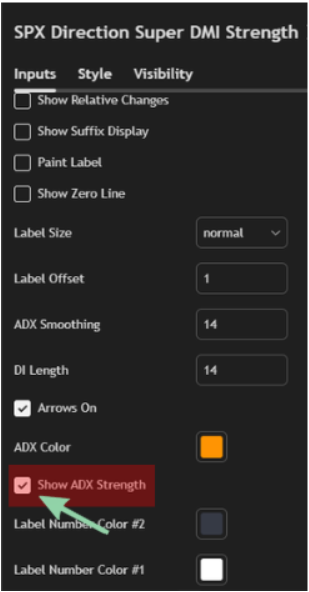
- Show ADX strength: ON
- Arrows On: ON
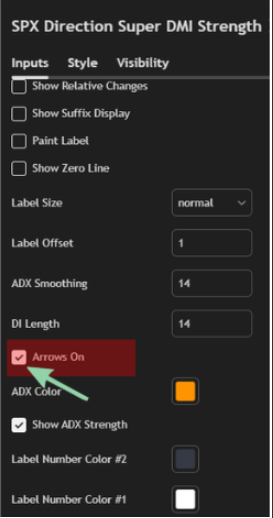
- Show ADX Strength: If this is turned OFF, the ADX line will display in a single color.

-
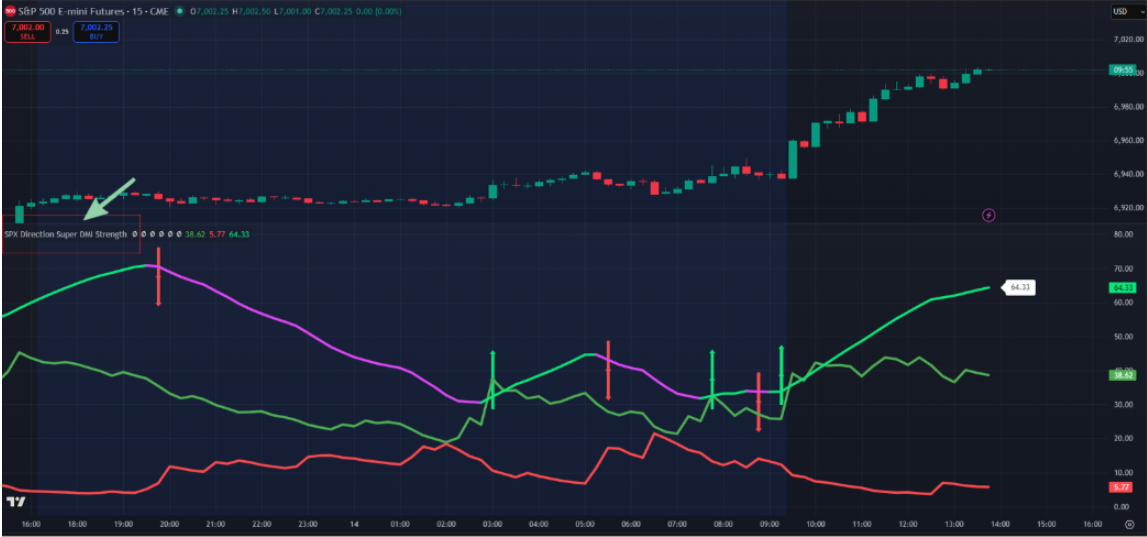
Interpeting the ADX Strength Label
On the latest candle, the script prints a label with:
- ADX value
- Optional suffix (“ADX”) if enabled
- Optional relative change if enabled (in addition to a green / red icon)
If Show Relative Changes is ENABLED, you’ll see:
- ADX value
- A green or red dot icon
- ADX change vs previous value
Alerts setup (built-in)
This script includes alerts for 4 situations:
- Single strength arrow (ADX < 25 and strength rises)
- Single weakness arrow (ADX < 25 and strength falls)
- Double strength arrow (ADX >= 25 and strength rises)
- Double weakness arrow (ADX >= 25 and strength falls)
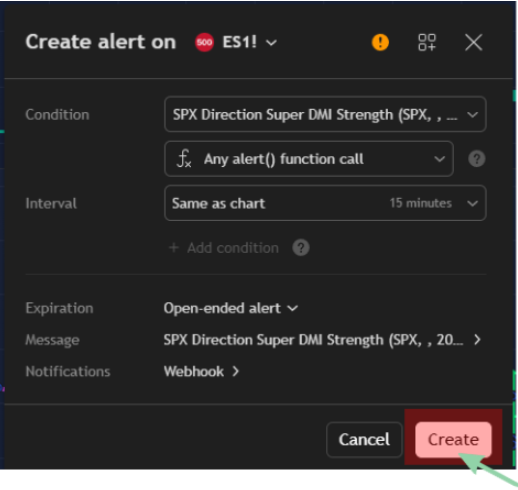
How to create alerts:
- Click the indicator name on chart.
- Click … (three periods).
- Click Add alert on “SPX Direction Super DMI”
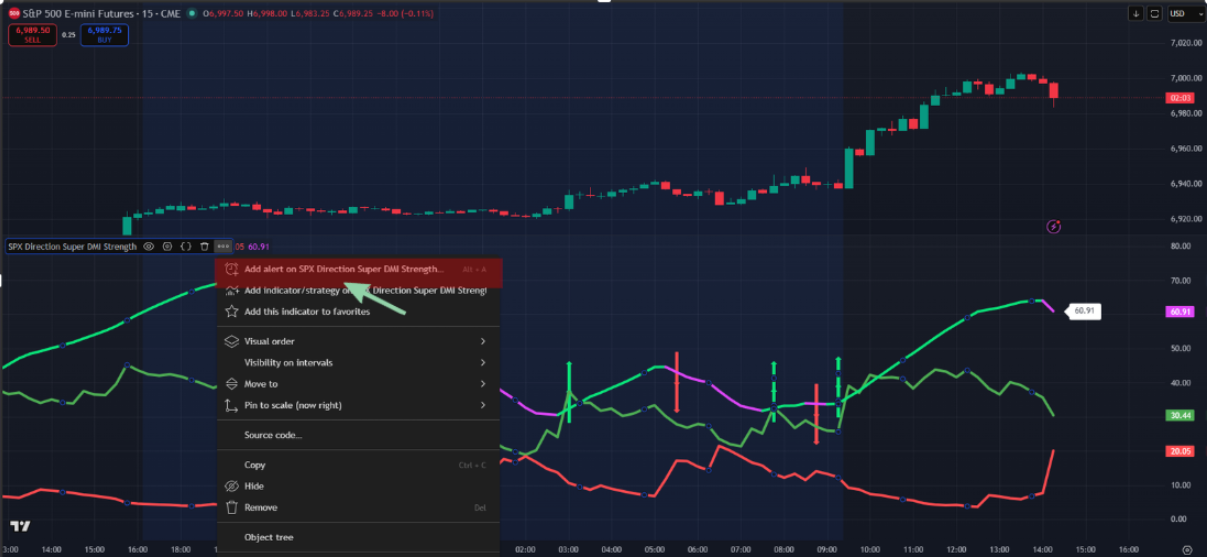
- In the Condition field, pick the alert you want (single/double, strength/weakness)

- Click "Create"