Liquidity Masterclass with SPX Direction Parameters
Contact customer support at support@spxdirection.com
This section explains how the concepts of liquidity, absorption, aggression, reloads, and path of least resistance are reflected directly inside Volume Whale Hunter and how traders should interpret the tool using real auction mechanics.
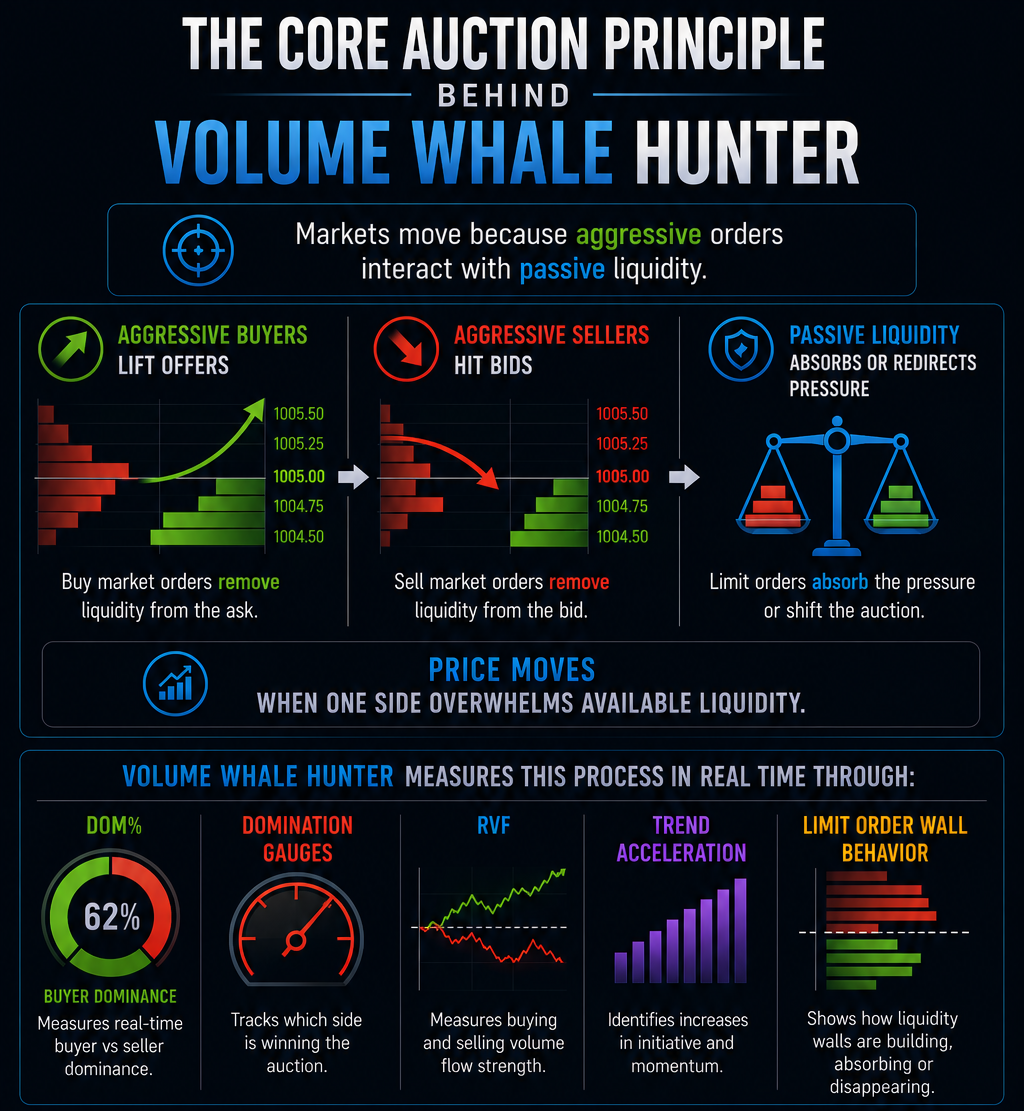
The Core Auction Principle Behind Volume Whale Hunter
Markets move because aggressive orders interact with passive liquidity.
- Aggressive buyers lift offers
- Aggressive sellers hit bids
- Passive liquidity absorbs or redirects pressure
- Price moves when one side overwhelms available liquidity
Volume Whale Hunter measures this process in real time through:
- DOM%
- Domination gauges
- RVF
- Trend acceleration
- Limit order wall behavior
The tool is effectively translating raw market microstructure into readable institutional order flow data.
DOM% = Aggression Efficiency
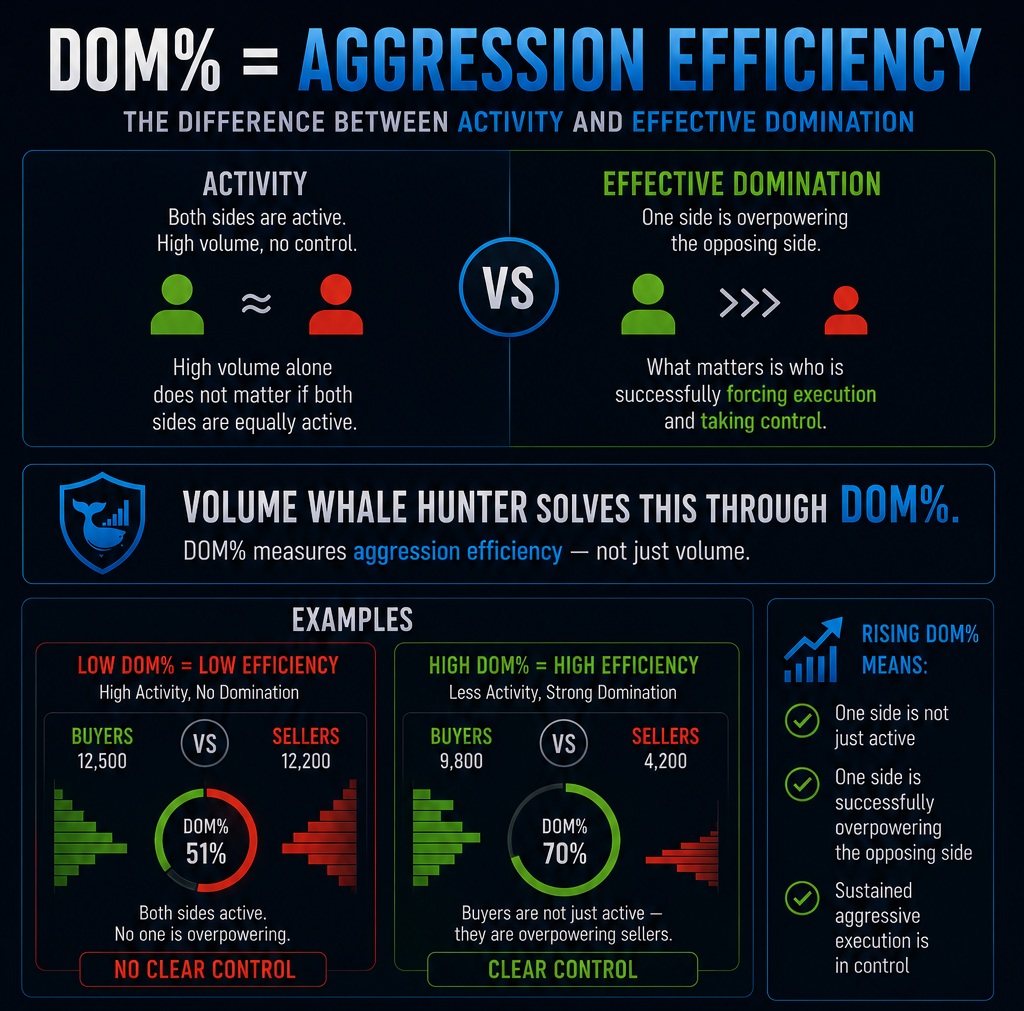
One of the most important auction concepts is the difference between:
- Activity
and - Effective domination
High volume alone does not matter if both sides are equally active.
Volume Whale Hunter solves this through DOM%.
A rising DOM% means:
- One side is not just active
- One side is successfully overpowering the opposing side
This is the closest representation of sustained aggressive execution inside the tool.
Domination Gauges = Aggression vs Absorption
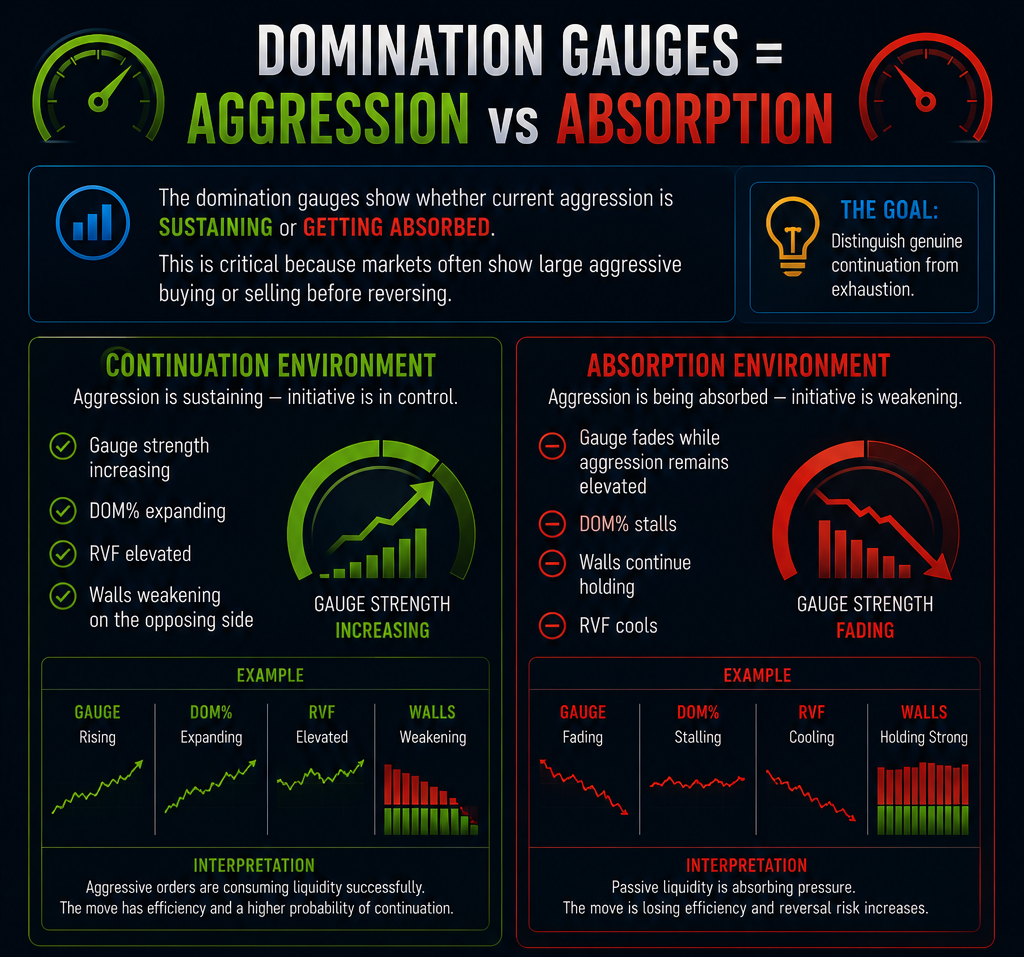
The domination gauges show whether current aggression is:
- Sustaining
or - Getting absorbed
This is critical because markets often show large aggressive buying or selling before reversing.
The gauges help distinguish:
- Genuine continuation
from - Exhaustion
Examples:
Continuation Environment
- Gauge strength increasing
- DOM% expanding
- RVF elevated
- Walls weakening on the opposing side
Interpretation:
- Aggressive orders are consuming liquidity successfully
Absorption Environment
- Gauge fades while aggression remains elevated
- DOM% stalls
- Walls continue holding
- RVF cools
Interpretation:
- Passive liquidity is absorbing pressure
- The move is losing efficiency
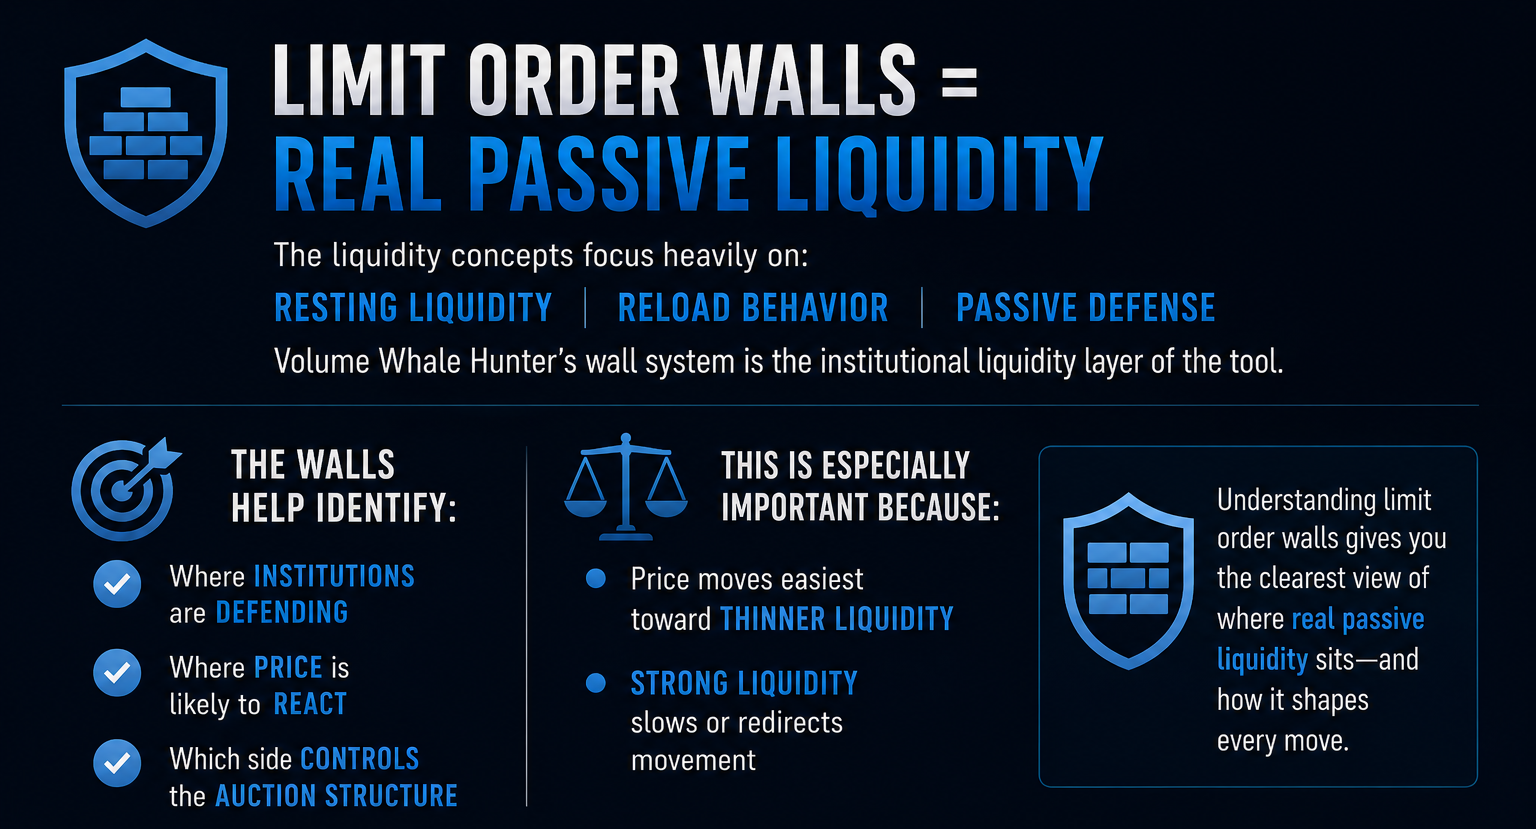
Limit Order Walls = Real Passive Liquidity
The liquidity concepts focus heavily on:
- Resting liquidity
- Reload behavior
- Passive defense
Volume Whale Hunter’s wall system is the institutional liquidity layer of the tool.
The walls help identify:
- Where institutions are defending
- Where price is likely to react
- Which side controls the auction structure
This is especially important because:
- Price moves easiest toward thinner liquidity
- Strong liquidity slows or redirects movement
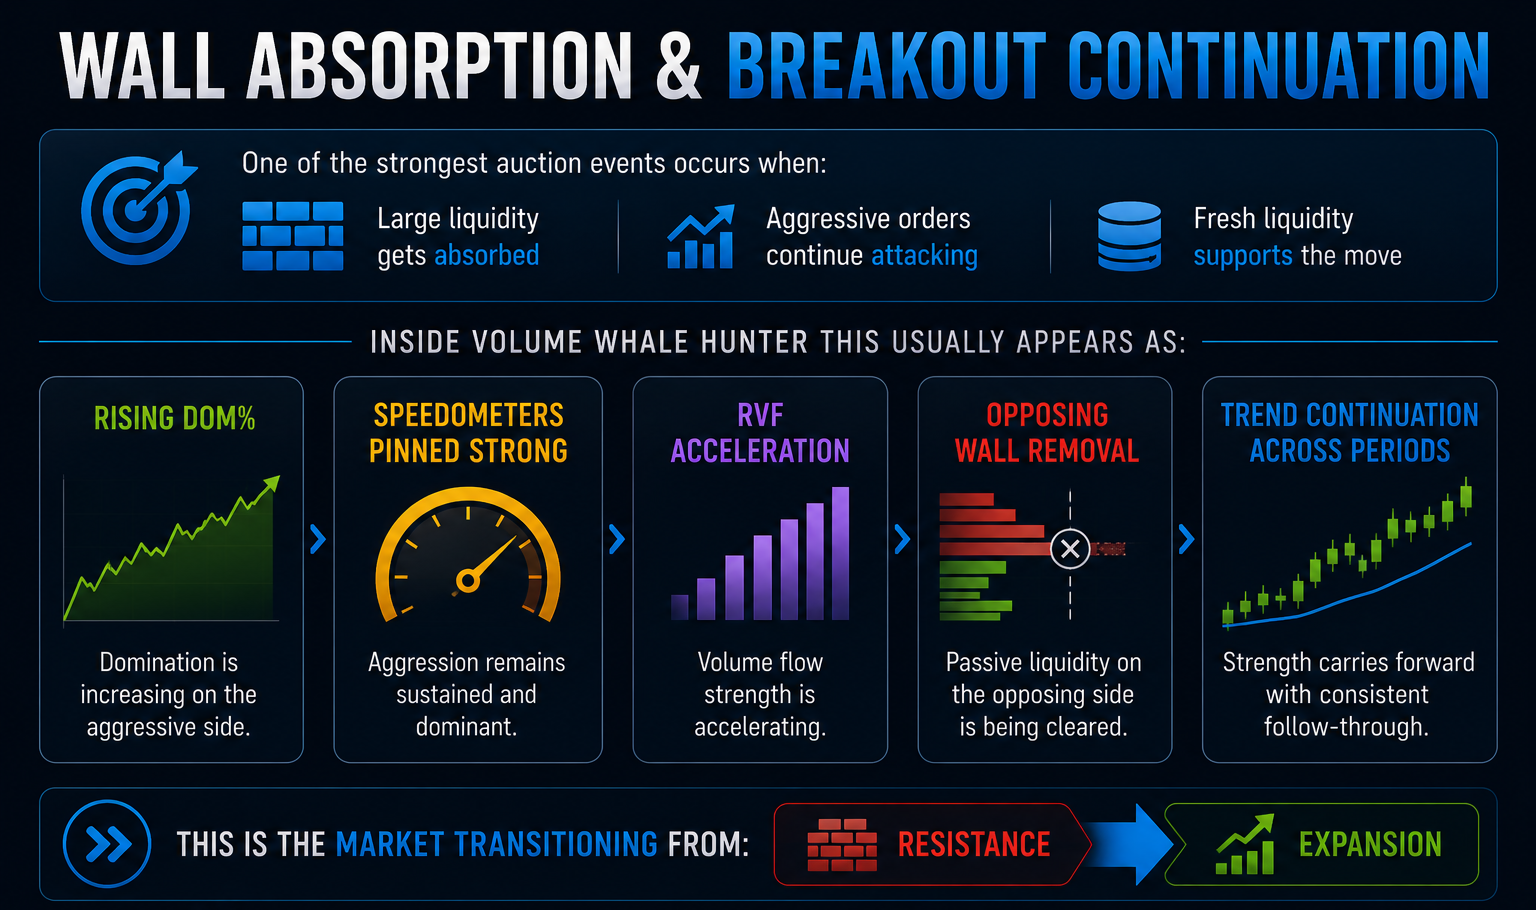
Wall Absorption & Breakout Continuation
One of the strongest auction events occurs when:
- Large liquidity gets absorbed
- Aggressive orders continue attacking
- Fresh liquidity supports the move
Inside Volume Whale Hunter this usually appears as:
- Rising DOM%
- Speedometers pinned strong
- RVF acceleration
- Opposing wall removal
- Trend continuation across periods
This is the market transitioning from:
- Resistance
to - Expansion
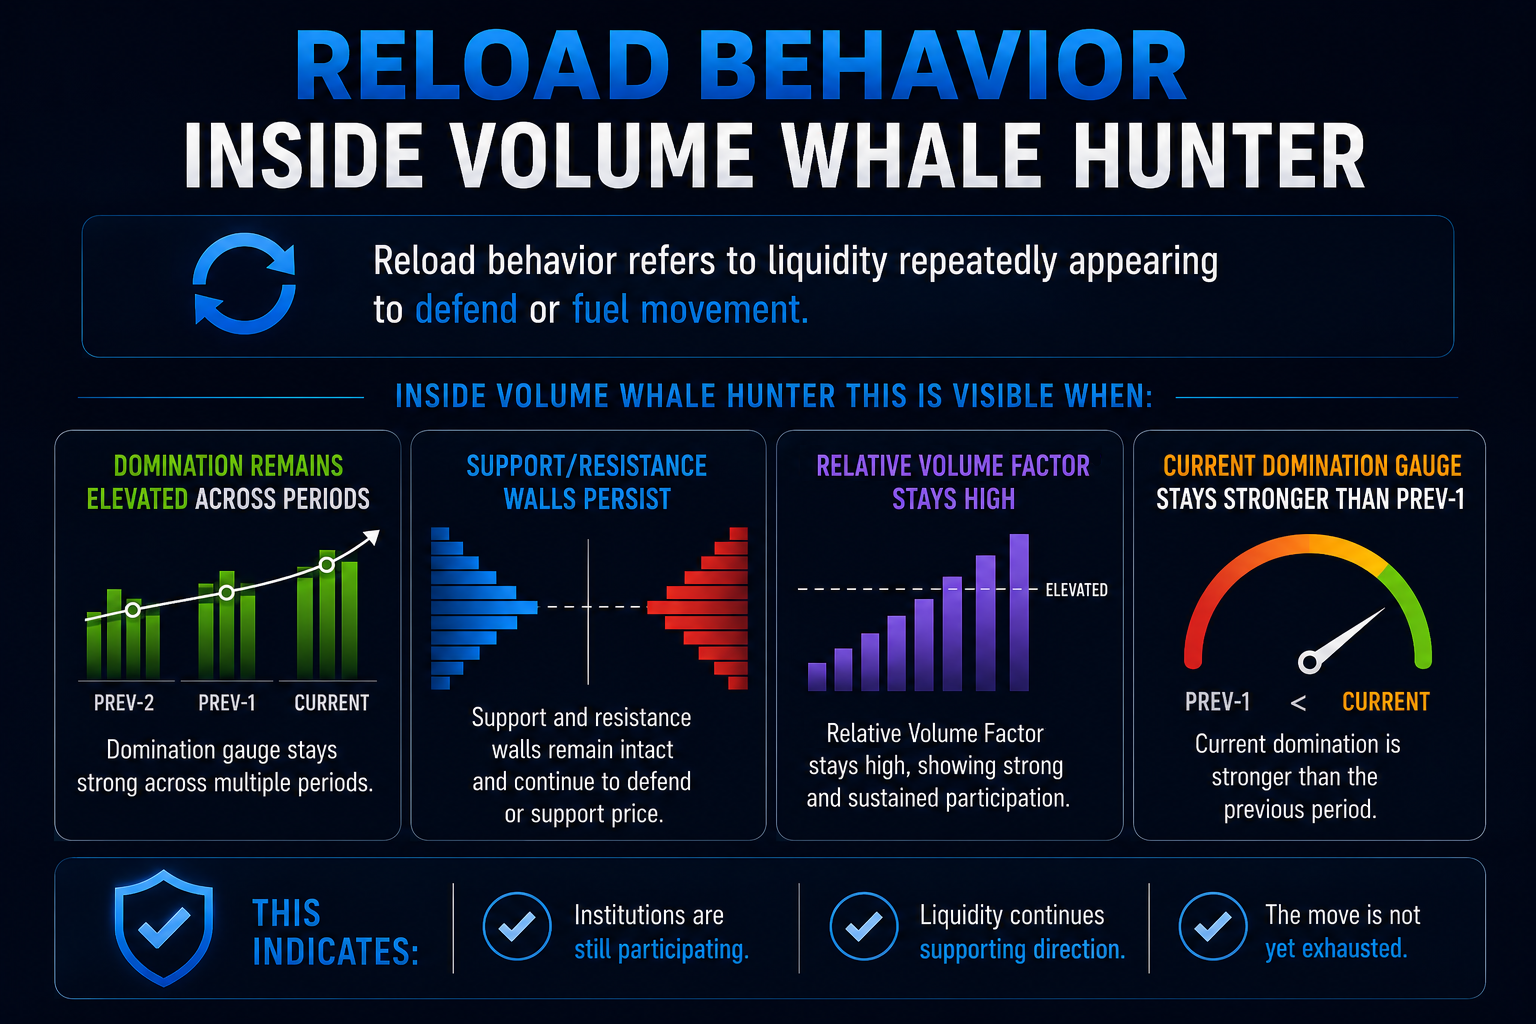
Reload Behavior Inside Volume Whale Hunter
Reload behavior refers to liquidity repeatedly appearing to defend or fuel movement.
Inside Volume Whale Hunter this is visible when:
- Domination remains elevated across periods
- Support/resistance walls persist
- RVF remains elevated
- The current domination gauge stays stronger than Prev-1
This indicates:
- Institutions are still participating
- Liquidity continues supporting direction
- The move is not yet exhausted
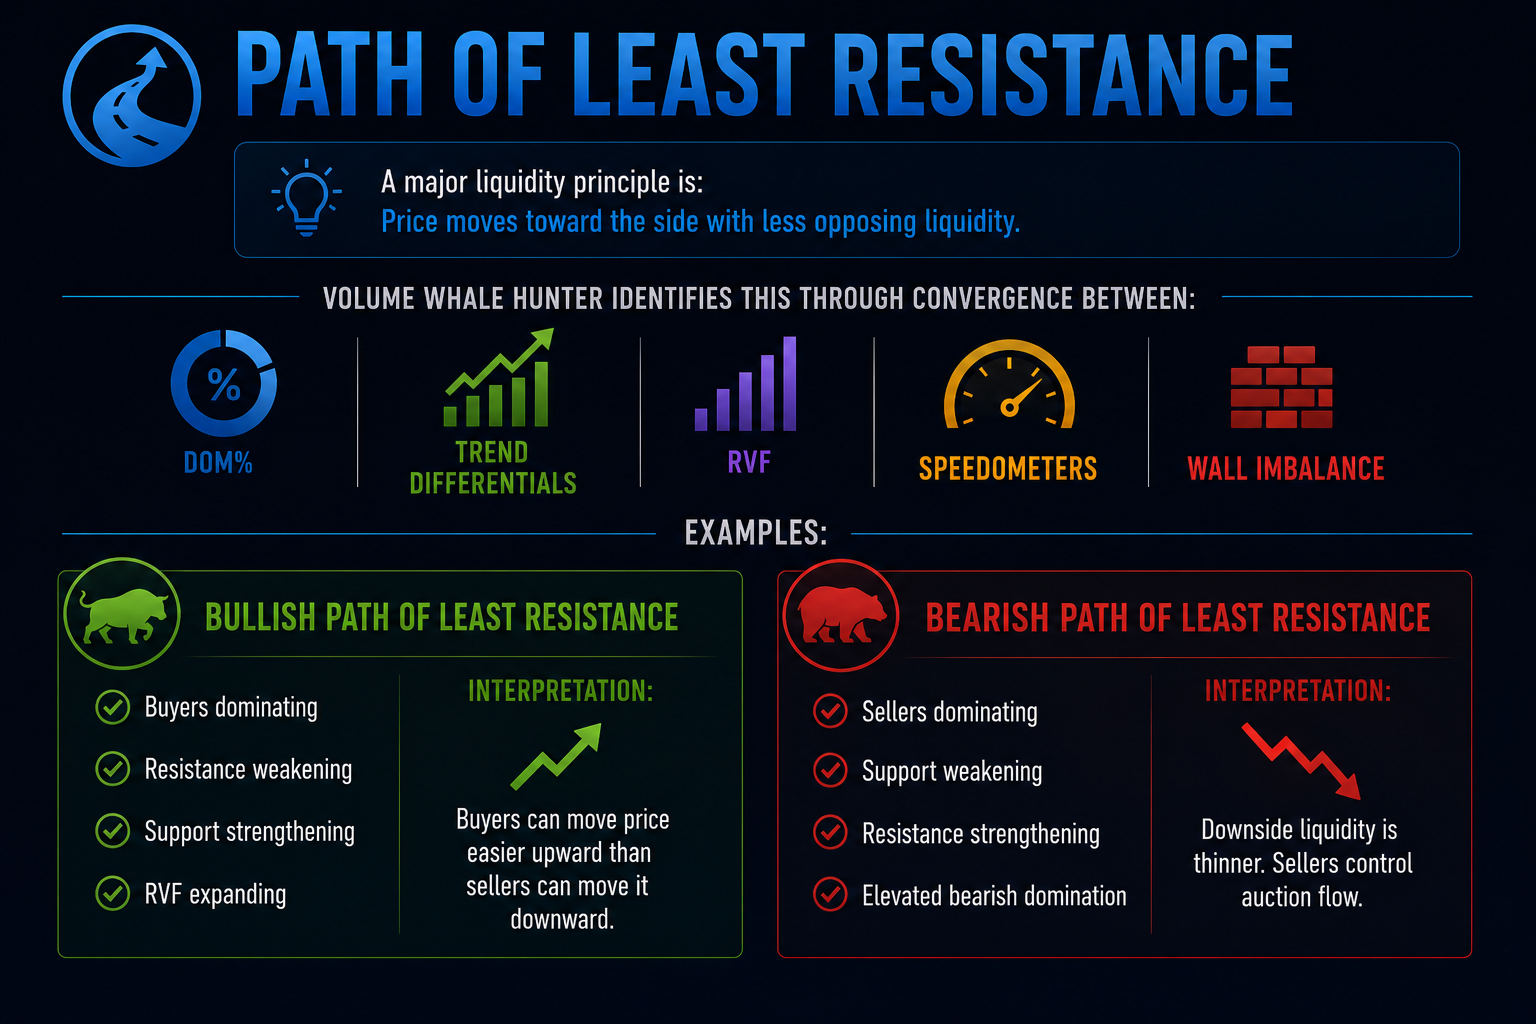
Path of Least Resistance
A major liquidity principle is:
Price moves toward the side with less opposing liquidity.
Volume Whale Hunter identifies this through convergence between:
- DOM%
- Trend differentials
- RVF
- Speedometers
- Wall imbalance
Examples:
Bullish Path of Least Resistance
- Buyers dominating
- Resistance weakening
- Support strengthening
- RVF expanding
Interpretation:
- Buyers can move price easier upward than sellers can move it downward
Bearish Path of Least Resistance
- Sellers dominating
- Support weakening
- Resistance strengthening
- Elevated bearish domination
Interpretation:
- Downside liquidity is thinner
- Sellers control auction flow
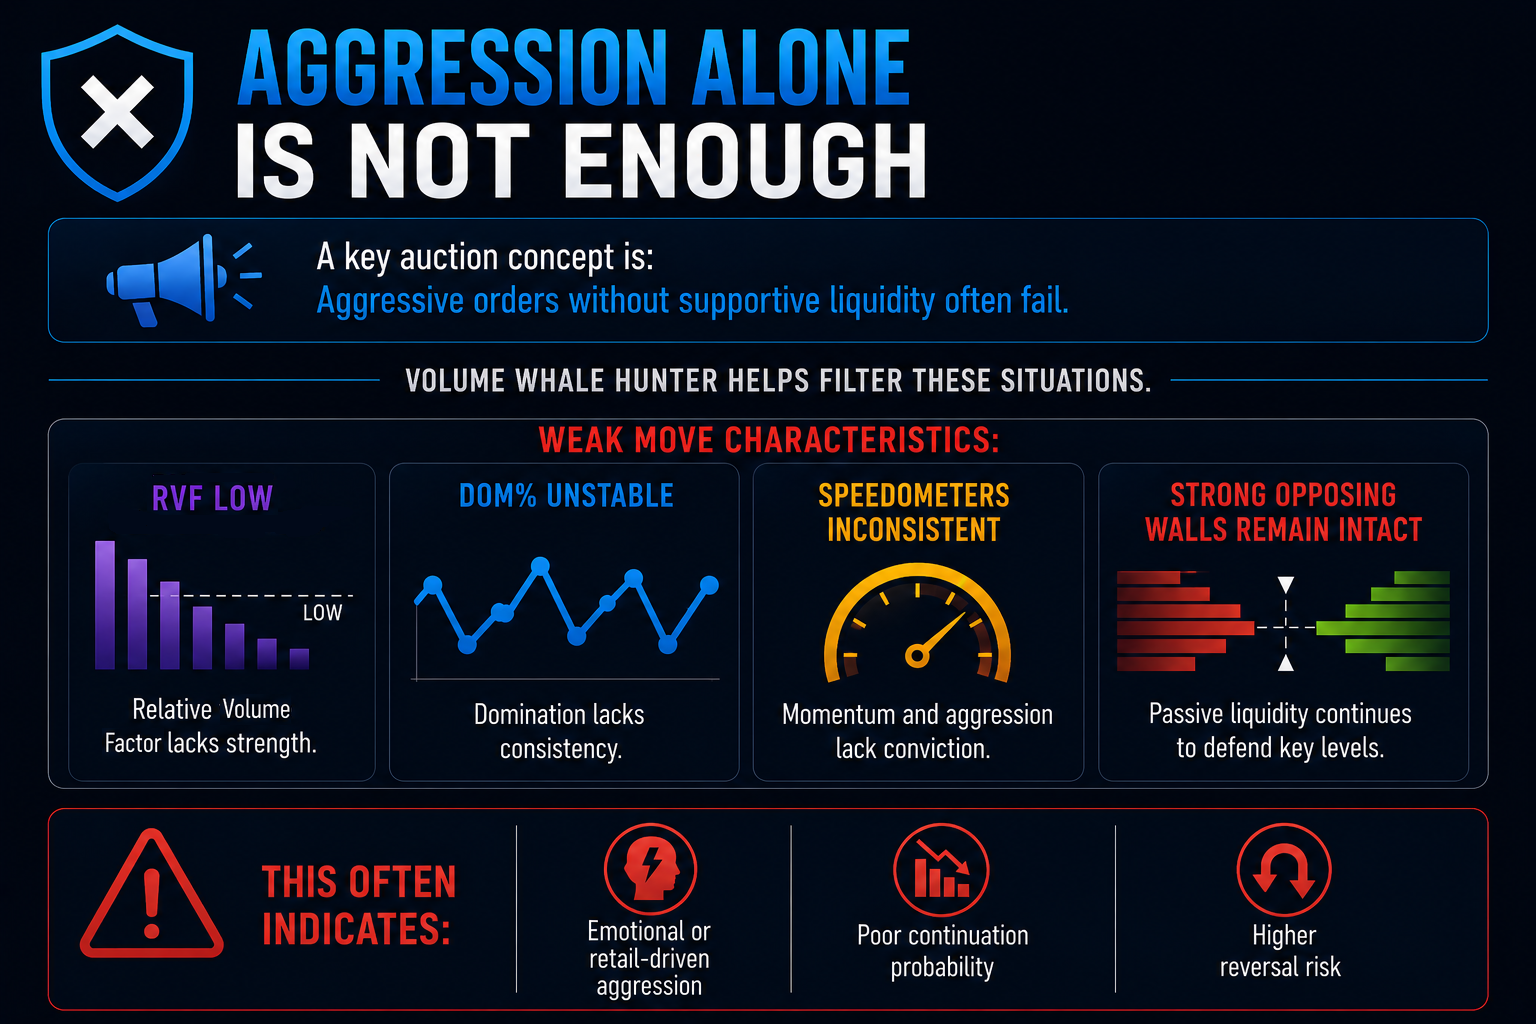
Aggression Alone Is Not Enough
A key auction concept is:
Aggressive orders without supportive liquidity often fail.
Volume Whale Hunter helps filter these situations.
Weak move characteristics:
- RVF low
- DOM% unstable
- Speedometers inconsistent
- Strong opposing walls remain intact
This often indicates:
- Emotional or retail-driven aggression
- Poor continuation probability
- Higher reversal risk
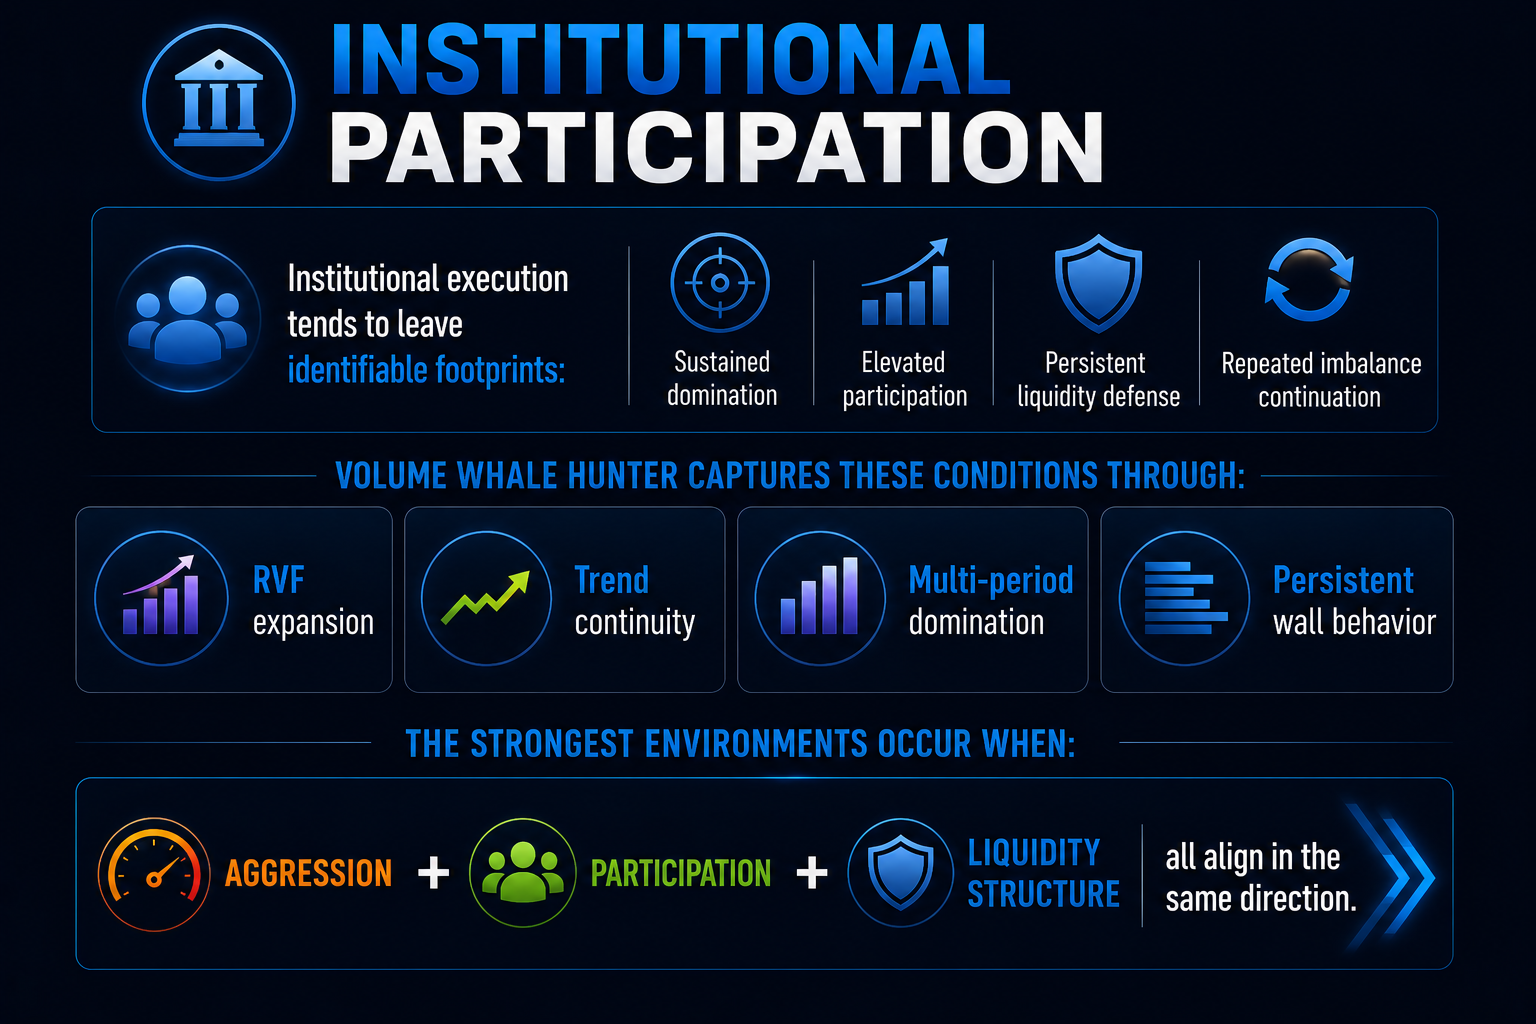
Institutional Participation
Institutional execution tends to leave identifiable footprints:
- Sustained domination
- Elevated participation
- Persistent liquidity defense
- Repeated imbalance continuation
Volume Whale Hunter captures these conditions through:
- RVF expansion
- Trend continuity
- Multi-period domination
- Persistent wall behavior
The strongest environments occur when:
- Aggression
- Participation
- Liquidity structure
all align in the same direction.
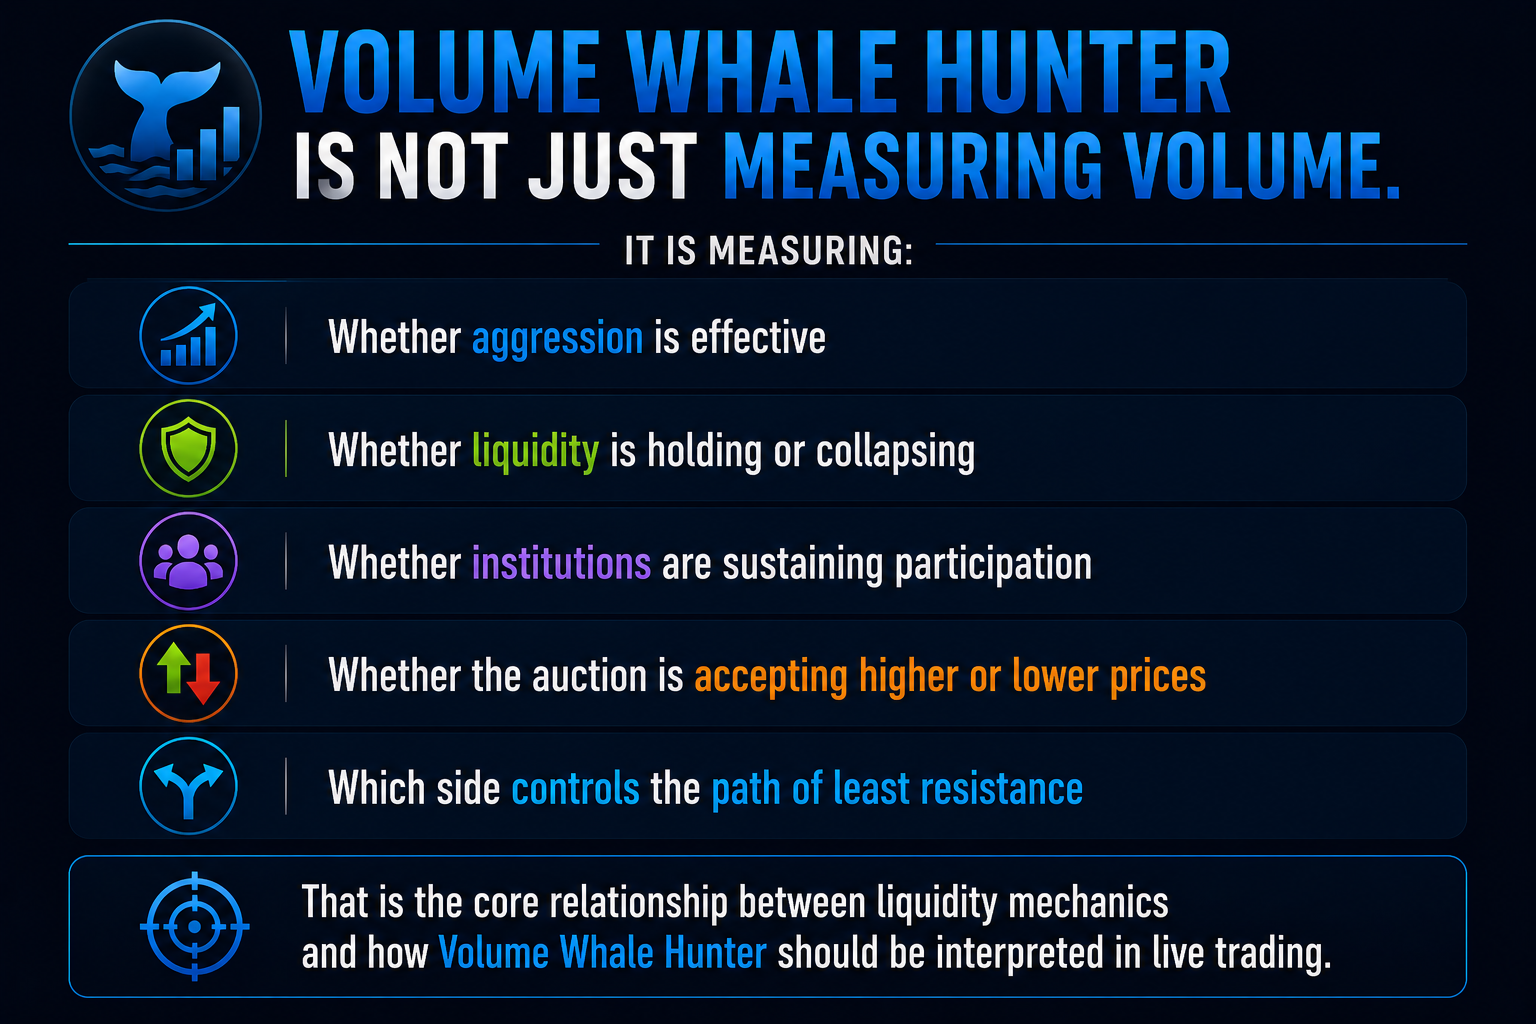
Volume Whale Hunter is not just measuring volume.
It is measuring:
- Whether aggression is effective
- Whether liquidity is holding or collapsing
- Whether institutions are sustaining participation
- Whether the auction is accepting higher or lower prices
- Which side controls the path of least resistance
That is the core relationship between liquidity mechanics and how Volume Whale Hunter should be interpreted in live trading.