SPX Direction Squeeze Trigger
Contact customer support at support@spxdirection.com to get access to all Tradingview indicators.
TradingView link: https://www.tradingview.com/script/5tzxgACg-SPX-Direction-Squeeze-Trigger
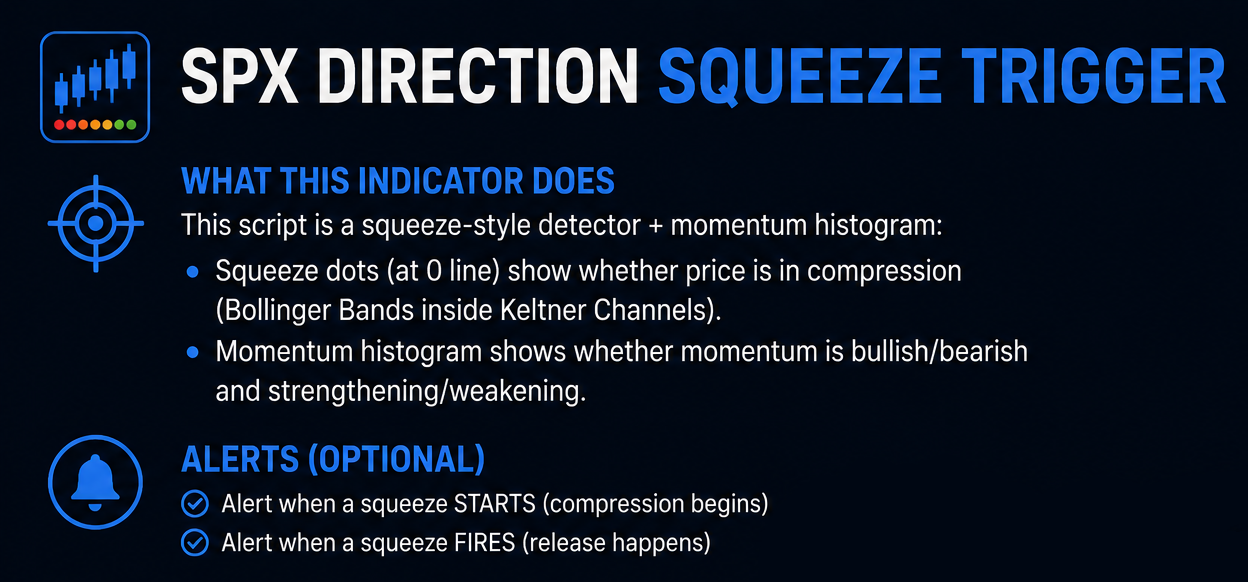
What this indicator does
This script is a squeeze-style detector + momentum histogram:
Squeeze dots (at 0 line) show whether price is in compression (Bollinger Bands inside Keltner Channels).
Momentum histogram shows whether momentum is bullish/bearish and strengthening/weakening.
Optional alerts fire when a squeeze starts and when it fires (release).
2) Settings you can change (and what they mean)
A) “Squeeze Length” (default 20)
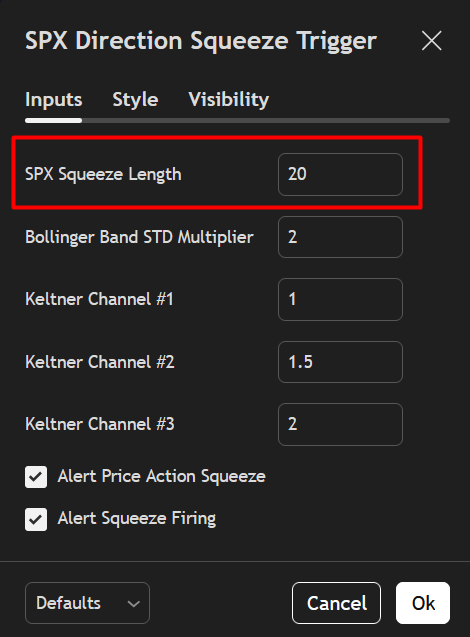
Controls the lookback period for bands, channels, and momentum.
Shorter = more signals, noisier.
Longer = fewer signals, smoother.
B) Bollinger Band STD Multiplier (default 2.0)
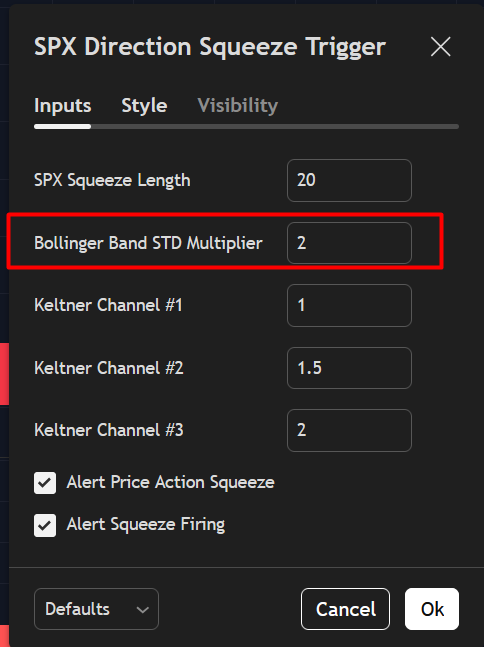
Higher = wider Bollinger Bands = fewer squeeze conditions.
Lower = tighter bands = more squeeze conditions.
C) Keltner Channels (#1, #2, #3)
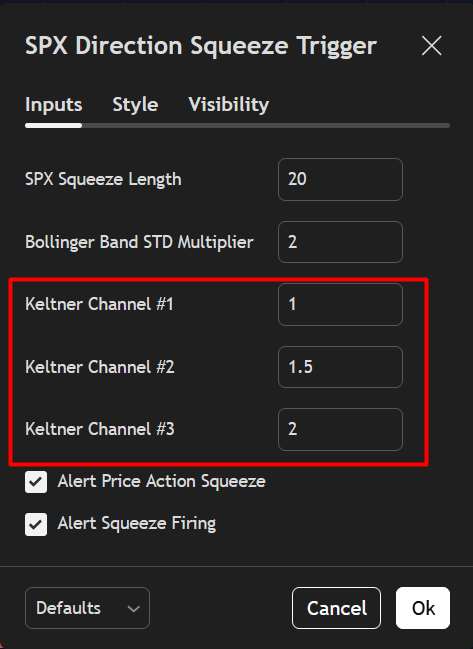
These are 3 KC widths:
#1 = tightest
#2 = medium
#3 = widest
They affect how strict the “compression” is.
D) Alerts toggles
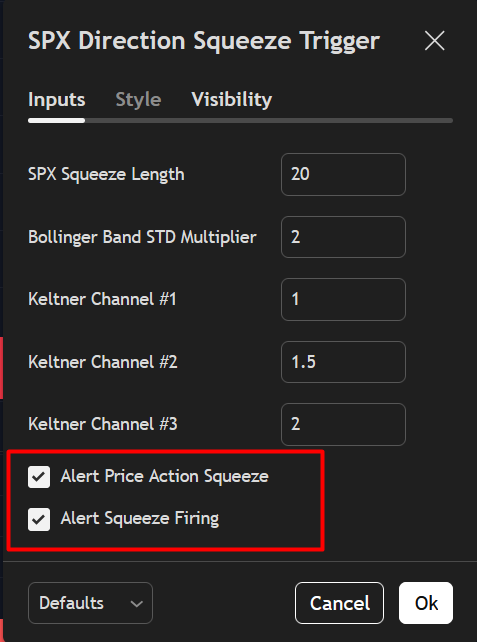
Alert Price Action Squeeze = enables “Squeeze Started”
Alert Squeeze Firing = enables “Squeeze Fired”
3) How to read the indicator
A) Squeeze dots on the zero line
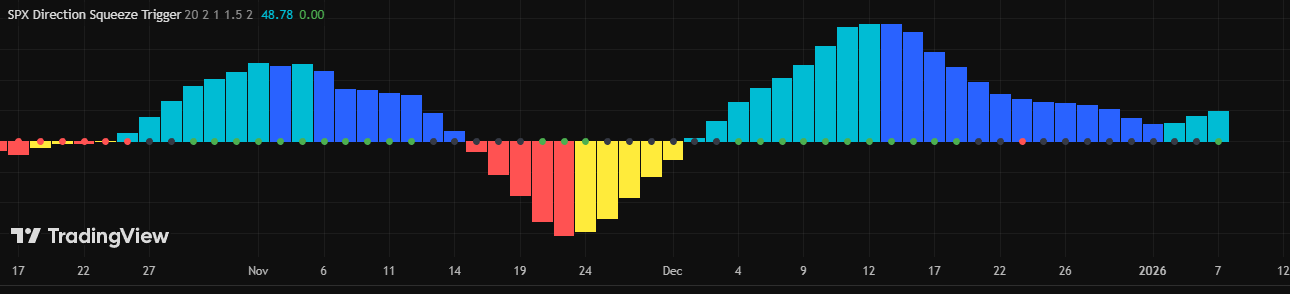
The dot color tells you compression level:
Green dot = No squeeze (price is not compressed)
Black dot = Low compression
Red dot = Mid compression
Orange dot = High compression
General idea:
Black/Red/Orange = energy “building”
When it flips back to Green, the squeeze is considered “released / fired”
B) Momentum histogram (bars)
Above 0 = bullish momentum bias
Below 0 = bearish momentum bias
Color logic:
Aqua = momentum is positive and increasing
Blue = momentum is positive but decreasing
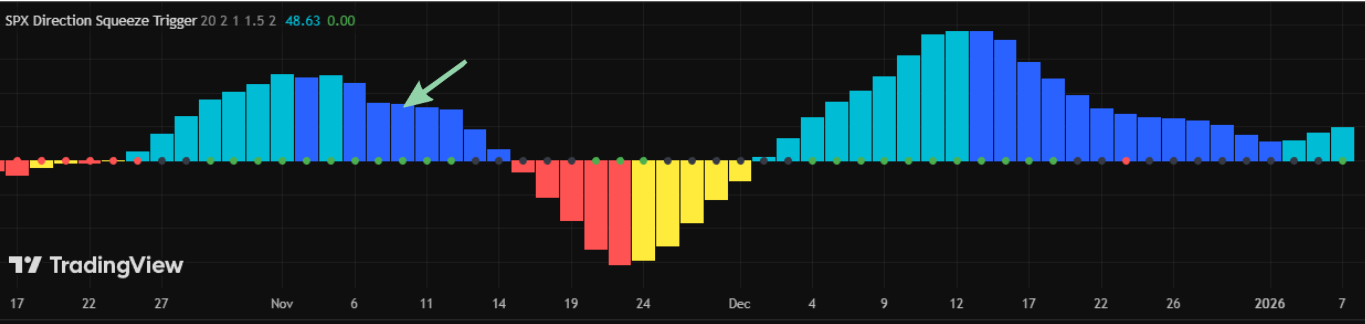
Red = momentum is negative and getting more negative

Yellow = momentum is negative but improving (less negative)

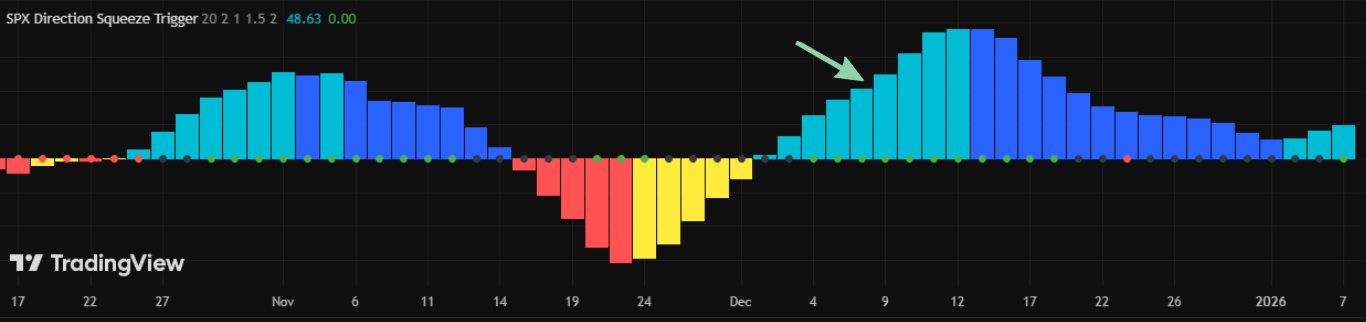
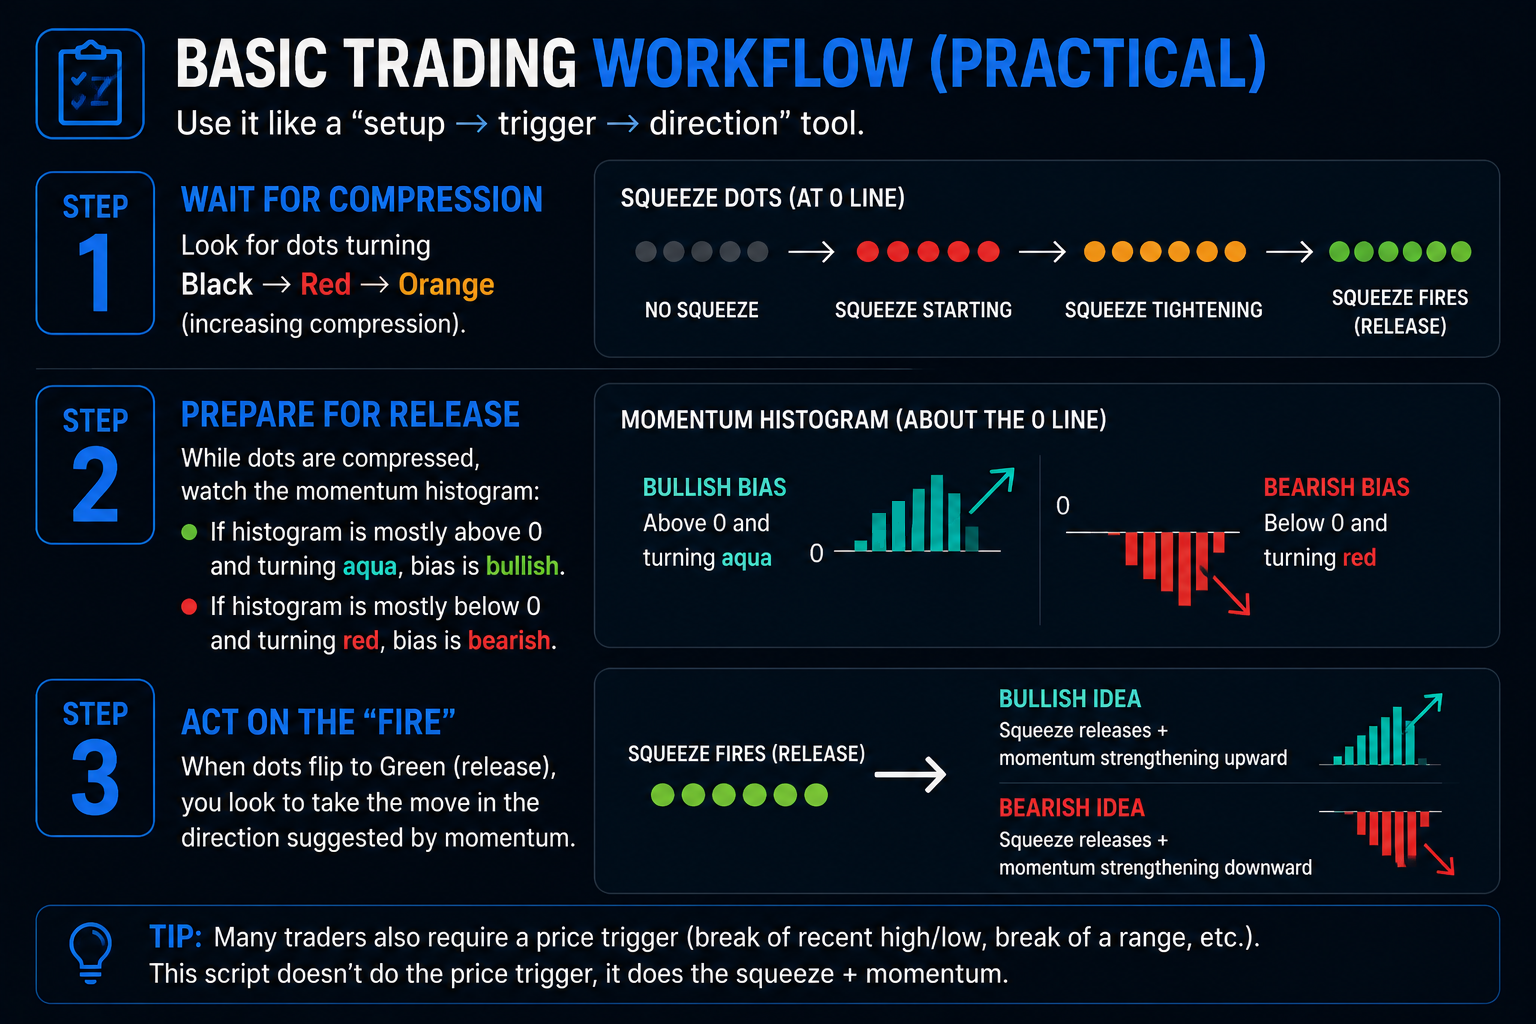
4) Basic trading workflow (practical)
Use it like a “setup → trigger → direction” tool.
Step 1: Wait for compression
Look for dots turning Black → Red → Orange (increasing compression).
Step 2: Prepare for release
While dots are compressed, watch the momentum histogram:
If histogram is mostly above 0 and turning aqua, bias is bullish.
If histogram is mostly below 0 and turning red, bias is bearish.
Step 3: Act on the “fire”
When dots flip to Green (release), you look to take the move in the direction suggested by momentum.
Bullish idea: squeeze releases + momentum strengthening upward
Bearish idea: squeeze releases + momentum strengthening downward
Tip: Many traders also require a price trigger (break of recent high/low, break of a range, etc.). This script doesn’t do the price trigger, it does the squeeze + momentum.
5) Alerts setup (important)
Your code uses alert("..."), so you must create an alert that listens to this indicator.
On the chart, click Alerts (clock icon) → Create Alert
In Condition, choose: SPX Direction Squeeze Trigger (this script)
For “Alert actions”, choose popup/webhook/email as needed
Set Options:
Typically: Once Per Bar Close (recommended to avoid spam)
Create it.
What alerts mean
“Squeeze Started”
Means the prior bar was green (no squeeze) and now you entered compression.
“Squeeze Fired”
Means the prior bar was compression and now you are green (no squeeze) again (release).
6) Best timeframes (quick guidance)
For SPX/SPY/ES:
5m–15m: more signals, good for intraday
1h–4h: cleaner swings
Daily: longer setups, fewer but stronger signals