SPX Direction ES Daily 10:00 AM Signal
Contact customer support at support@spxdirection.com
Overview
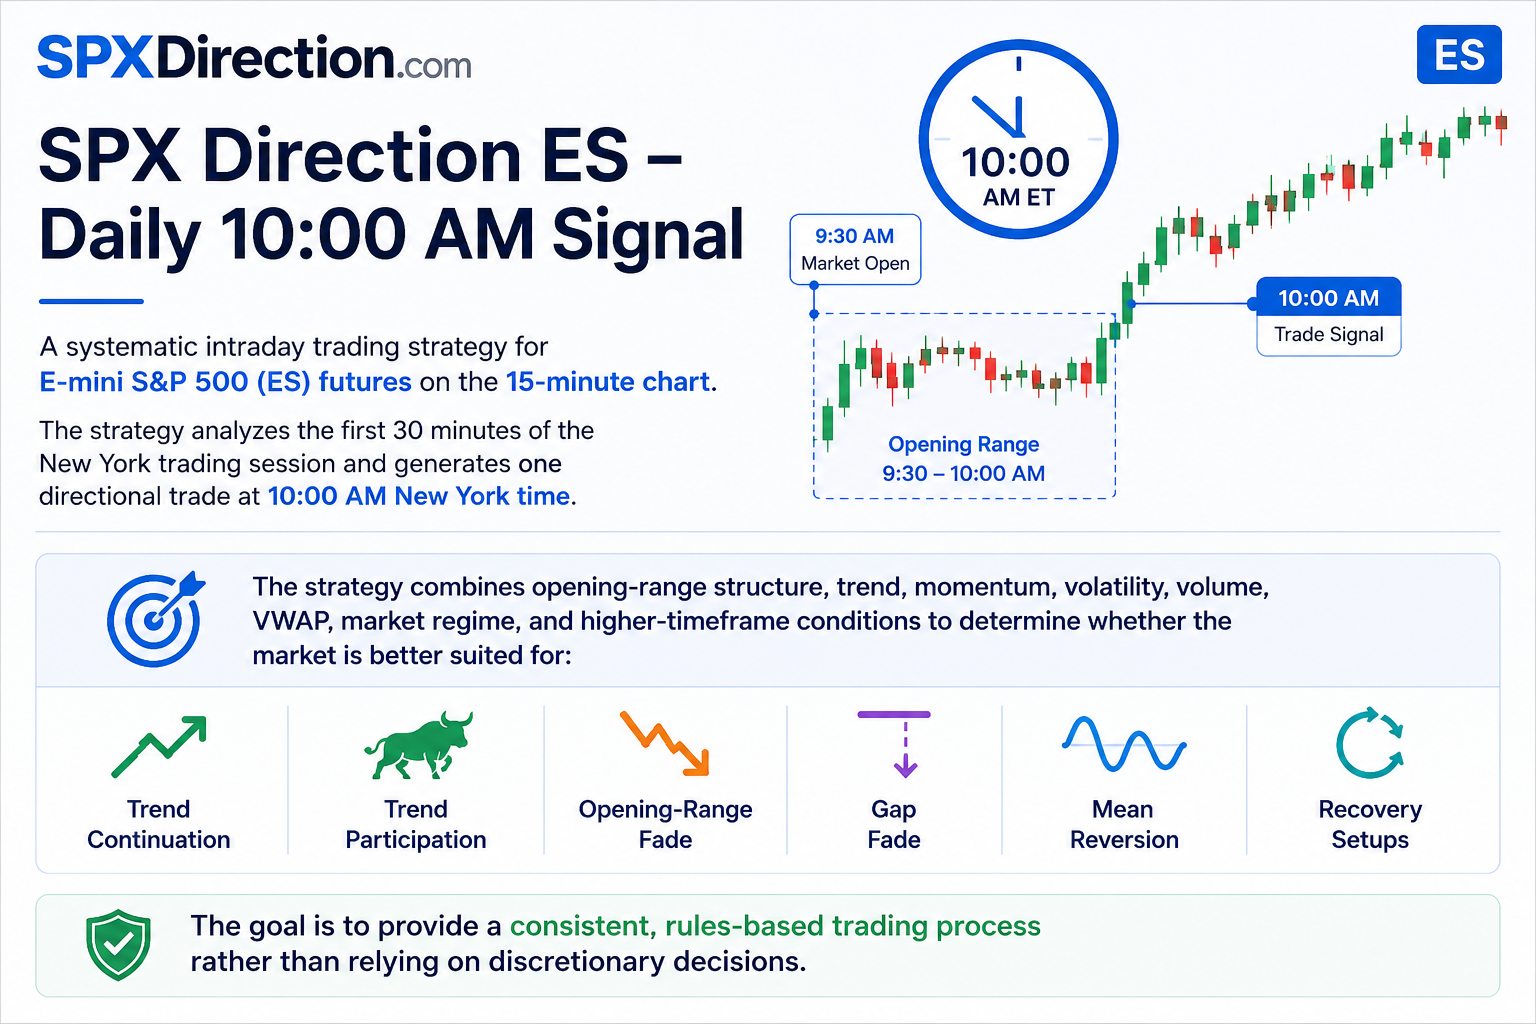
The SPX Direction ES – Daily 10:00 AM Signal is a systematic intraday trading strategy designed specifically for E-mini S&P 500 (ES) futures on the 15-minute chart.
The strategy analyzes the first 30 minutes of the New York trading session and generates one directional trade at 10:00 AM New York time.
It combines opening-range structure, trend, momentum, volatility, volume, VWAP, market regime, and higher-timeframe conditions to determine whether the market is better suited for:
- Trend continuation
- Trend participation
- Opening-range fade
- Gap fade
- Mean reversion
- Recovery setups
The goal is to provide a consistent, rules-based trading process rather than relying on discretionary decisions.
How It Works
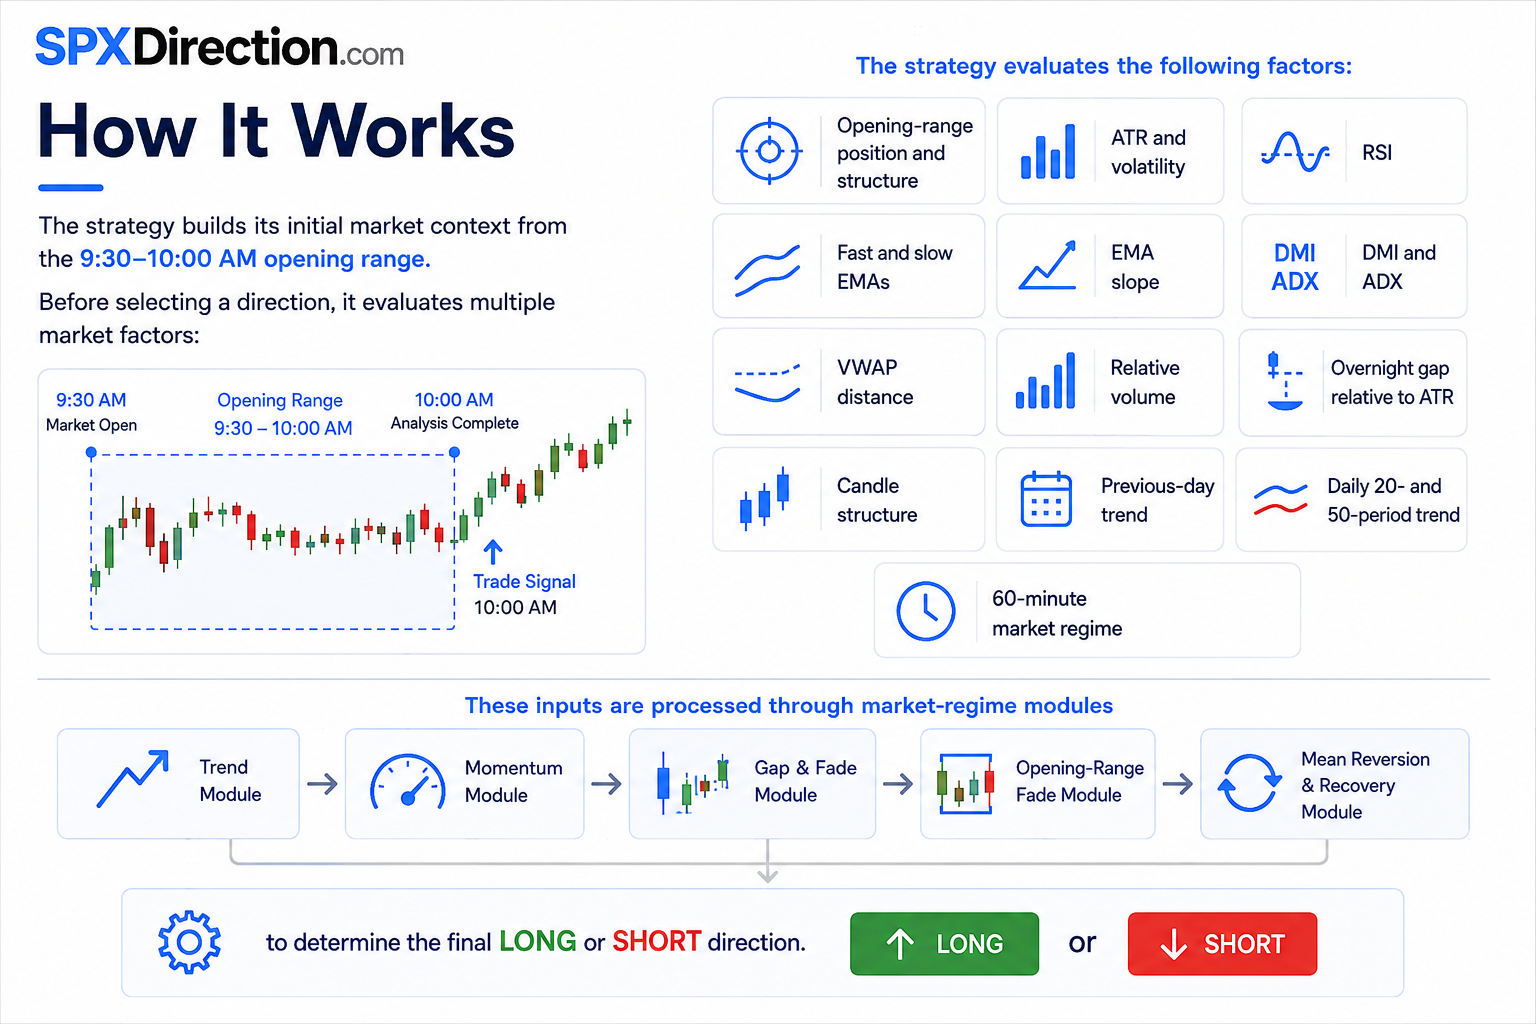
The strategy builds its initial market context from the 9:30–10:00 AM opening range.
Before selecting a direction, it evaluates:
- Opening-range position and structure
- ATR and volatility
- RSI
- Fast and slow EMAs
- EMA slope
- DMI and ADX
- VWAP distance
- Relative volume
- Overnight gap relative to ATR
- Candle structure
- Previous-day trend
- Daily 20- and 50-period trend
- 60-minute market regime
These inputs are processed through several market-regime modules to determine the final LONG or SHORT direction.
Trading Schedule
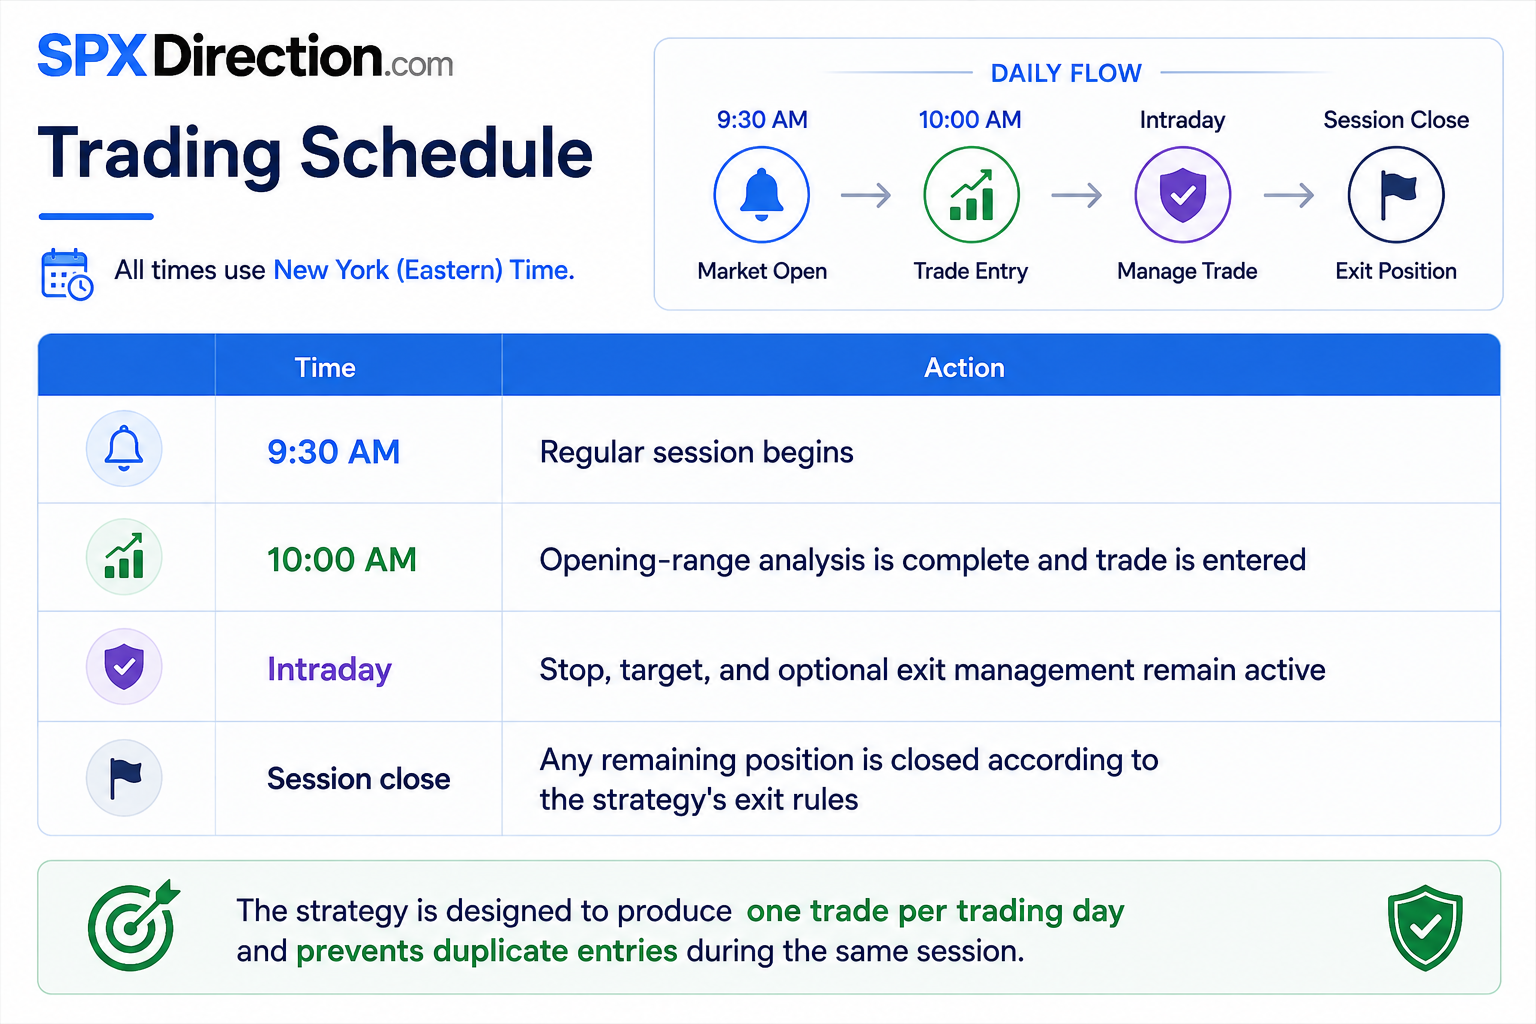
All times use New York (Eastern) Time.
|
|
|
|
|
|
|
|
|
|
|
|
|
|
|
The strategy is designed to produce one trade per trading day and prevents duplicate entries during the same session.
Market Regime Analysis
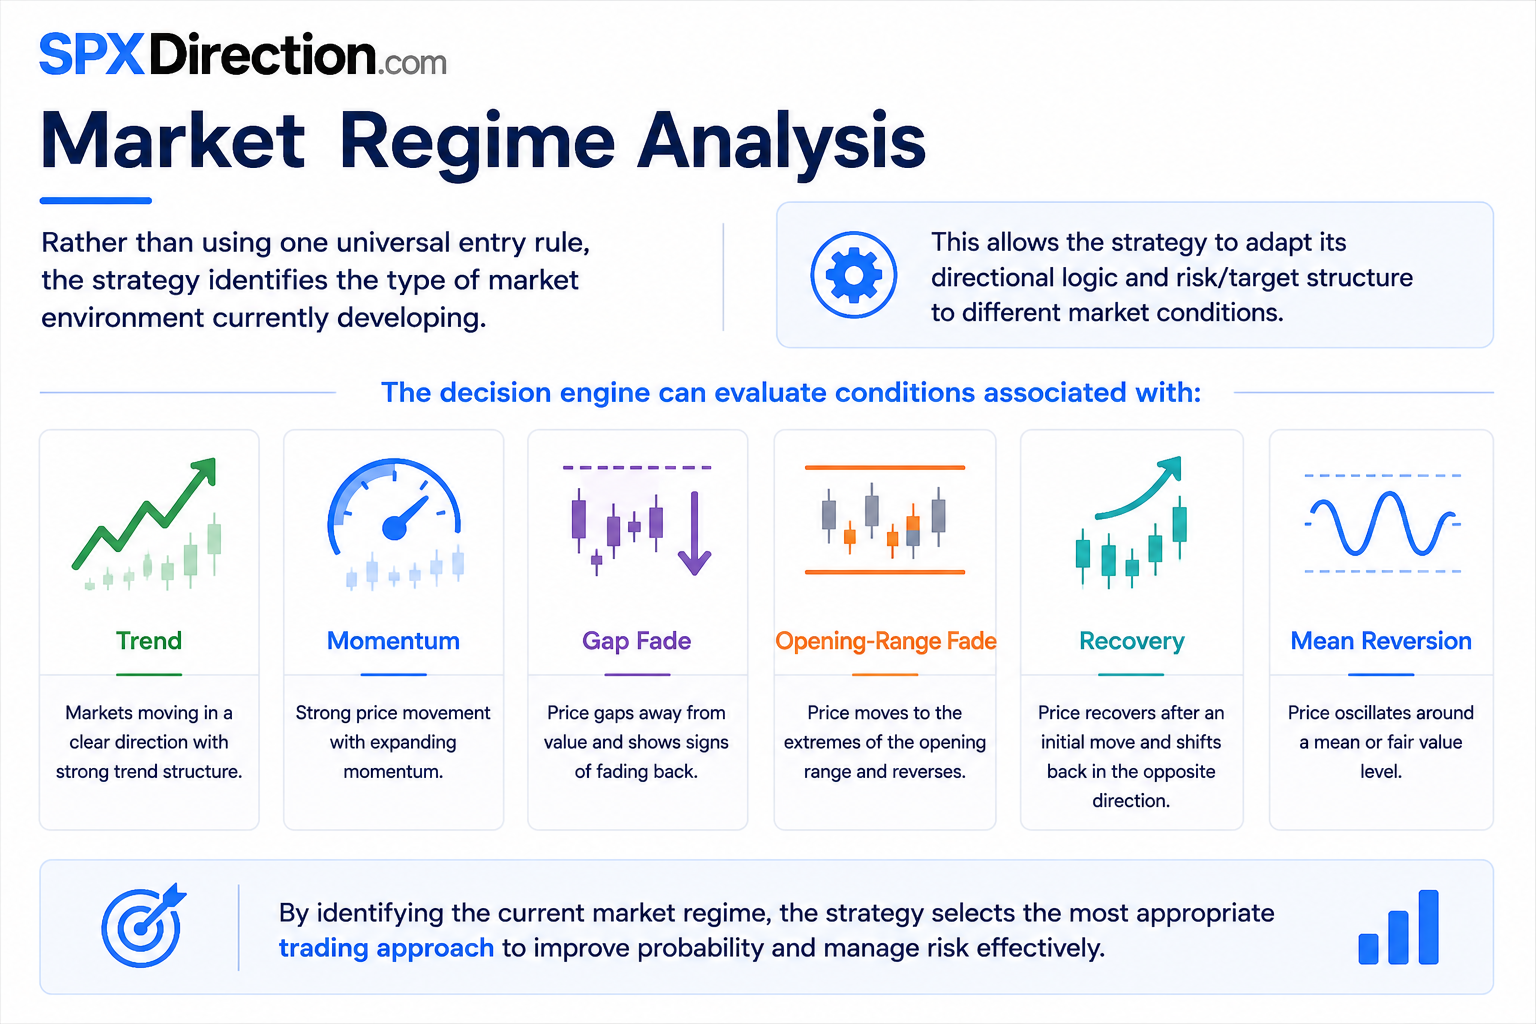
Rather than using one universal entry rule, the strategy identifies the type of market environment currently developing.
The decision engine can evaluate conditions associated with:
- Trend
- Momentum
- Gap Fade
- Opening-Range Fade
- Recovery
- Mean Reversion
This allows the strategy to adapt its directional logic and risk/target structure to different market conditions.
Trade Quality
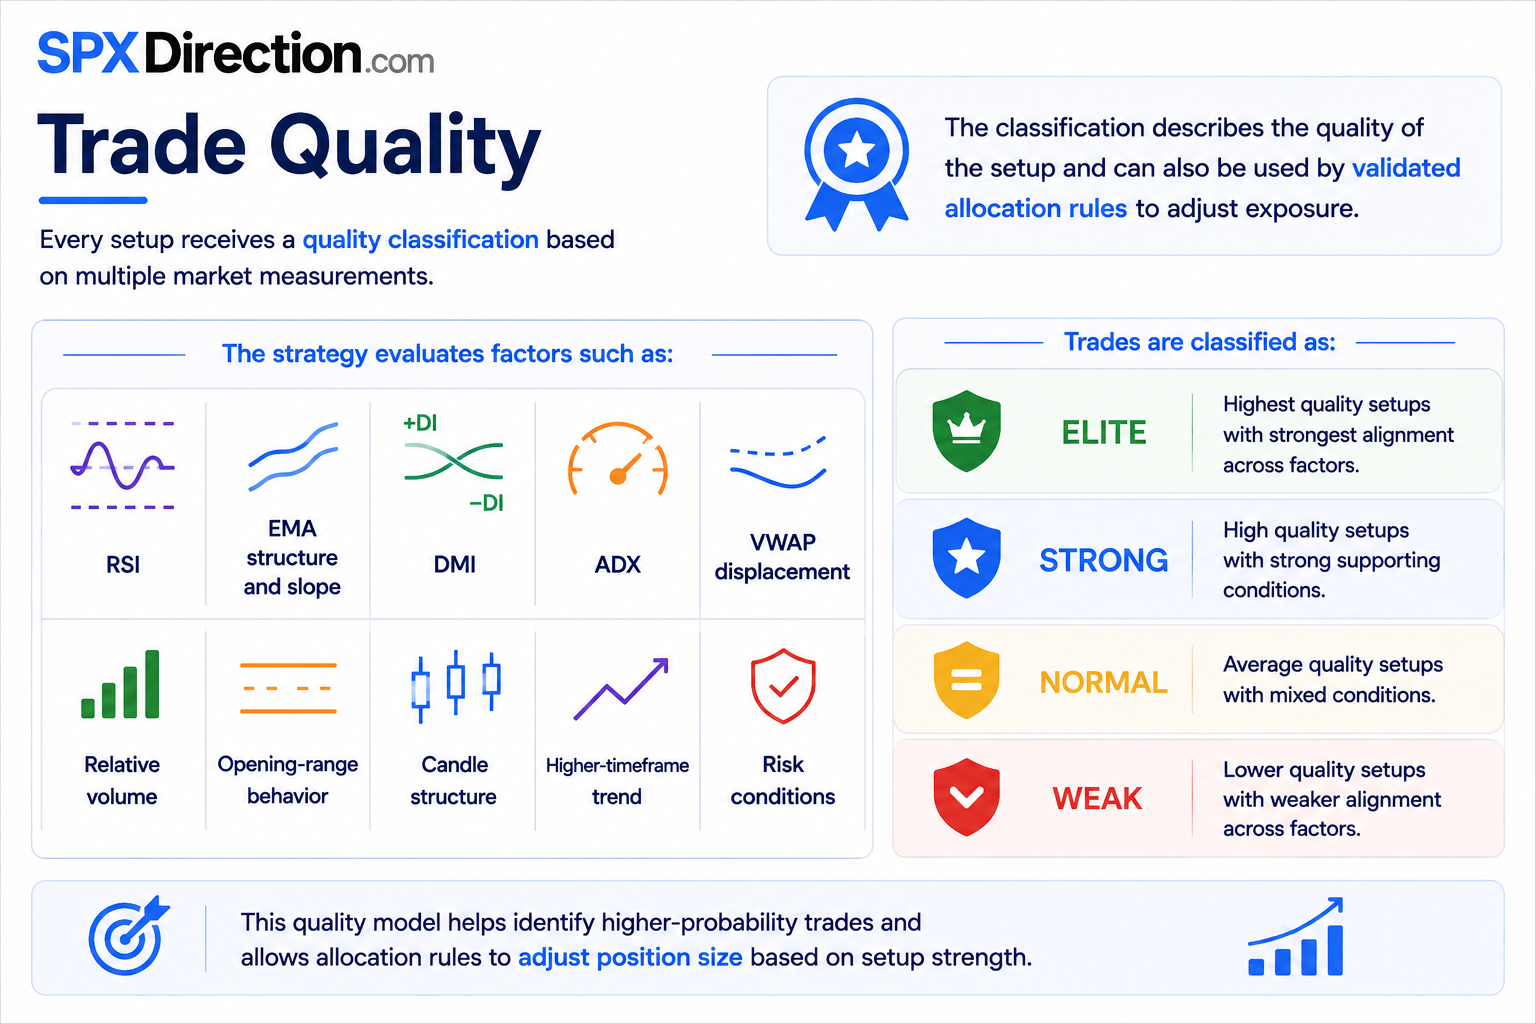
Every setup receives a quality classification based on multiple market measurements.
The strategy evaluates factors such as:
- RSI
- EMA structure and slope
- DMI
- ADX
- VWAP displacement
- Relative volume
- Opening-range behavior
- Candle structure
- Higher-timeframe trend
- Risk conditions
Trades are classified as:
- ELITE
- STRONG
- NORMAL
- WEAK
The classification describes the quality of the setup and can also be used by validated allocation rules to adjust exposure.
Risk & Target Management
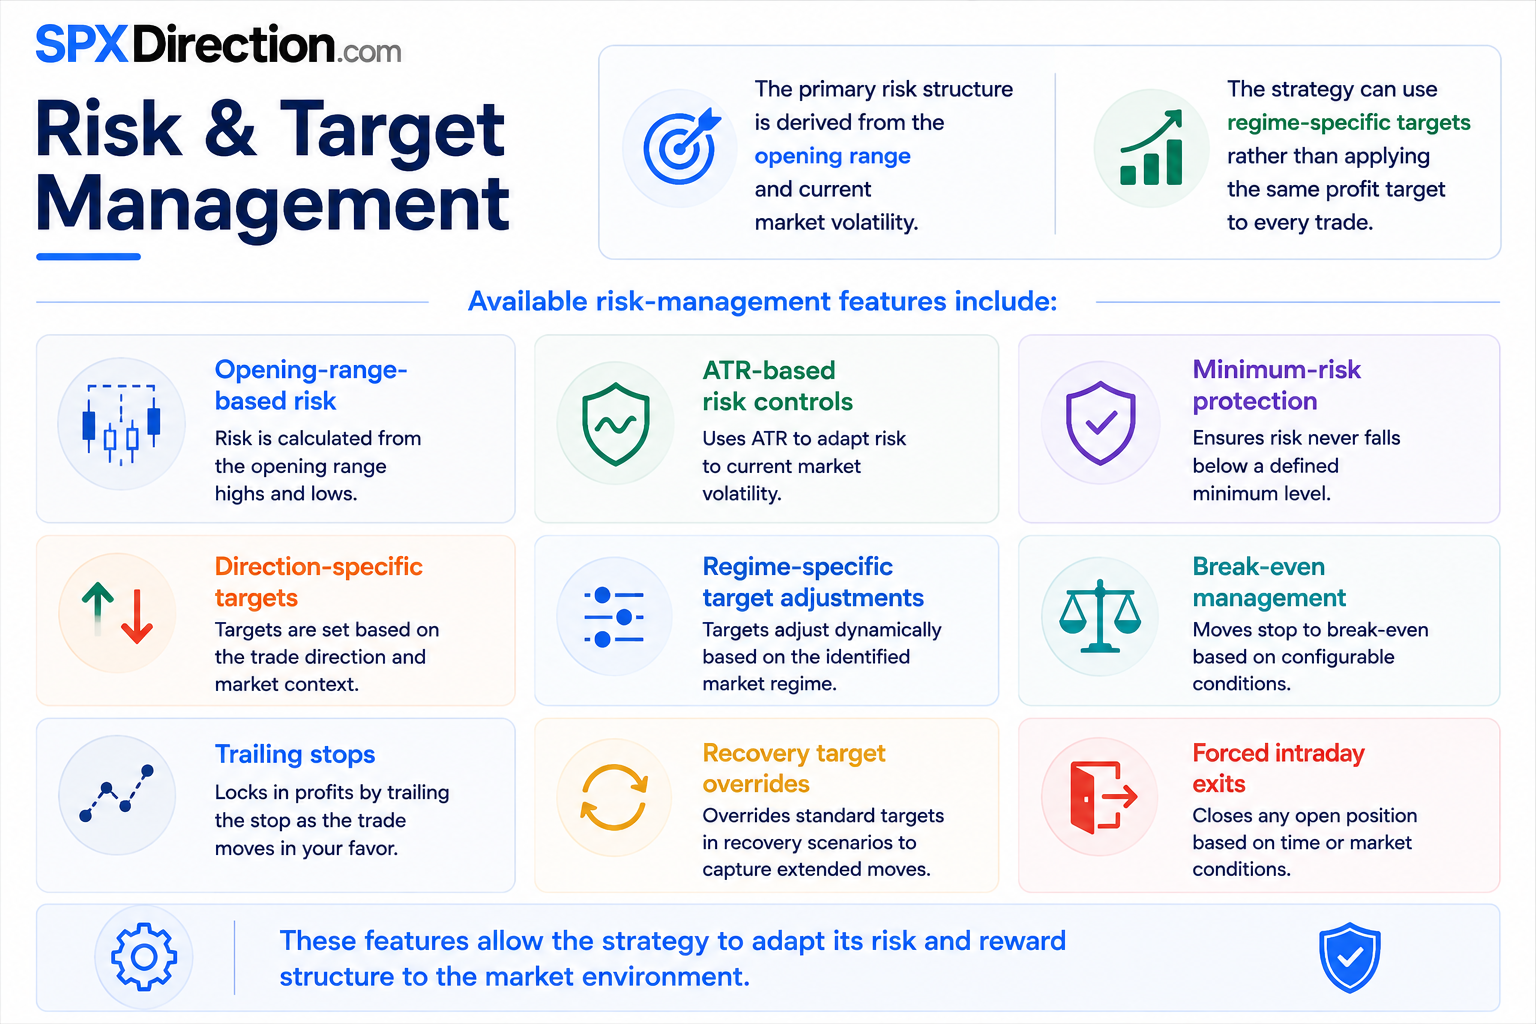
The primary risk structure is derived from the opening range and current market volatility.
The strategy can use regime-specific targets rather than applying the same profit target to every trade.
Available risk-management features include:
- Opening-range-based risk
- ATR-based risk controls
- Minimum-risk protection
- Direction-specific targets
- Regime-specific target adjustments
- Break-even management
- Trailing stops
- Recovery target overrides
- Forced intraday exits
These features allow the strategy to adapt its risk and reward structure to the market environment.
Historical Performance
The strategy has been developed through multiple generations of historical testing and regime analysis.
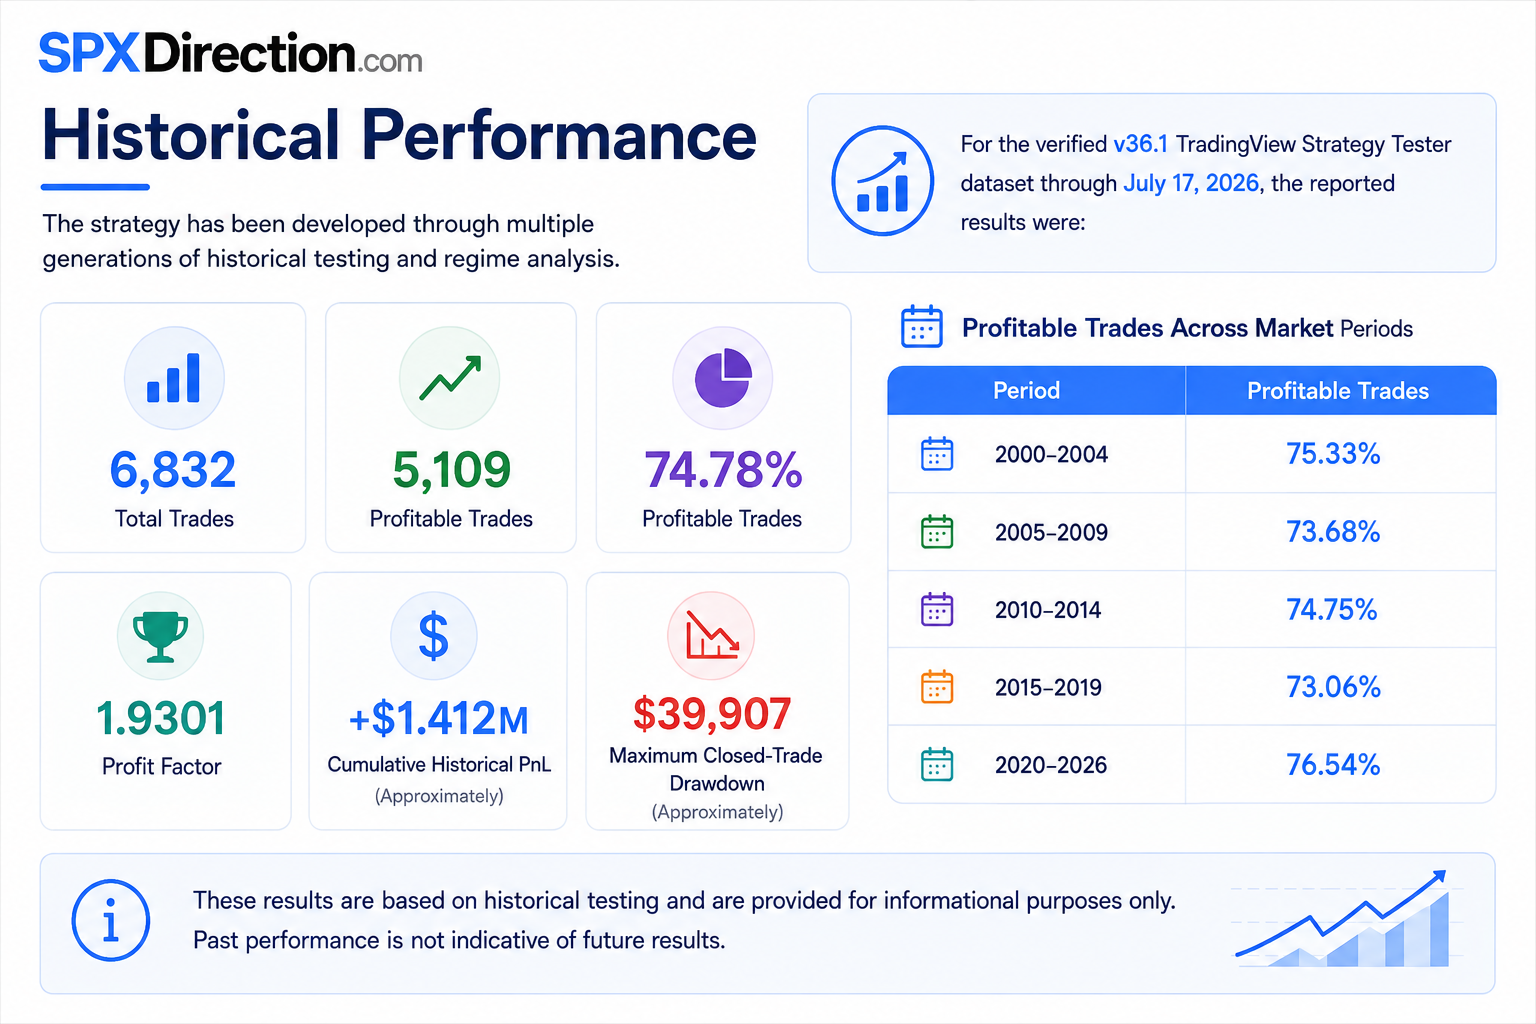
For the verified v36.1 TradingView Strategy Tester dataset through July 17, 2026, the reported results were:
- 6,832 trades
- 5,109 profitable trades
- 74.78% profitable
- 1.9301 profit factor
- Approximately +$1.412 million cumulative historical PnL
- Approximately $39,907 maximum closed-trade drawdown
Historical profitable-trade rates were also reviewed across different market periods:
|
|
|
|
|
|
|
|
|
|
|
|
|
|
|
|
|
|
Expanded Regime Recovery Version
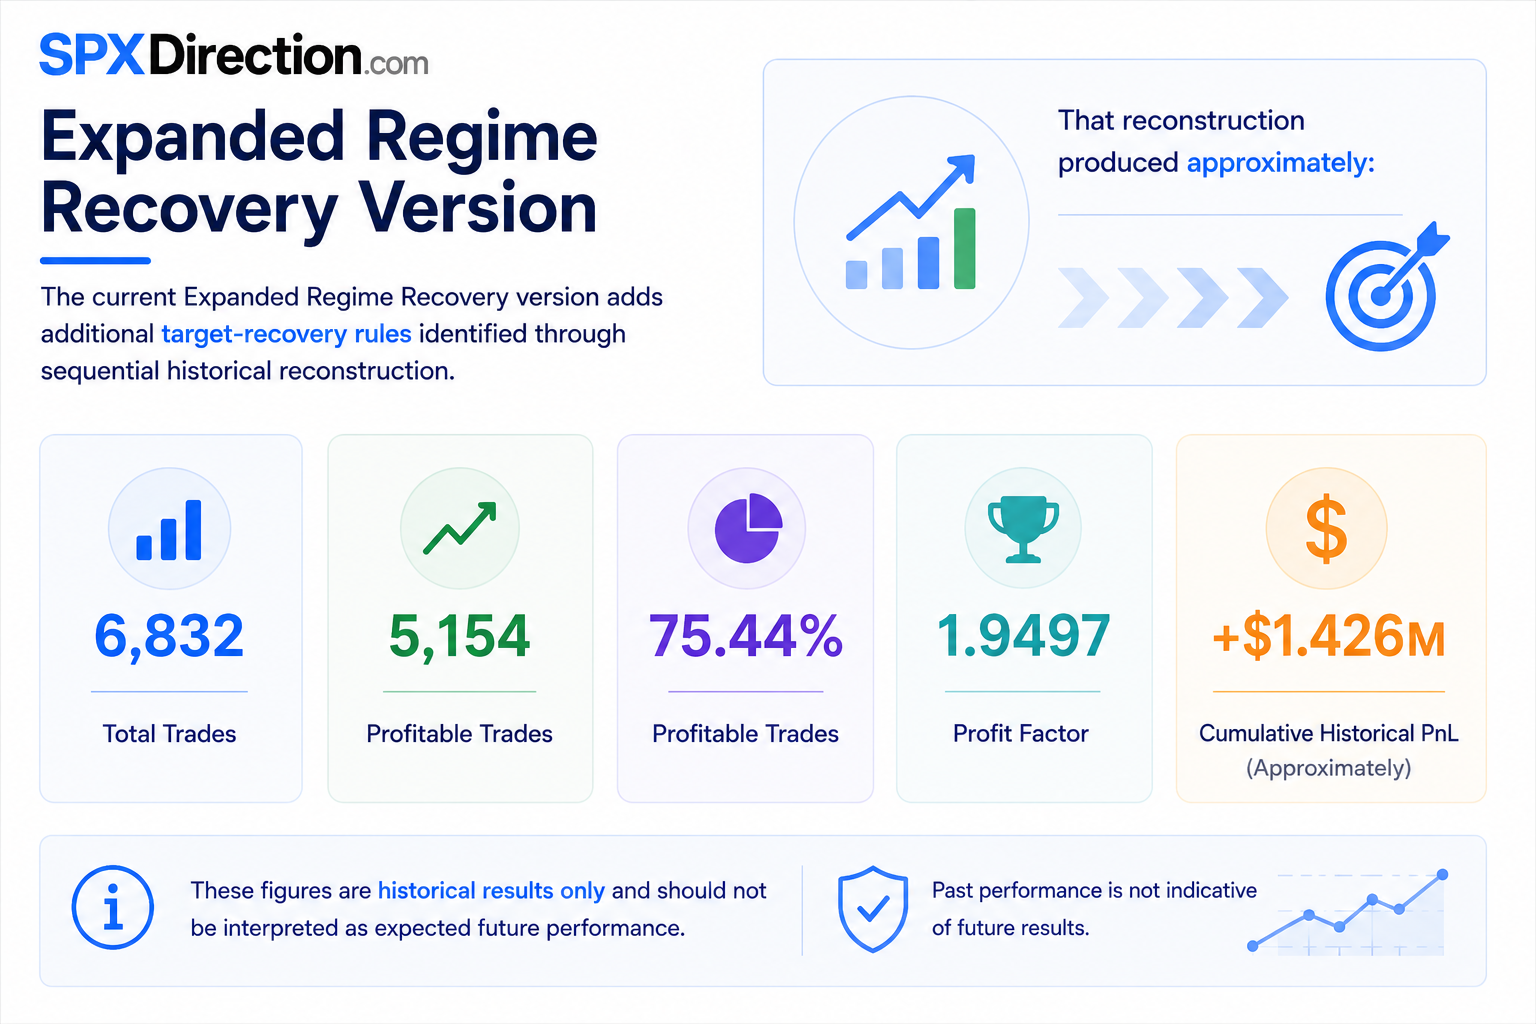
The current Expanded Regime Recovery version adds additional target-recovery rules identified through sequential historical reconstruction.
That reconstruction produced approximately:
- 6,832 trades
- 5,154 profitable trades
- 75.44% profitable
- 1.9497 profit factor
- Approximately +$1.426 million cumulative PnL
These figures are historical results only and should not be interpreted as expected future performance.
Recommended Settings
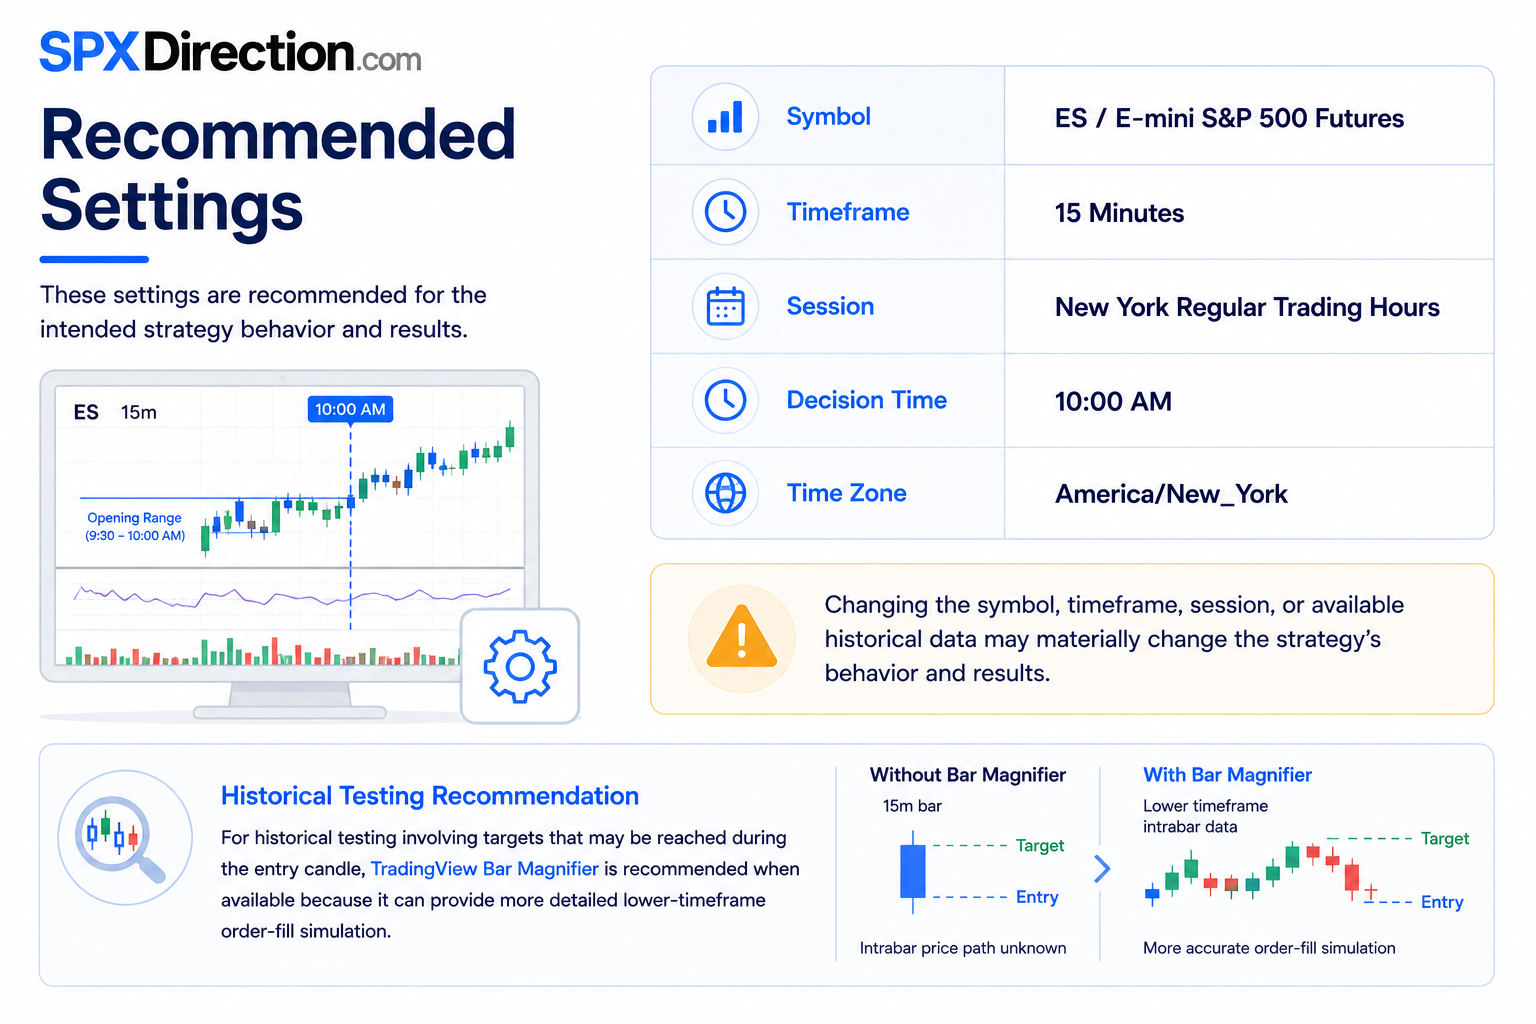
For the intended strategy behavior, use:
- Symbol: ES / E-mini S&P 500 Futures
- Timeframe: 15 Minutes
- Session: New York Regular Trading Hours
- Decision Time: 10:00 AM
- Time Zone: America/New_York
Changing the symbol, timeframe, session, or available historical data may materially change the strategy's behavior and results.
For historical testing involving targets that may be reached during the entry candle, TradingView Bar Magnifier is recommended when available because it can provide more detailed lower-timeframe order-fill simulation.
Important Notes
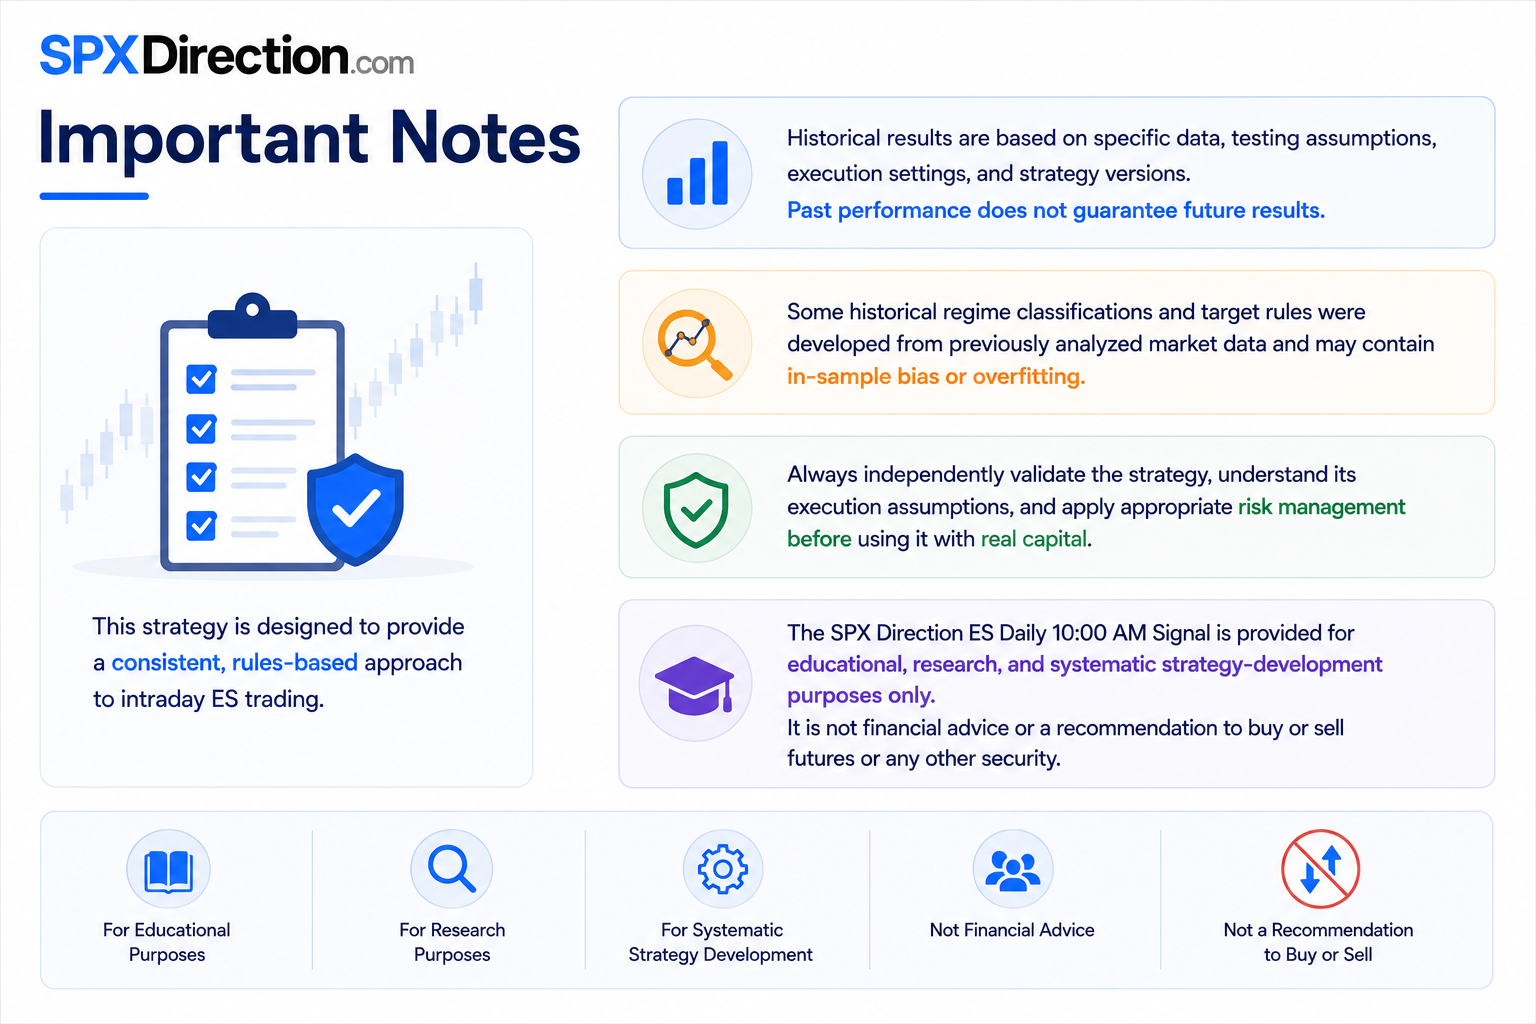
This strategy is designed to provide a consistent, rules-based approach to intraday ES trading.
Historical results are based on specific data, testing assumptions, execution settings, and strategy versions. Past performance does not guarantee future results.
Some historical regime classifications and target rules were developed from previously analyzed market data and may contain in-sample bias or overfitting.
Always independently validate the strategy, understand its execution assumptions, and apply appropriate risk management before using it with real capital.
The SPX Direction ES Daily 10:00 AM Signal is provided for educational, research, and systematic strategy-development purposes only. It is not financial advice or a recommendation to buy or sell futures or any other security.