How SPX Direction Parameters Predict Absorption and Reversals
Contact customer support at support@spxdirection.com
When the SPX direction execution metrics of RVF, MA, ORES, VDI (relative volume factor, momentum acceleration, opening range expansion, VWAP displacement index) are layered onto order flow, you get a far better context for the market and a higher trade success probability.
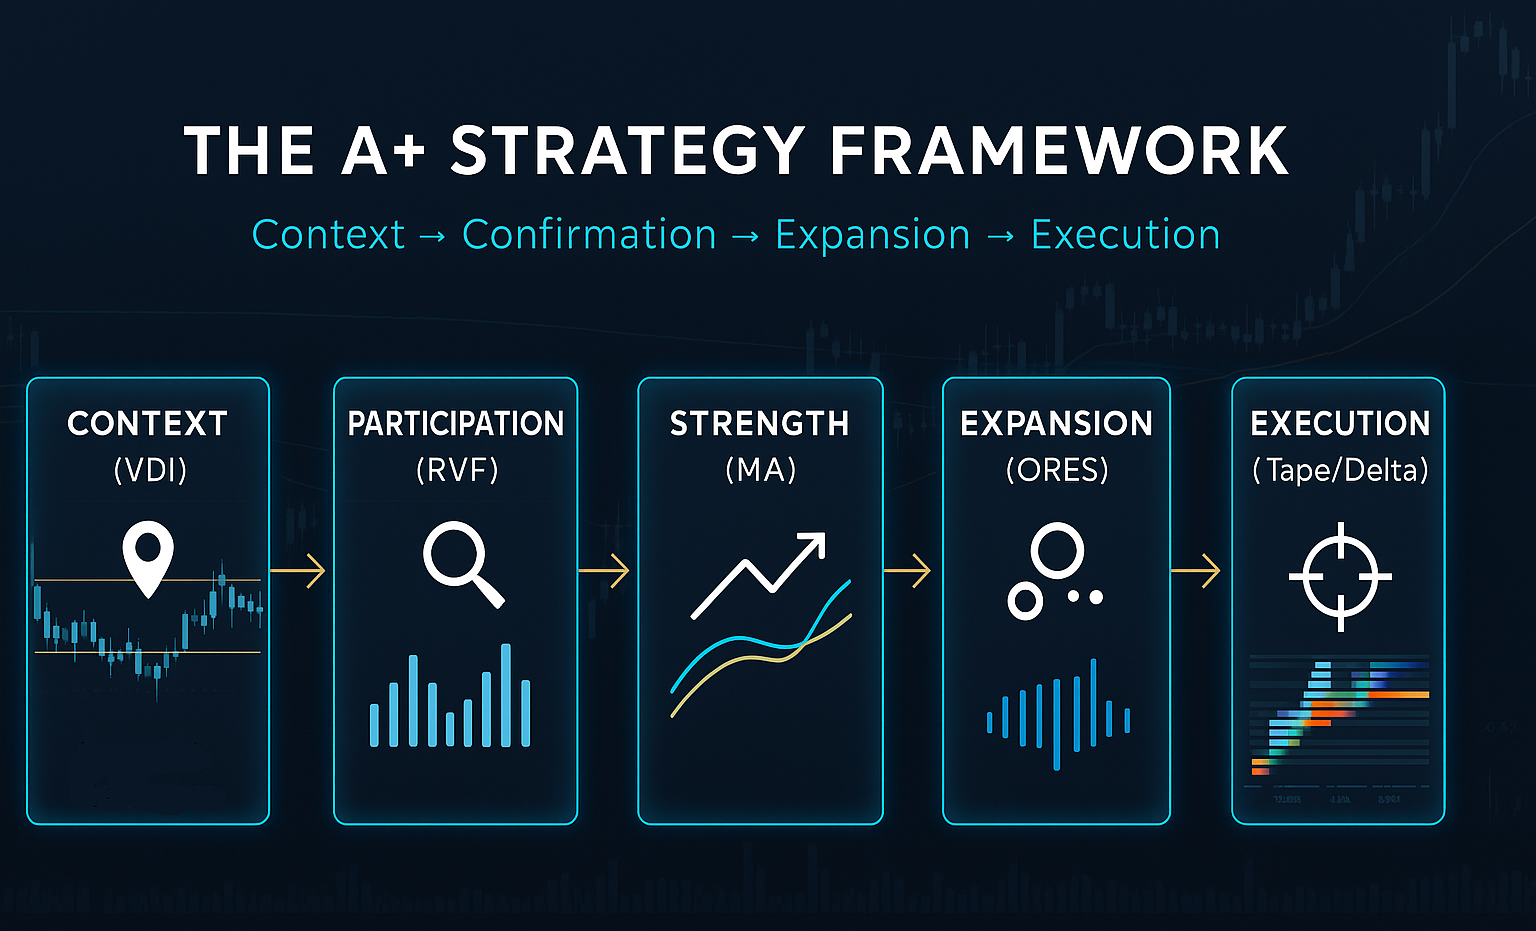
🧠 The Strategy: “Context → Confirmation → Expansion → Execution”
The best way to interpret all our tools is to look at the five key components in the following way:
- Context (Location & Bias) → VDI
- Participation (Is it real?) → RVF
- Strength (Is it accelerating?) → MA
- Expansion (Is it worth trading?) → ORES
- Execution (Order flow trigger) → Tape/Delta
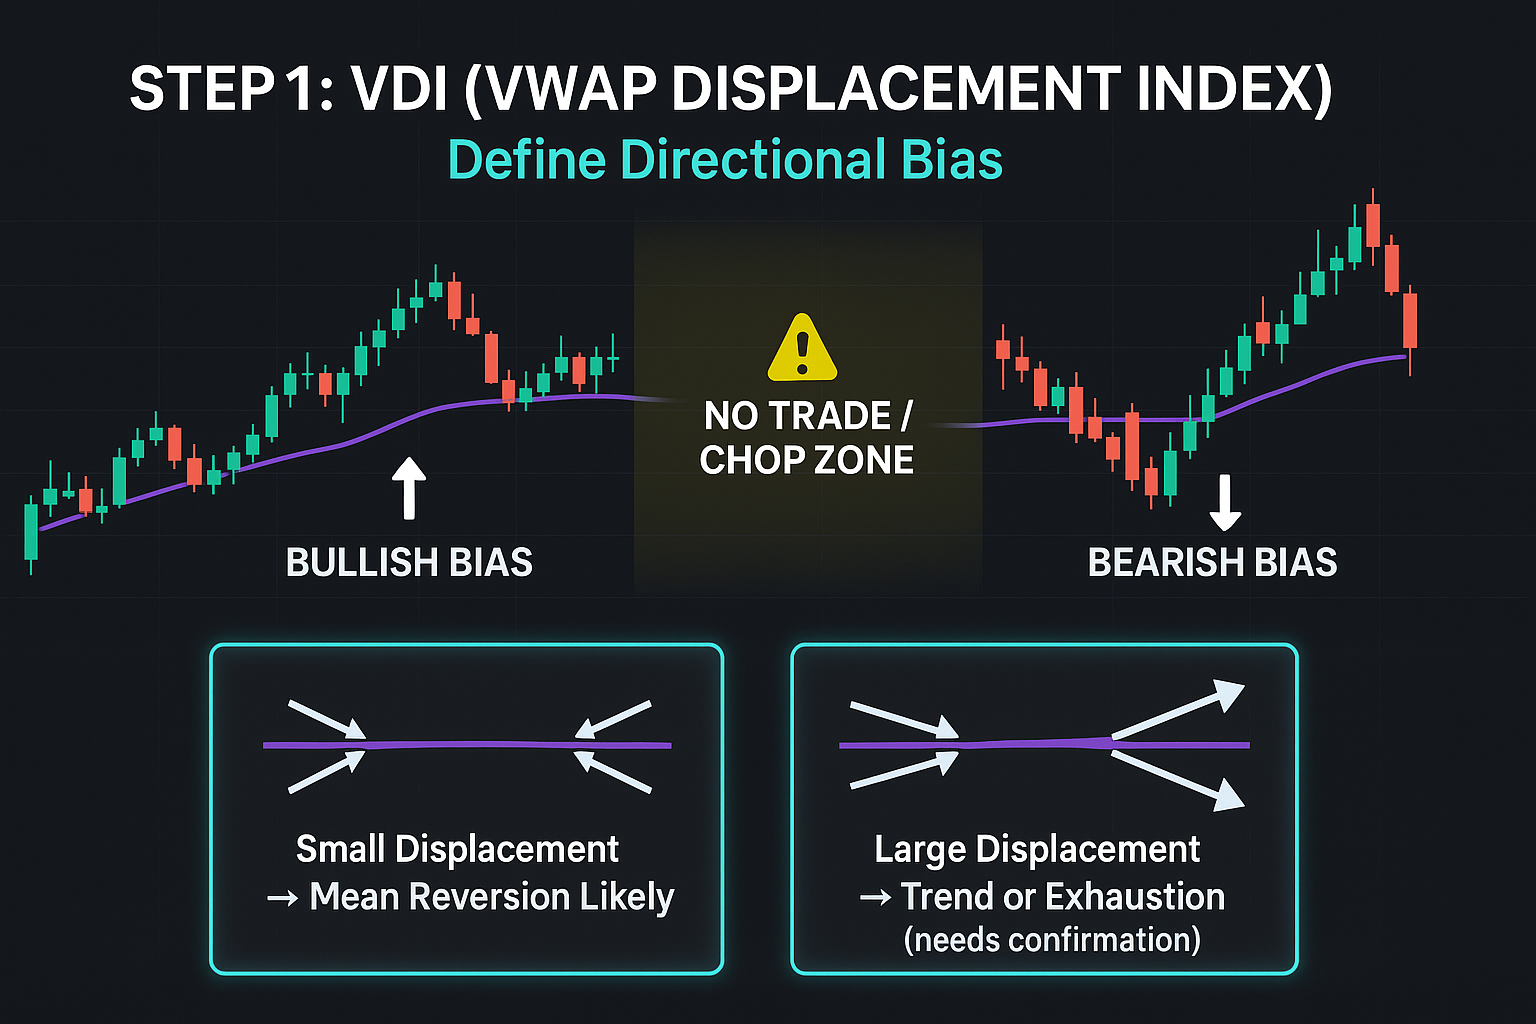
📍 STEP 1 — VDI (VWAP Displacement Index)
Purpose: Define directional bias
Measures how far the current price is from VWAP (fair value).
Rules:
- Above VWAP + expanding away → bullish bias
- Below VWAP + expanding away → bearish bias
- Near VWAP → no trade / chop zone
Interpretation:
- Small displacement → mean reversion likely
- Large displacement → trend or exhaustion (needs confirmation from other parameters and order flow)
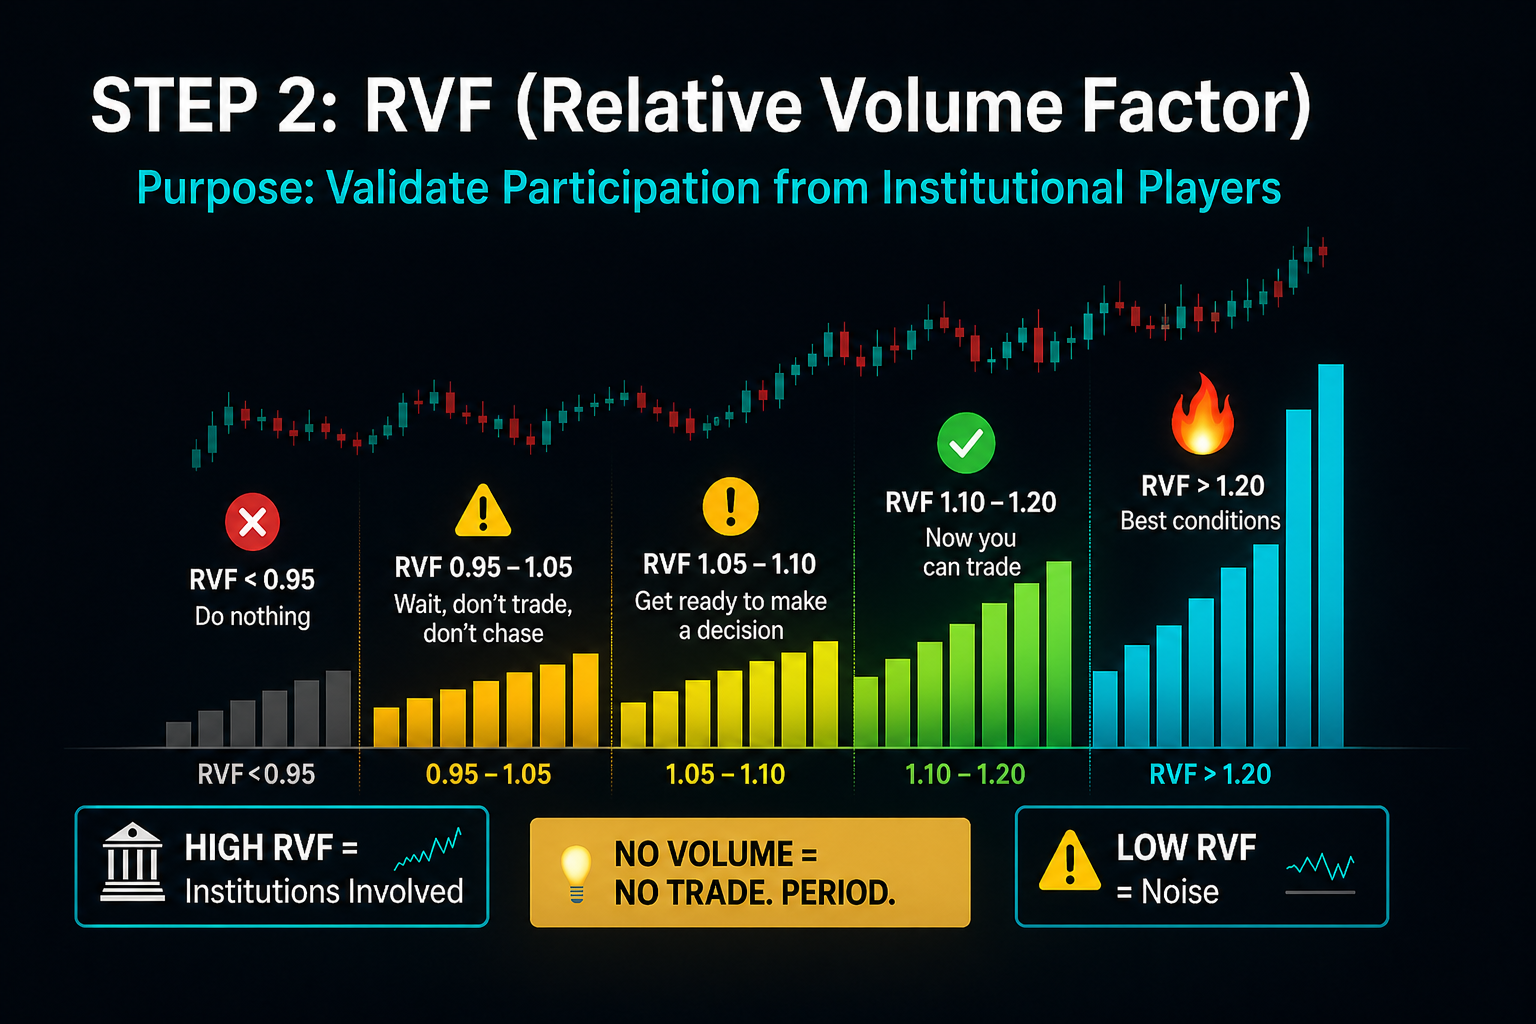
📊 STEP 2 — RVF (Relative Volume Factor)
Purpose: Validate participation from institutional players.
This answers the key question: Is this move backed by unusual volume?
Rules:
- ❌ RVF < 0.95 → Do nothing
- ⚠️ RVF 0.95 – 1.05 → Wait, don’t trade, don’t chase
- ⚠️ RVF 1.05 → 1.10 → Get ready to make a decision
- ✅ RVF 1.10–1.20 → Now you can trade
- 🔥 RVF > 1.20 → Best conditions
Key Insight:
- High RVF = institutions likely involved
- Low RVF = noise
💡 No volume = no trade. Period.
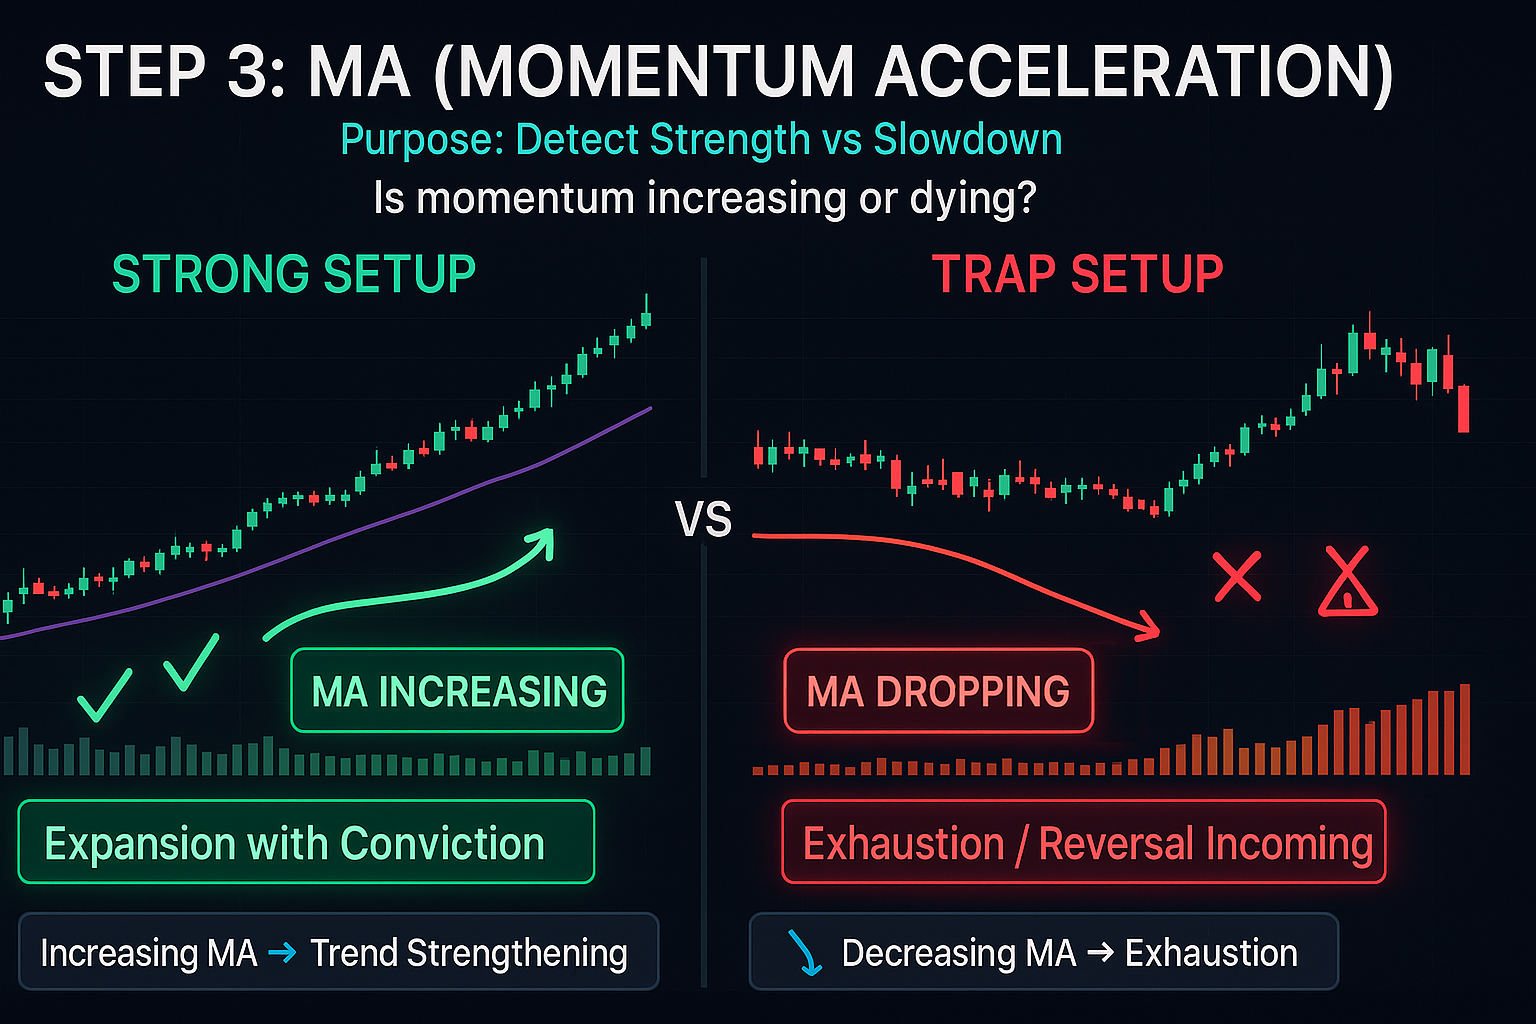
⚡ STEP 3 — MA (Momentum Acceleration)
Purpose: Detect strength vs slowdown
You’re measuring:
Is momentum increasing or dying?
Rules:
- Increasing MA → trend strengthening
- Decreasing MA → exhaustion
Strong setup:
- Price moving away from VWAP
- RVF high
- MA increasing
👉 This is expansion with conviction
Trap setup:
- Price moving
- RVF okay
- MA dropping
👉 Likely exhaustion / reversal incoming
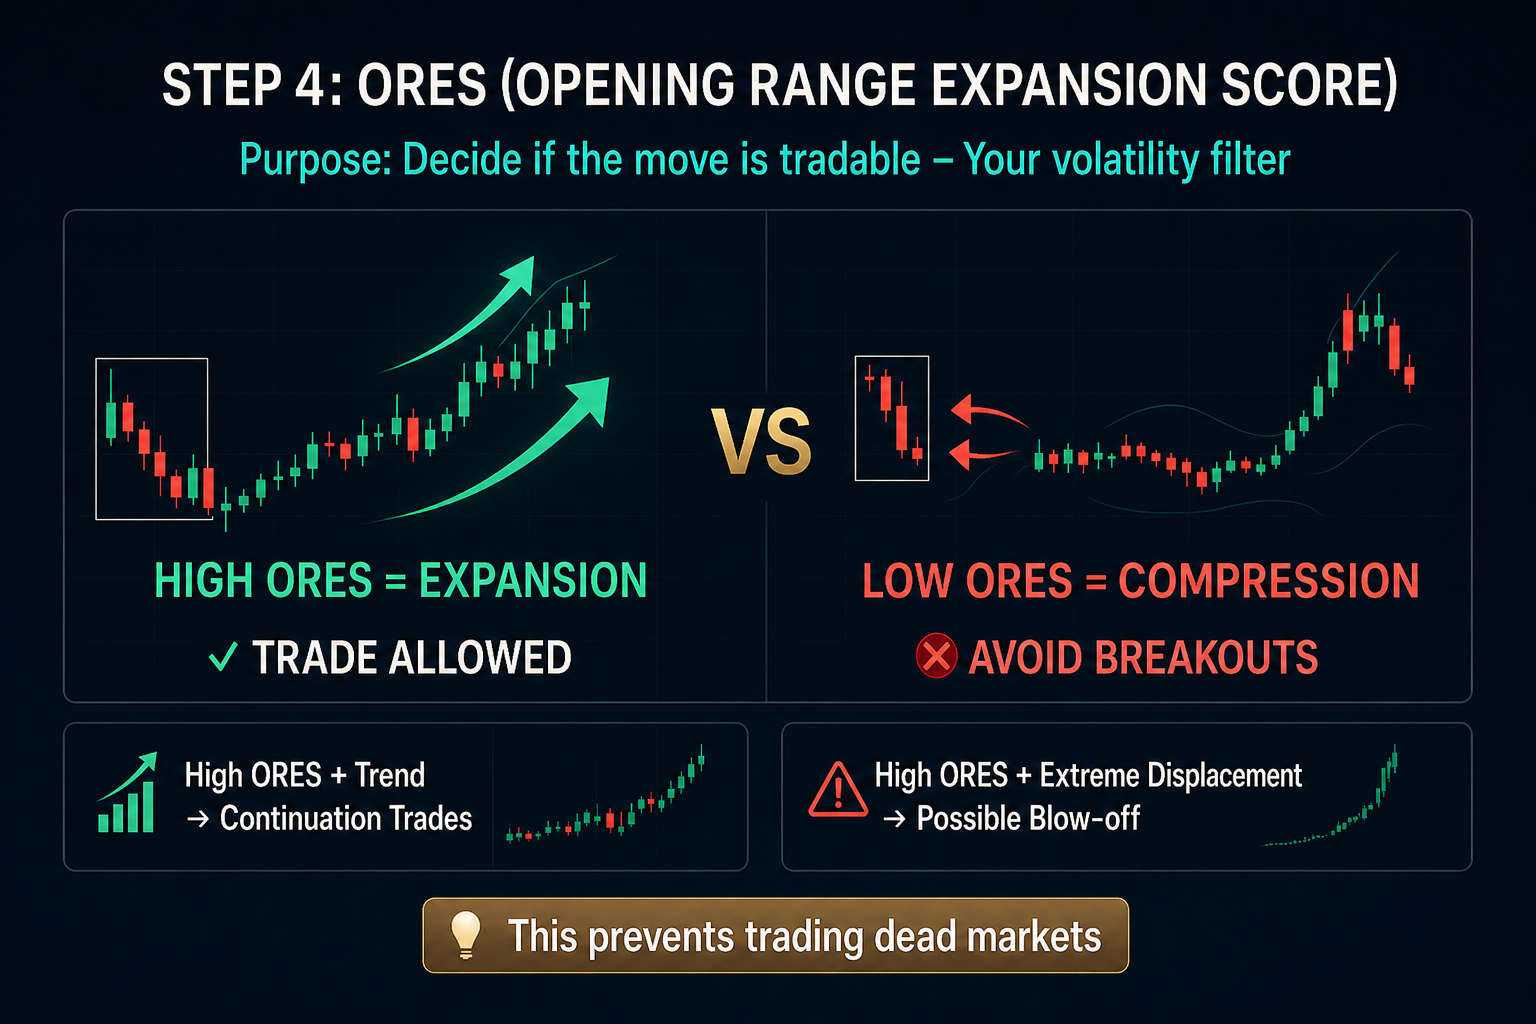
🚀 STEP 4 — ORES (Opening Range Expansion Score)
Purpose: Decide if the move is tradable
This is your volatility filter.
Rules:
- High ORES → market is expanding → trade allowed
- Low ORES → compression → avoid breakout trades
Context use:
- High ORES + trend → continuation trades
- High ORES + extreme displacement → possible blow-off
💡 This prevents trading dead markets.
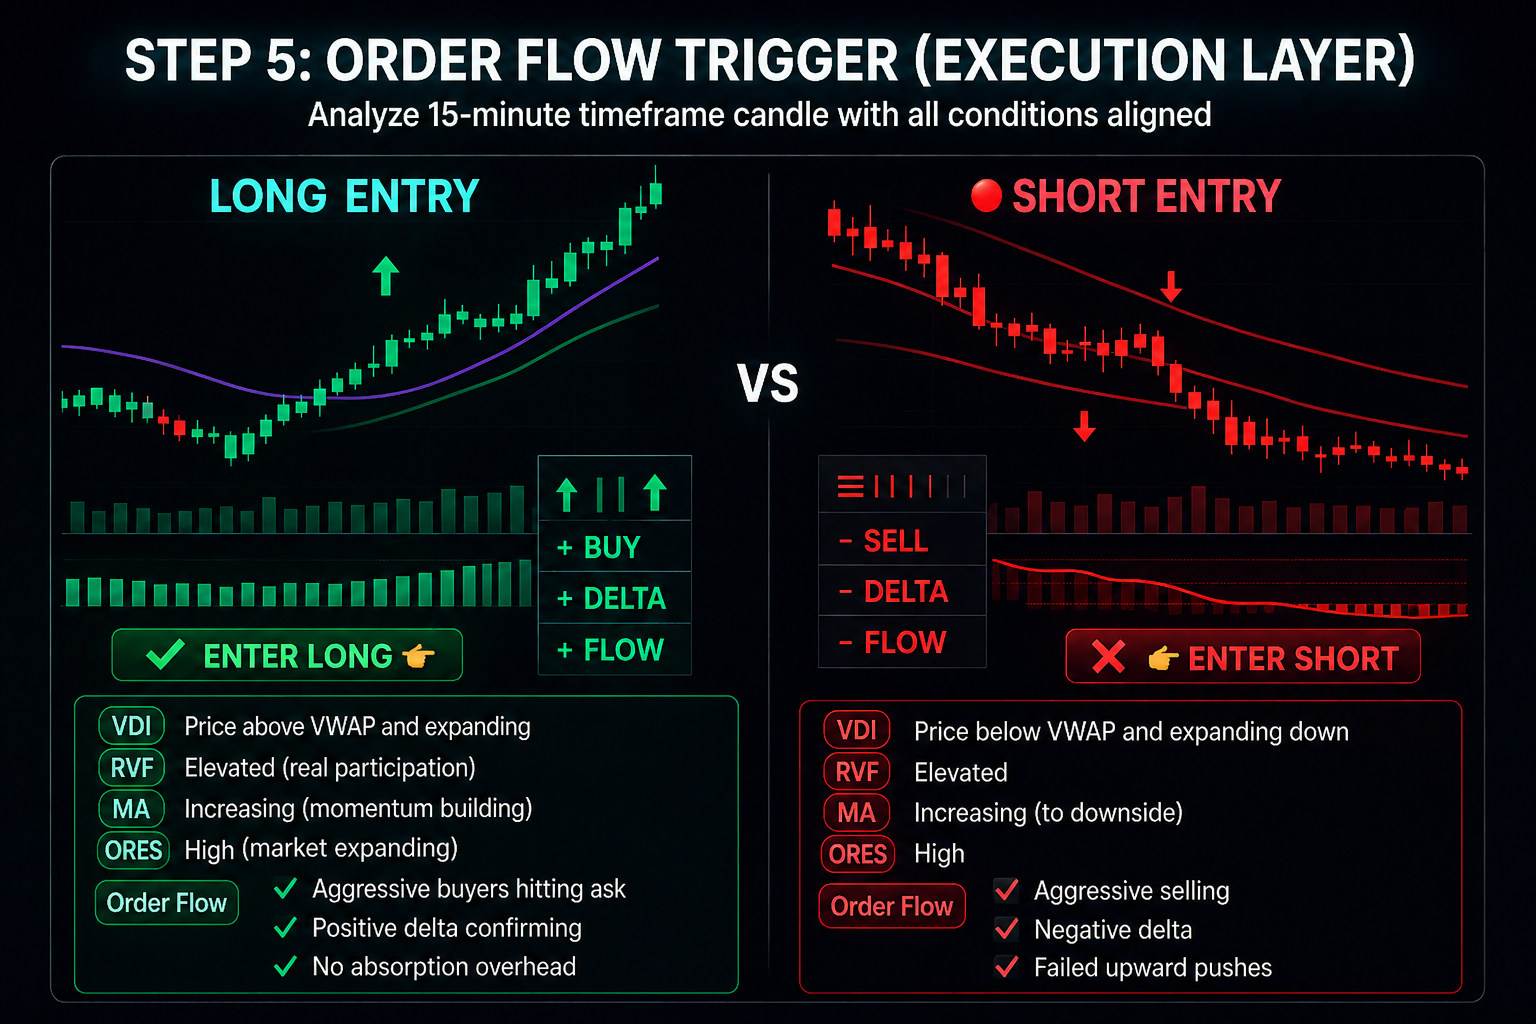
⚙️ STEP 5 — Order Flow Trigger (Execution Layer)
At SPX direction, we recommend that you analyze the price action of the 15-minute time frame candle while interpreting the SPX direction parameters. Only enter a trade when price is heading in your direction and the following conditions are met
🔵 Long Entry
- VDI
- Price above VWAP and expanding
- RVF
- Elevated (real participation)
- MA
- Increasing (momentum building)
- ORES
- High (market expanding)
- Order Flow
- Aggressive buyers hitting ask
- Positive delta confirming
- No absorption overhead
👉 ENTER LONG
🔴 Short Entry
- VDI
- Price below VWAP and expanding down
- RVF
- Elevated
- MA
- Increasing (to downside)
- ORES
- High
- Order Flow
- Aggressive selling
- Negative delta
- Failed upward pushes
👉 ENTER SHORT
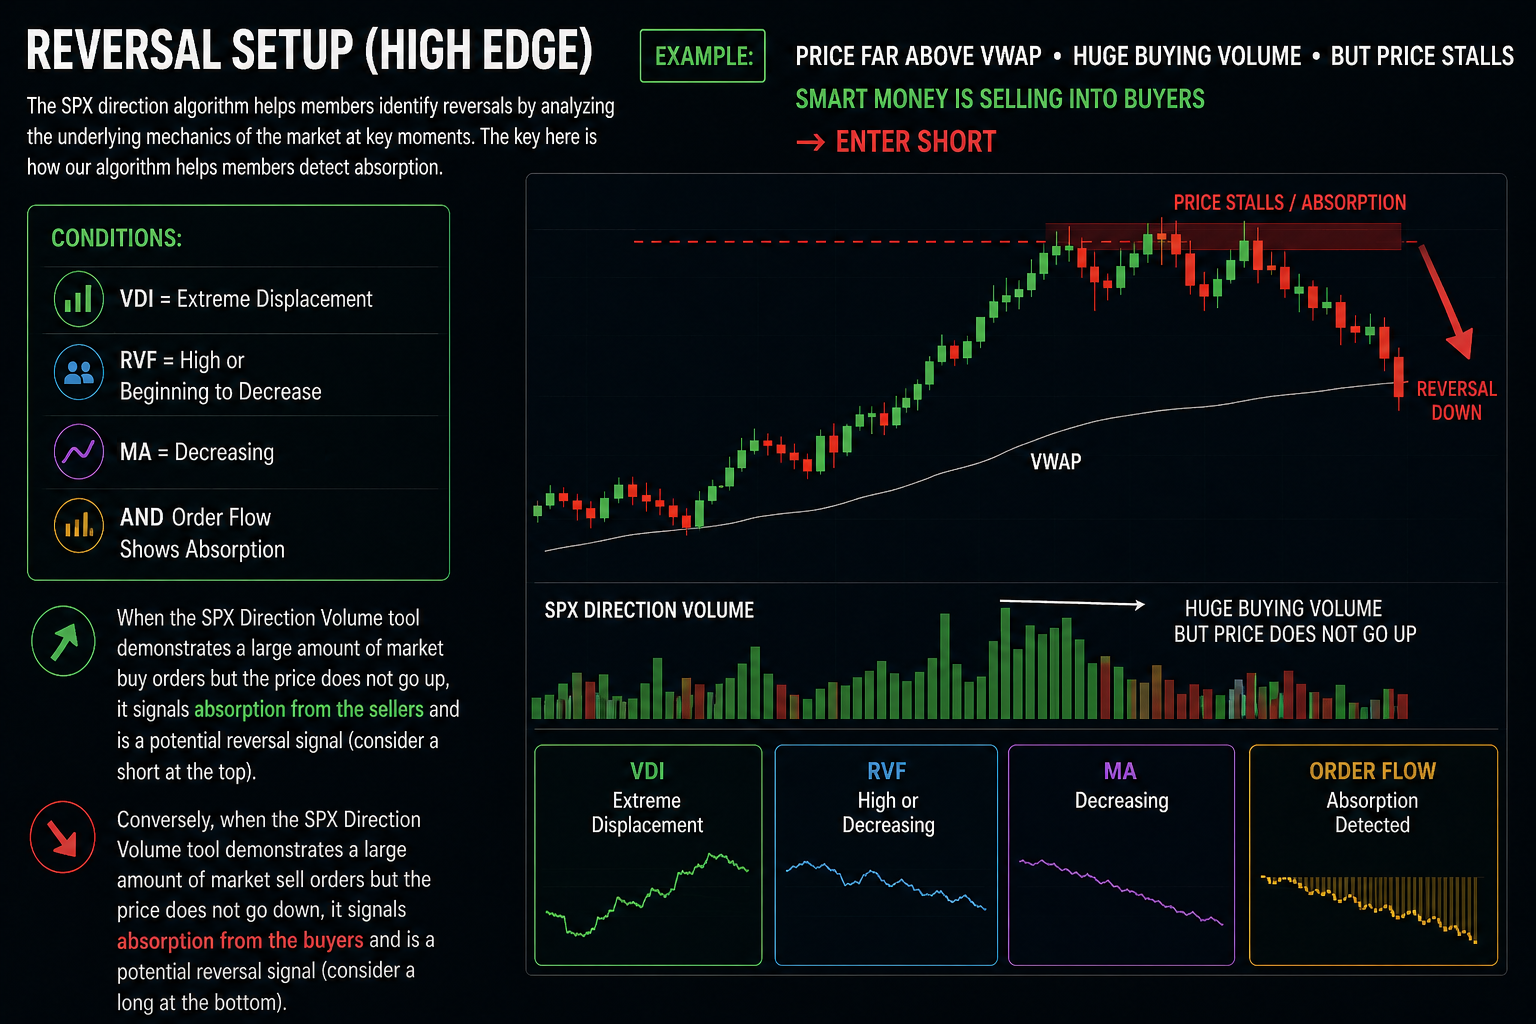
🧠 REVERSAL SETUP (High Edge)
The SPX direction algorithm helps members identify reversals by analyzing the underlying mechanics of the market at key moments. The key here is how our algorithm helps members detect absorption.
Conditions:
- VDI = extreme displacement
- RVF = high or beginning to decrease
- BUT MA = decreasing
- AND order flow shows absorption.
When the SPX Direction Volume tool demonstrates a large amount of market buy orders but the price does not go up, it signals absorption from the sellers and is a potential reversal signal (consider a short at the top)
Conversely, when the SPX Direction Volume tool demonstrates a large amount of market sell orders but the price does not go down, it signals absorption from the buyers and is a potential reversal signal (consider a long at the bottom)
Example:
- Price far above VWAP
- Huge buying volume
- But price stalls
👉 Smart money is selling into buyers
👉 ENTER SHORT
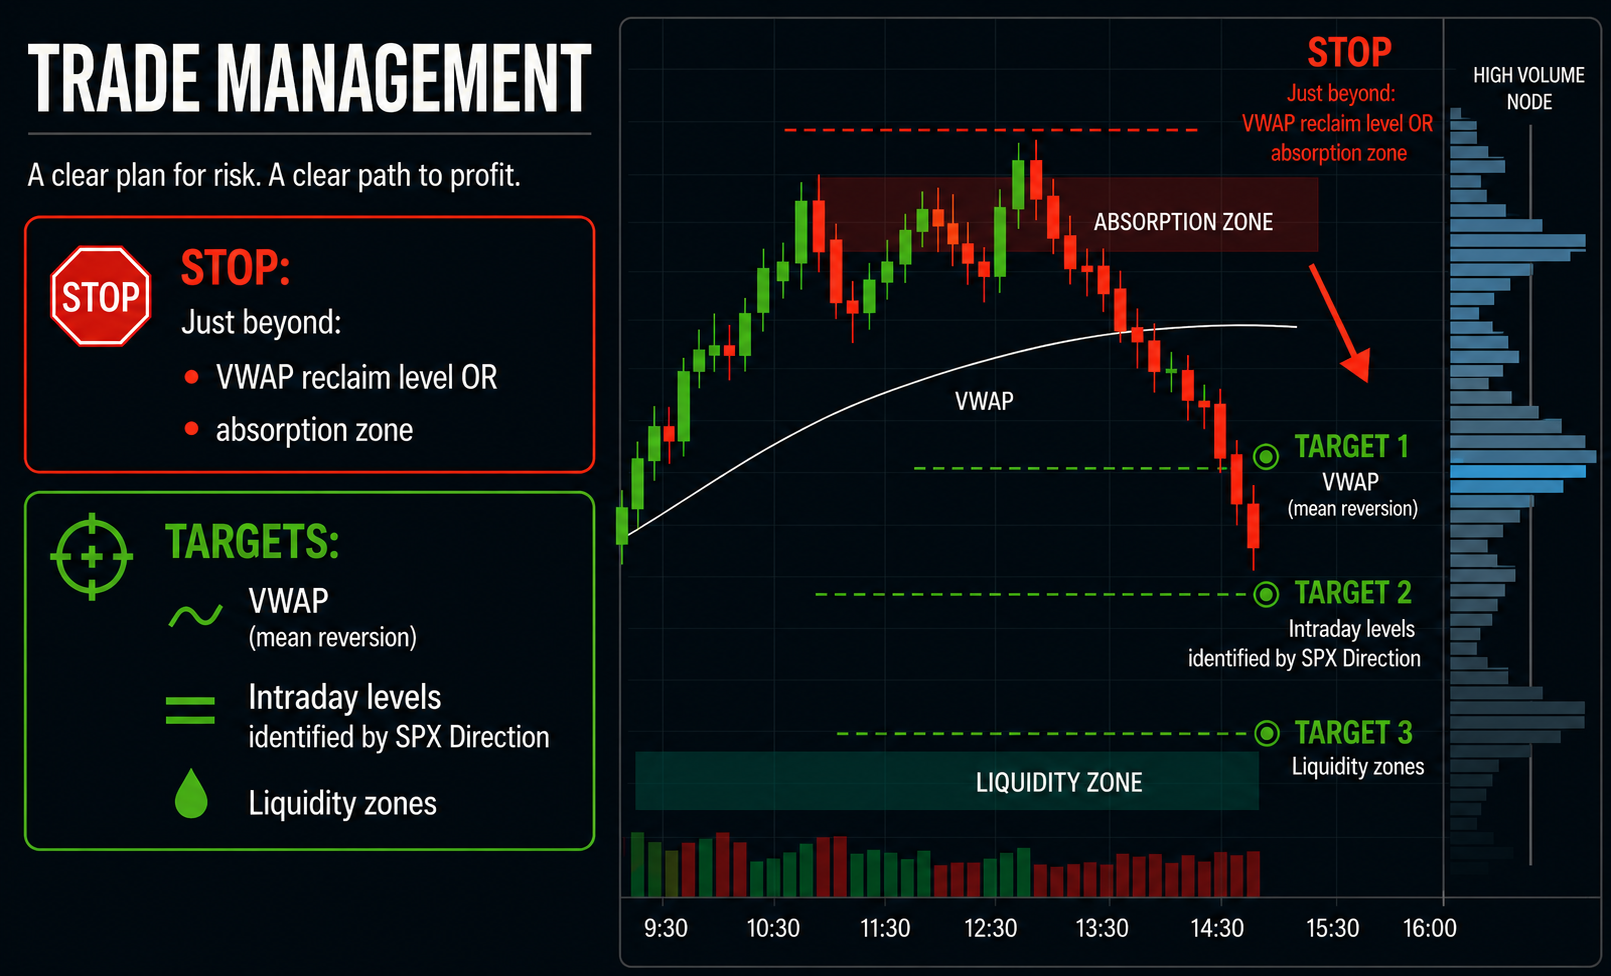
🎯 Trade Management
Stop:
- Just beyond:
- VWAP reclaim level OR
- absorption zone
Targets:
🔁 Full Checklist (Use This Daily)
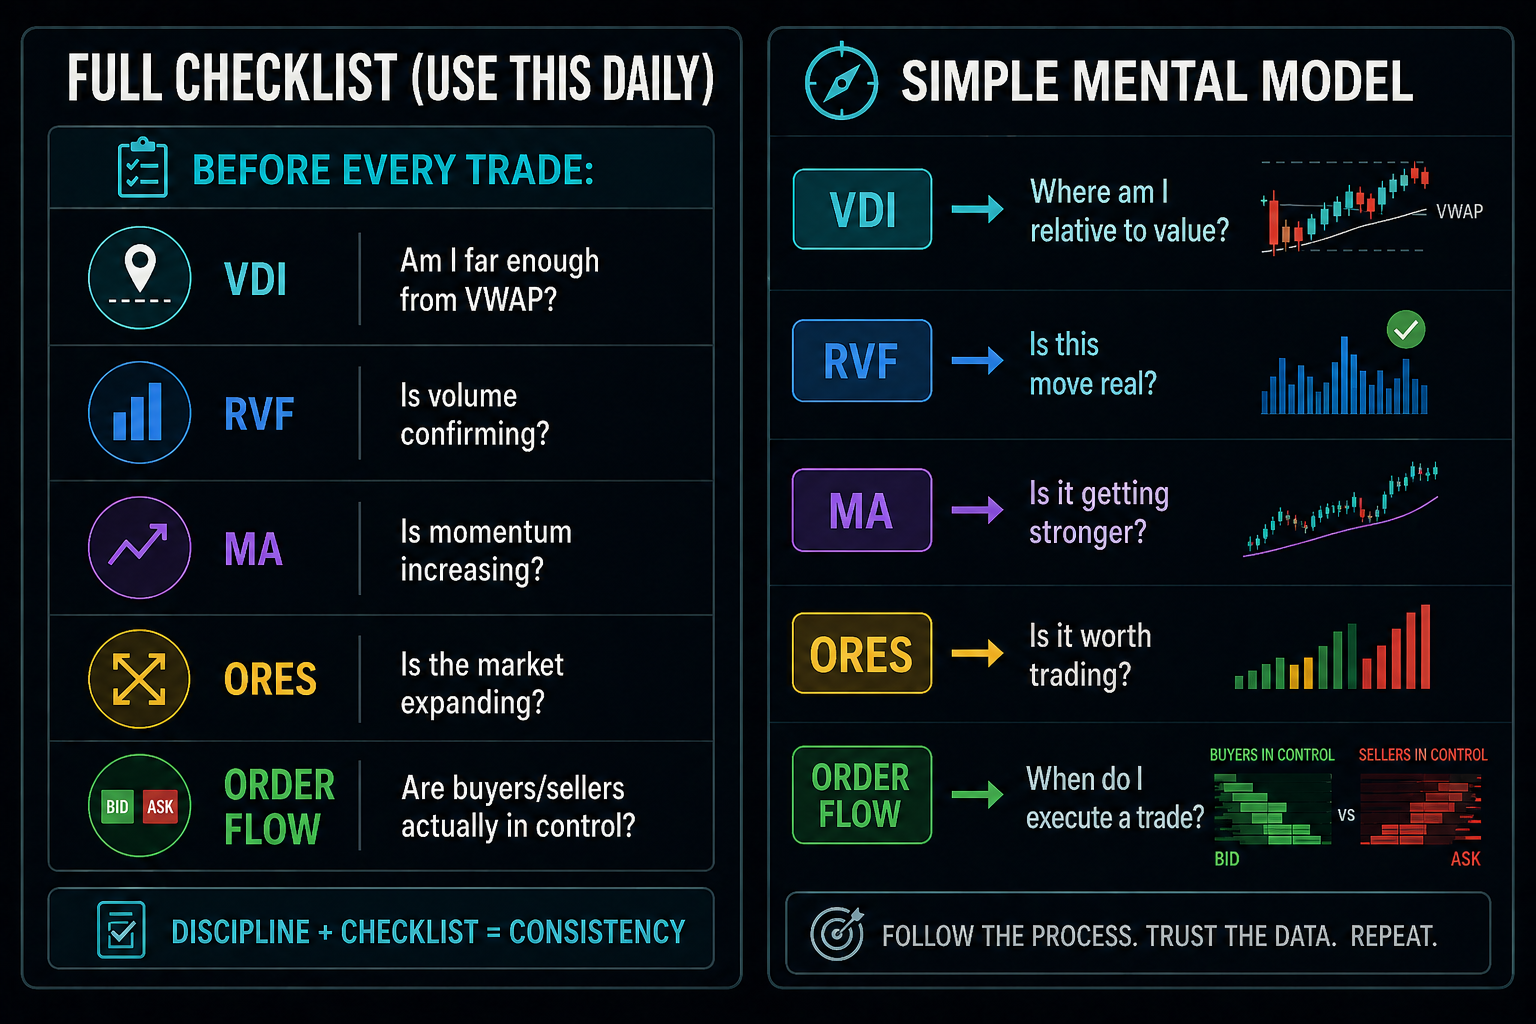
Before every trade:
- VDI
- Am I far enough from VWAP?
- RVF
- Is volume confirming?
- MA
- Is momentum increasing?
- ORES
- Is the market expanding?
- Order Flow
- Are buyers/sellers actually in control?
🧭 Simple Mental Model
- VDI → Where am I relative to value?
- RVF → Is this move real?
- MA → Is it getting stronger?
- ORES → Is it worth trading?
- Order Flow → When do I execute a trade?
⚠️ Identifying Absorption with SPX Direction Parameters
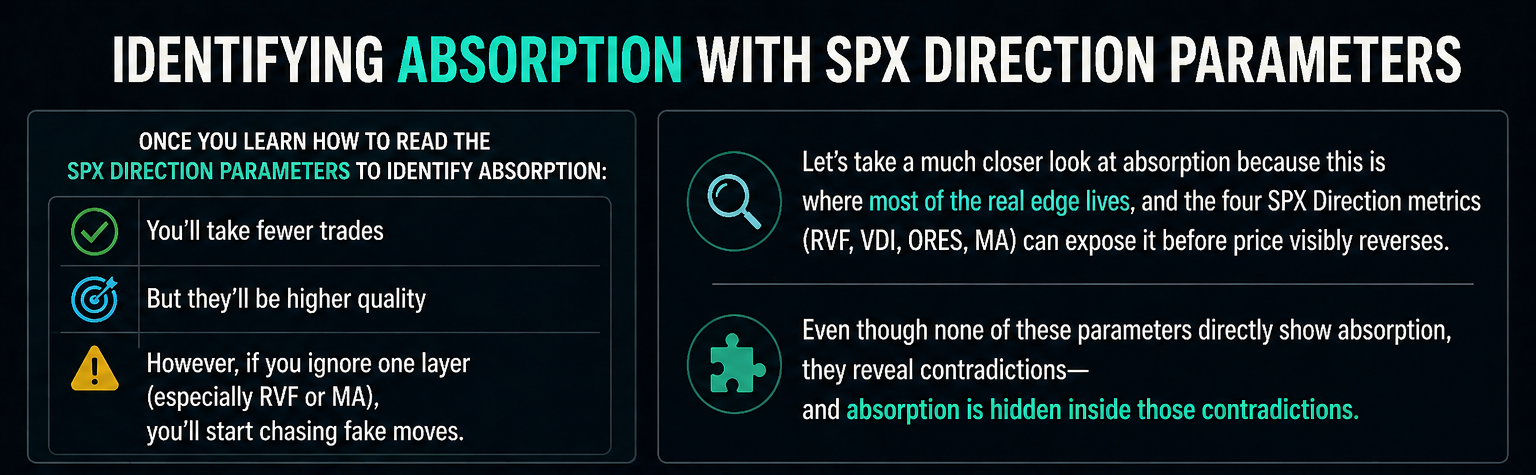
Once you learn how to read the SPX direction parameters to identify absorption:
- You’ll take fewer trades
- But they’ll be higher quality
However, if you ignore one layer (especially RVF or MA), you’ll start chasing fake moves.
Let's take a much closer look at absorption because this is where most of the real edge lives, and the four SPX Direction metrics (RVF, VDI, ORES, MA) can expose it before price visibly reverses.
Even though none of these parameters directly show absorption, they reveal contradictions—and absorption is hidden inside those contradictions.
🧠 What Absorption Actually Means (Beyond the Buzzword)
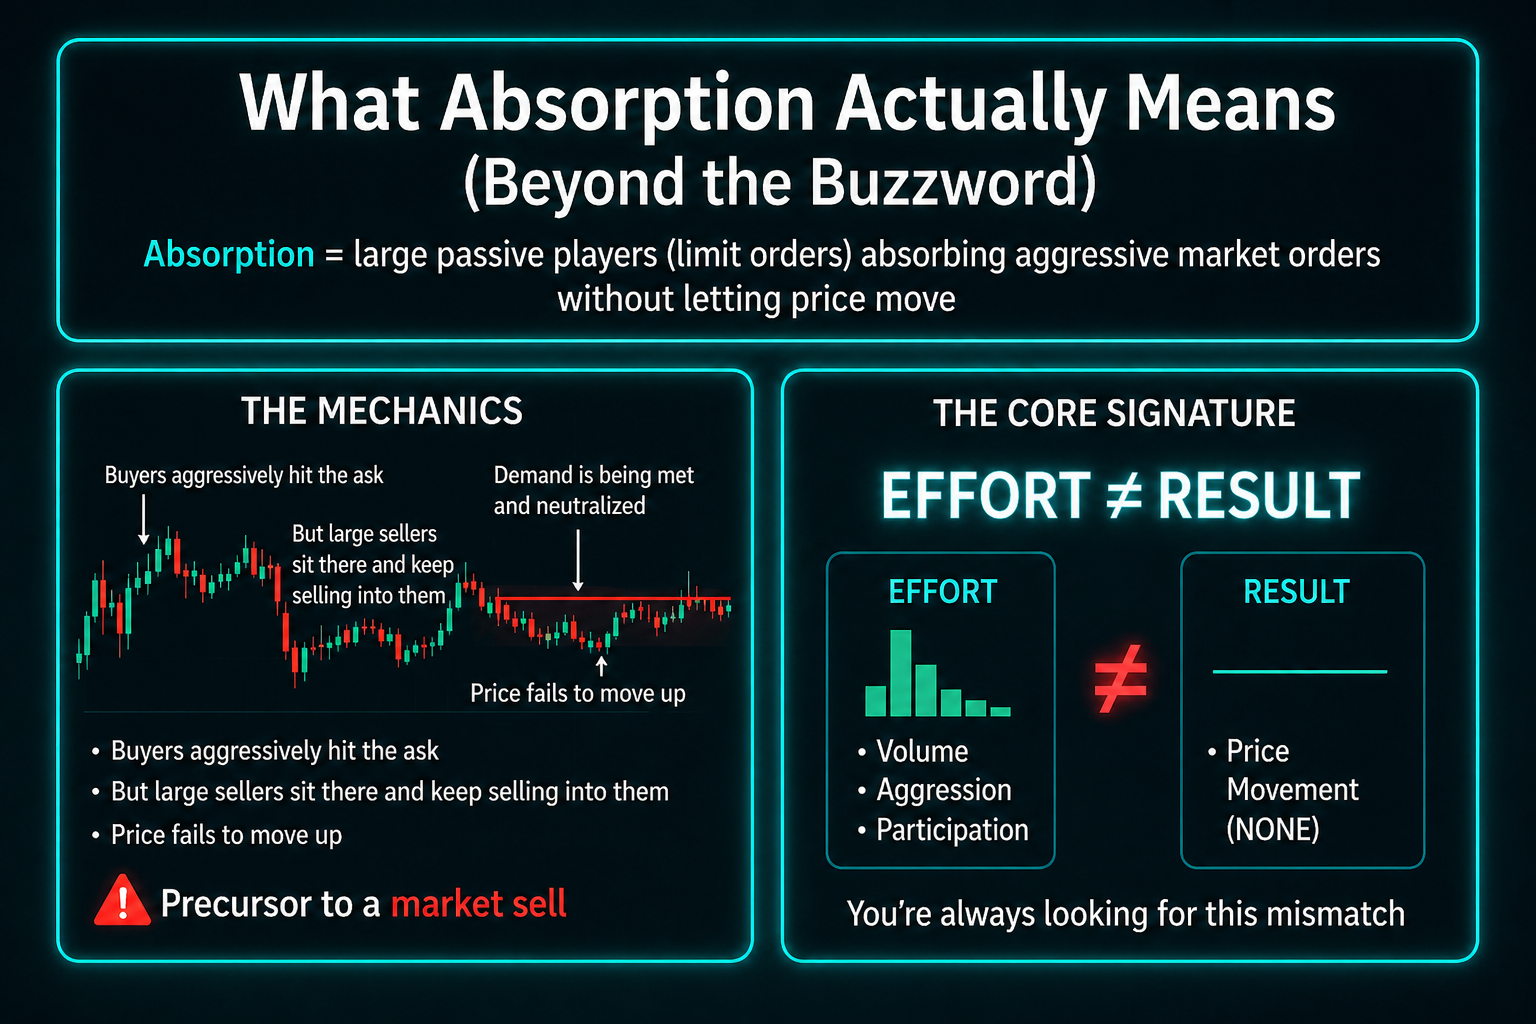
Absorption = large passive players (limit orders) absorbing aggressive market orders without letting price move.
Mechanically:
- Buyers aggressively hit the ask
- But large sellers sit there and keep selling into them
- Price fails to move up
👉 That means:
Demand is being met and neutralized, not allowing price to go higher. This can be a precursor to a market sell.
🔍 The Core Signature of Absorption
You’re always looking for this mismatch:
Effort ≠ Result
- Effort = volume, aggression, participation
- Result = price movement
⚙️ Mapping Each SPX Direction Metric to Absorption
The SPX Direction Dashboard is your guided detection system.
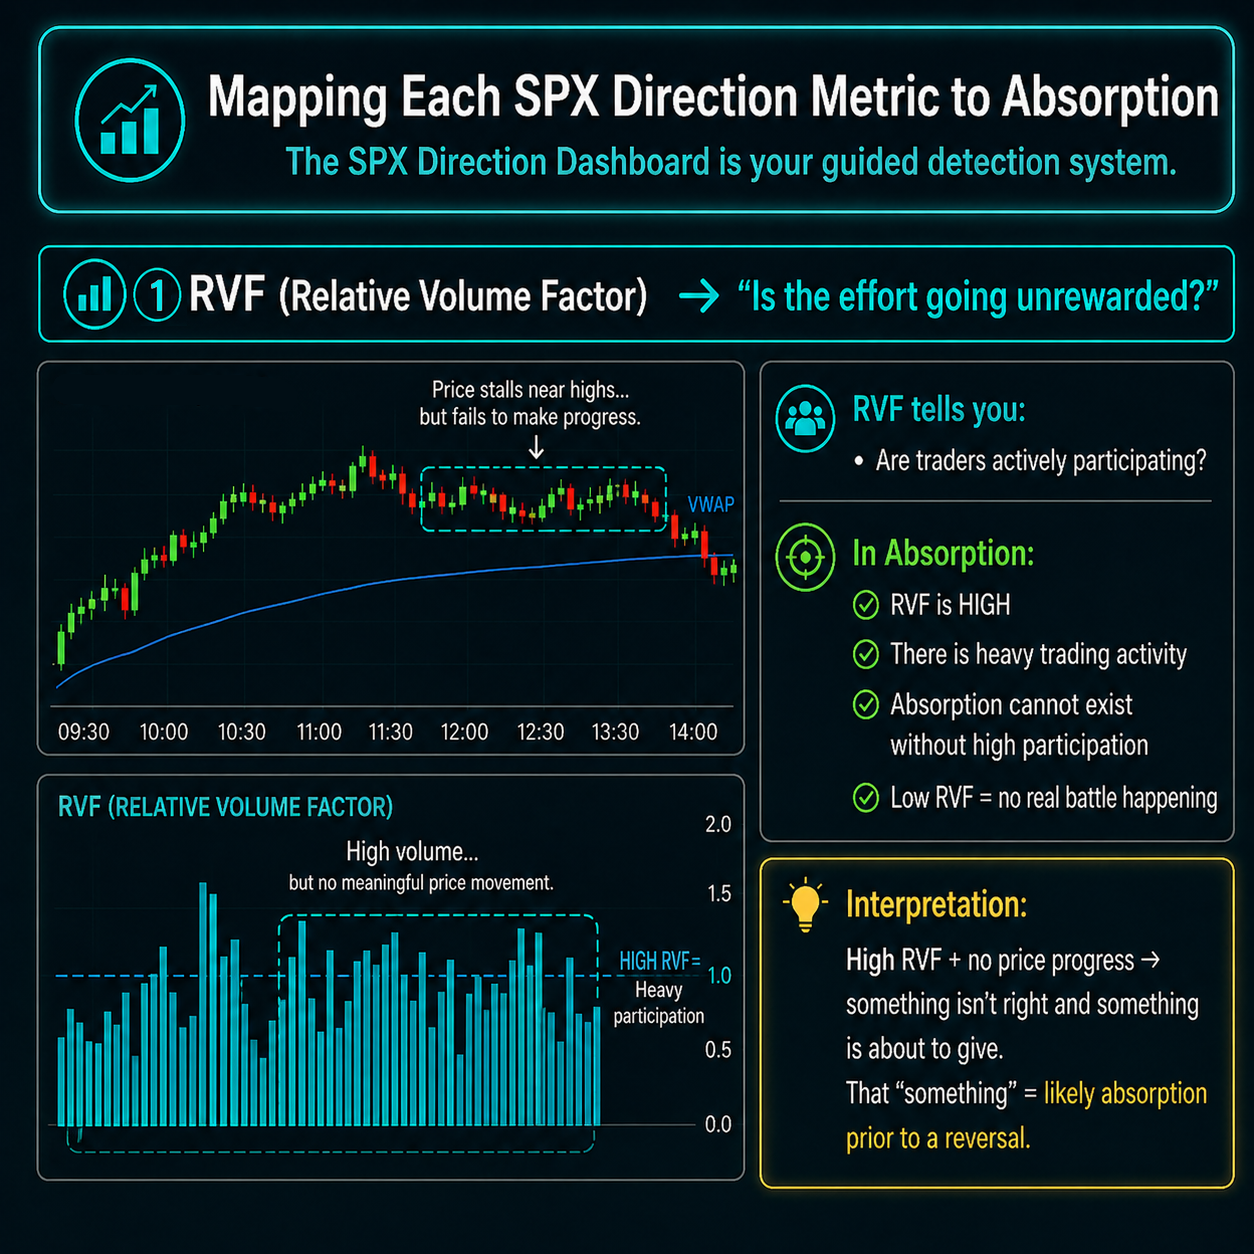
📊 1. RVF (Relative Volume Factor) → “Is the effort going unrewarded?”
RVF tells you:
- Are traders actively participating?
In Absorption:
- RVF is HIGH
- There is heavy trading activity
- Absorption cannot exist without high participation
- Low RVF = no real battle happening
Interpretation:
- High RVF + no price progress → something isn't right and something is about to give.
- That “something” = likely absorption prior to a reversal
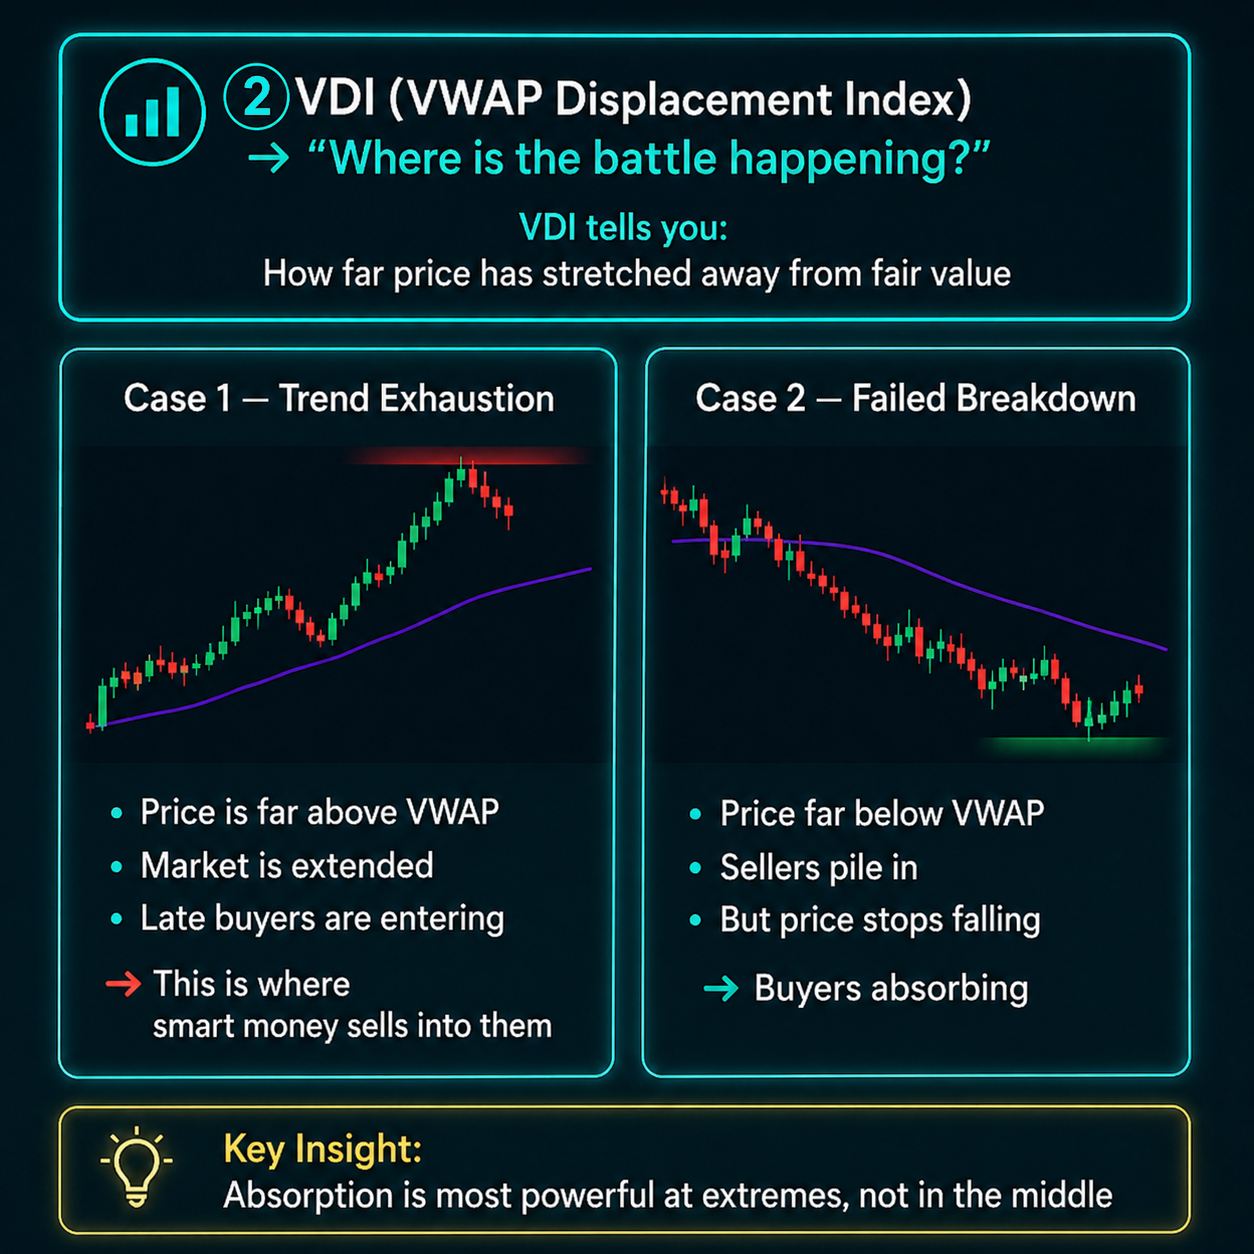
📍 2. VDI (VWAP Displacement Index) → “Where is the battle happening?”
VDI tells you:
- How far price has stretched away from fair value
In Absorption:
- Case 1 — Trend Exhaustion:
- Price is far above VWAP
- Market is extended
- Late buyers are entering
👉 This is where smart money sells into them
- Case 2 — Failed Breakdown:
- Price far below VWAP
- Sellers pile in
- But price stops falling
👉 Buyers absorbing
💡 Key Insight:
Absorption is most powerful at extremes, not in the middle
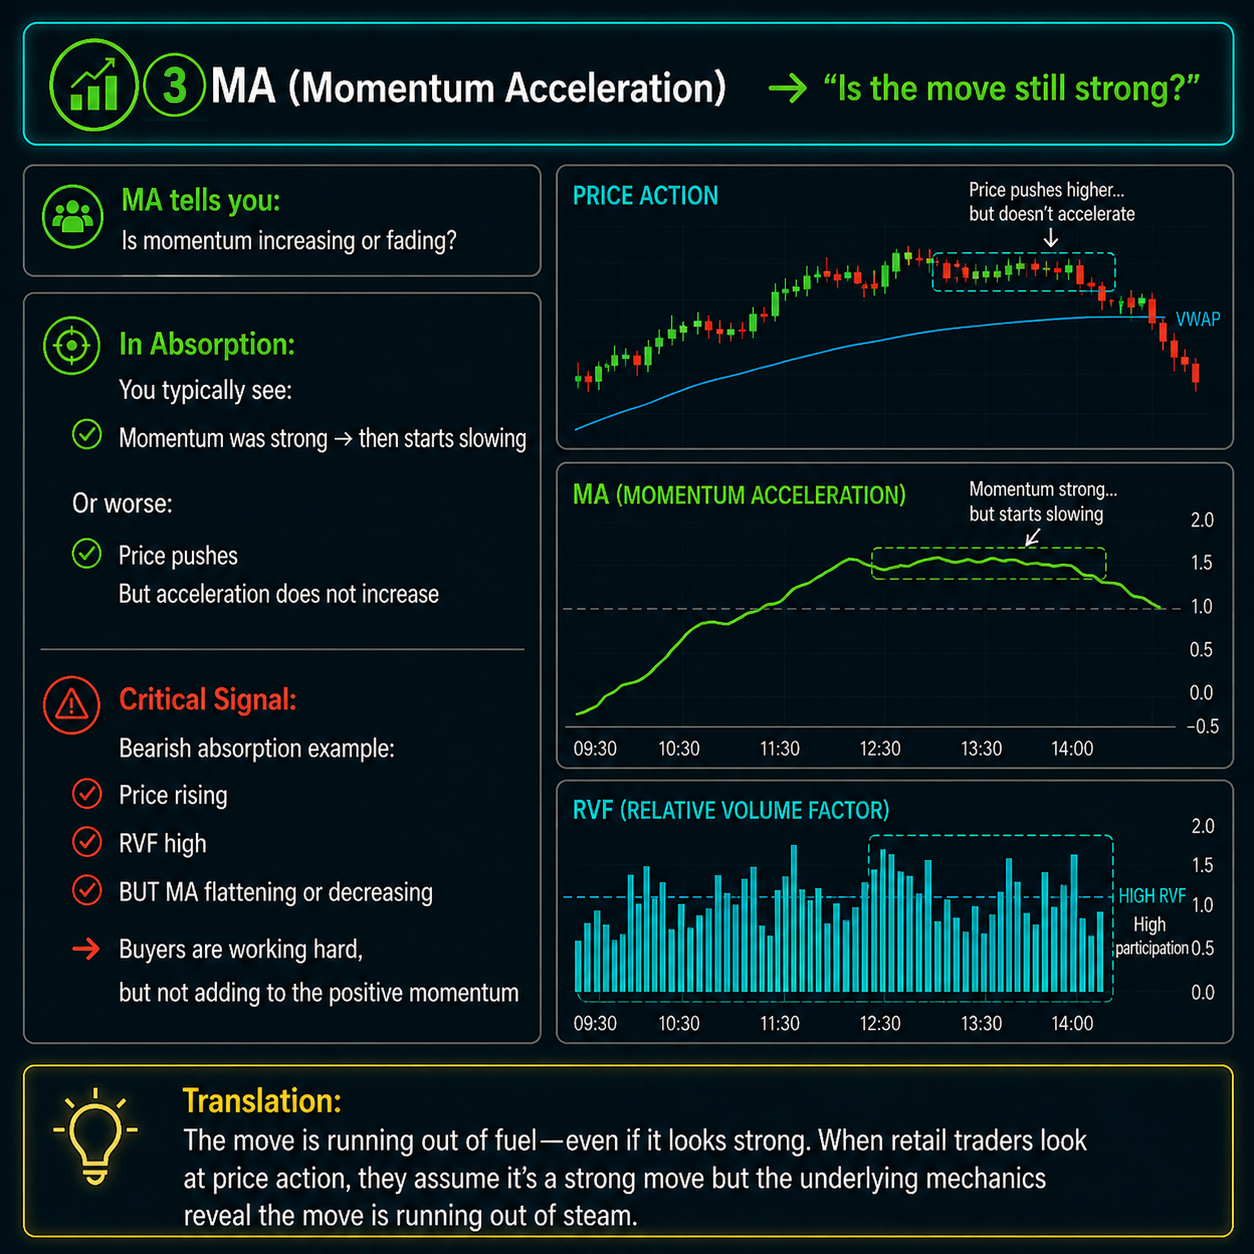
⚡ 3. MA (Momentum Acceleration) → “Is the move still strong?”
MA tells you:
- Is momentum increasing or fading?
In Absorption:
- You typically see:
- Momentum was strong → then starts slowing
- Or worse:
- Price pushes
- But acceleration does not increase
Critical Signal:
- Bearish absorption example:
- Price rising
- RVF high
- BUT MA flattening or decreasing
👉 Buyers are working hard, but not adding to the positive momentum
💡 Translation:
The move is running out of fuel—even if it looks strong. When retail traders look at price action, they assume it's a strong move but the underlying mechanics reveal the move is running out of steam.
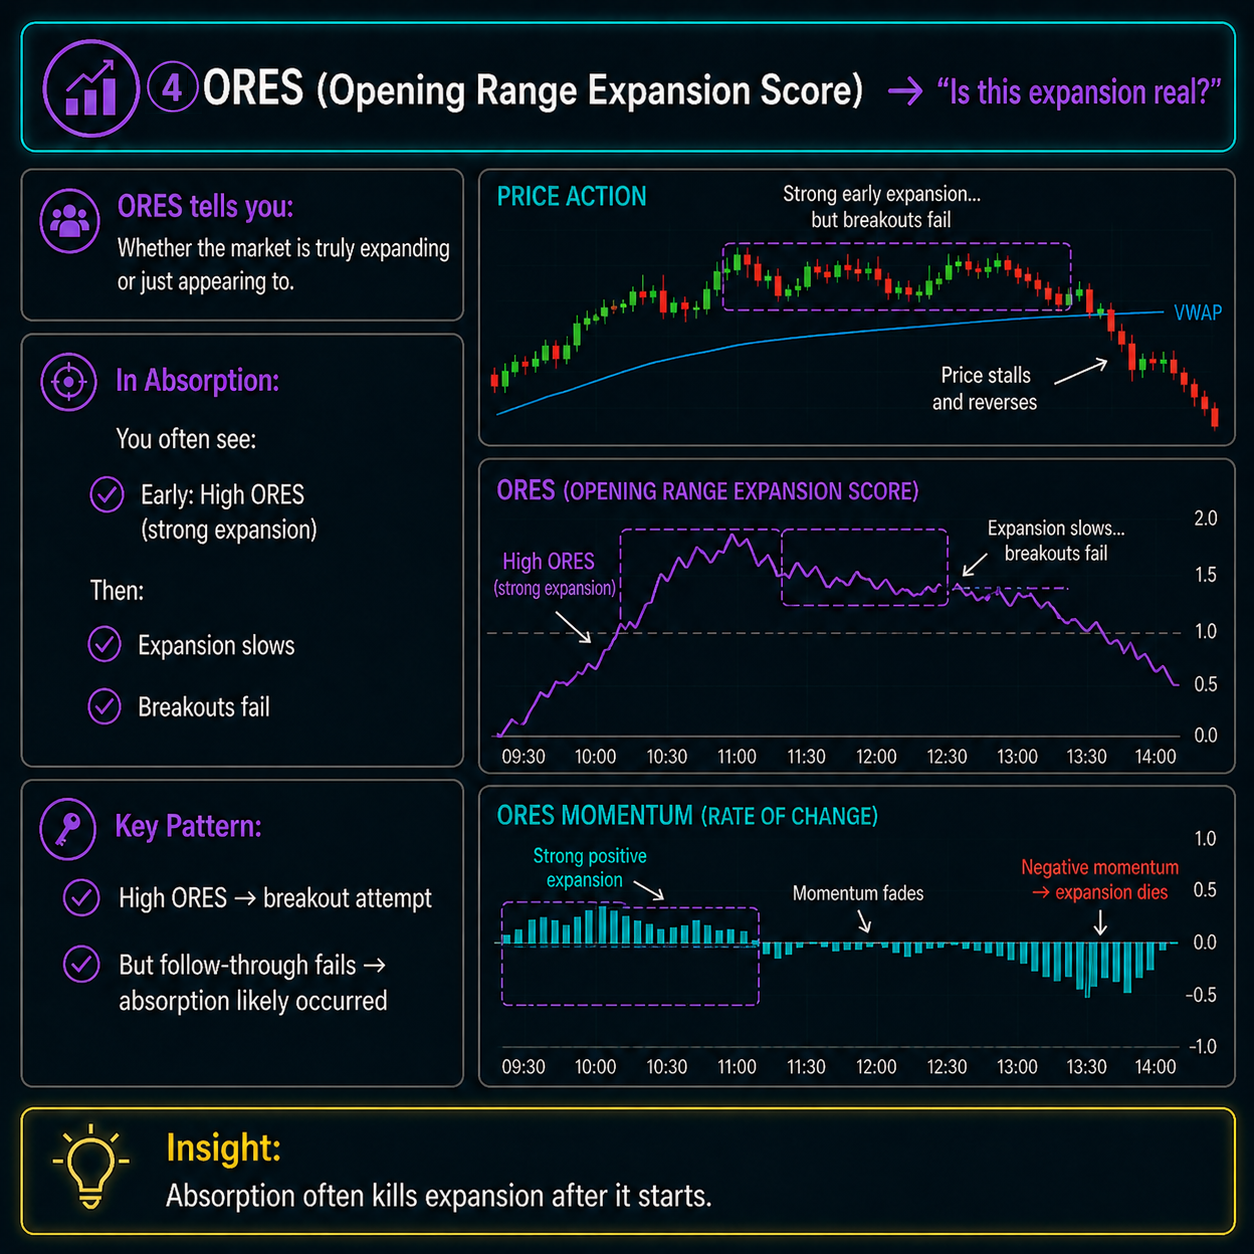
🚀 4. ORES (Opening Range Expansion Score) → “Is this expansion real?”
ORES tells you:
- Whether the market is truly expanding or just appearing to
In Absorption:
- You often see:
- Early: High ORES (strong expansion)
- Then:
- Expansion slows
- Breakouts fail
Key Pattern:
- High ORES → breakout attempt
- But follow-through fails → absorption likely occurred
💡 Insight:
Absorption often kills expansion after it starts
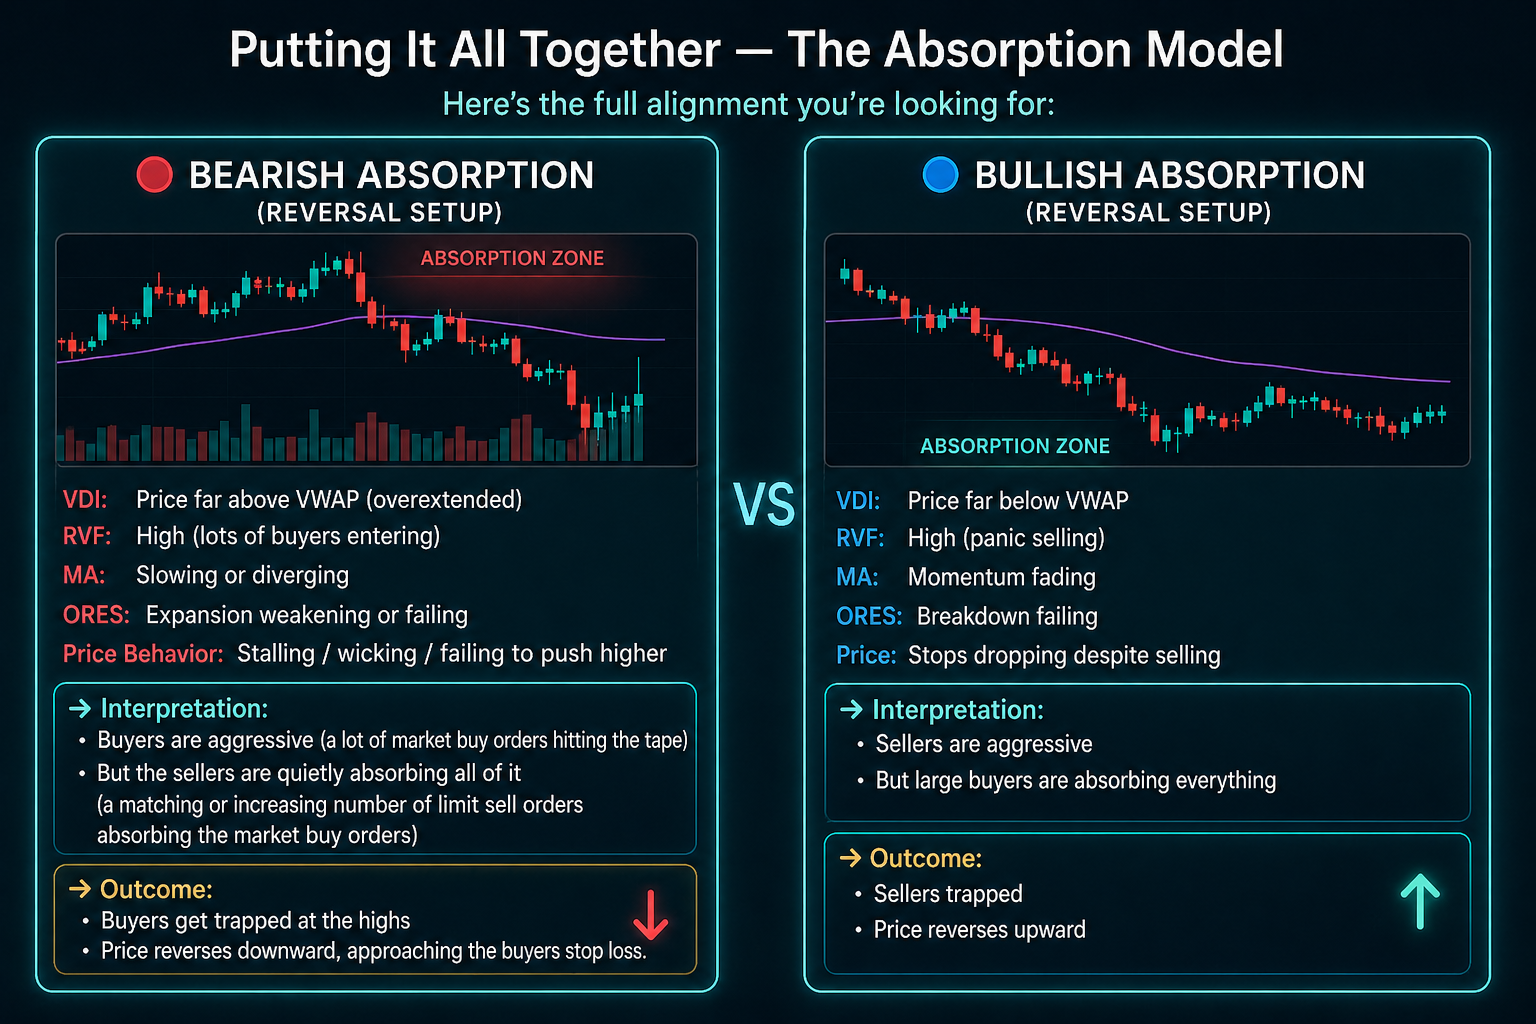
🔁 Putting It All Together — The Absorption Model
Here’s the full alignment you’re looking for:
🔴 Bearish Absorption (Reversal Setup)
- VDI
- Price far above VWAP (overextended)
- RVF
- High (lots of buyers entering)
- MA
- Slowing or diverging
- ORES
- Expansion weakening or failing
- Price Behavior
- Stalling / wicking / failing to push higher
👉 Interpretation:
- Buyers are aggressive (a lot of market buy orders hitting the tape)
- But the sellers are quietly absorbing all of it (a matching or increasing number of limit sell orders absorbing the market buy orders)
👉 Outcome:
- Buyers get trapped at the highs
- Price reverses downward, approaching the buyers stop loss.
🔵 Bullish Absorption (Reversal Setup)
- VDI
- Price far below VWAP
- RVF
- High (panic selling)
- MA
- Momentum fading
- ORES
- Breakdown failing
- Price
- Stops dropping despite selling
👉 Interpretation:
- Sellers are aggressive
- But large buyers are absorbing everything
👉 Outcome:
- Sellers trapped
- Price reverses upward
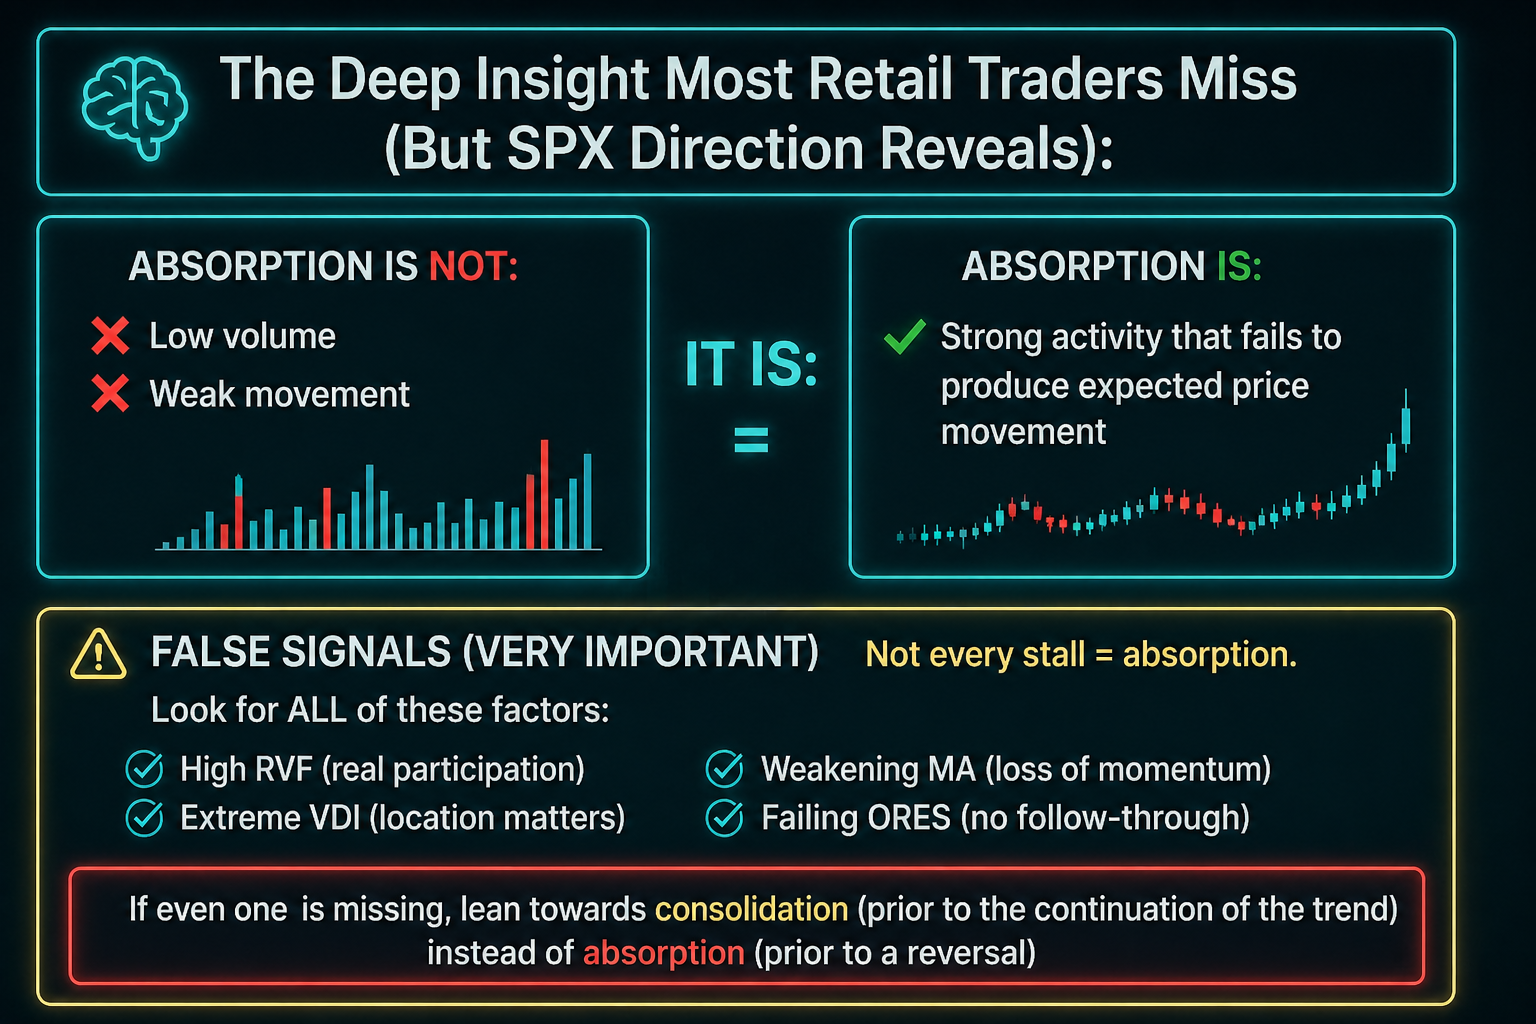
🧠 The Deep Insight Most Retail Traders Miss (But SPX Direction Reveals):
Absorption is NOT:
- Low volume
- Weak movement
It is:
- Strong activity that fails to produce expected price movement
⚠️ False Signals (Very Important)
Not every stall = absorption.
Look for ALL of these factors:
- High RVF (real participation)
- Extreme VDI (location matters)
- Weakening MA (loss of momentum)
- Failing ORES (no follow-through)
If even one is missing, lean towards consolidation (prior to the continuation of the trend) instead of absorption (prior to a reversal)
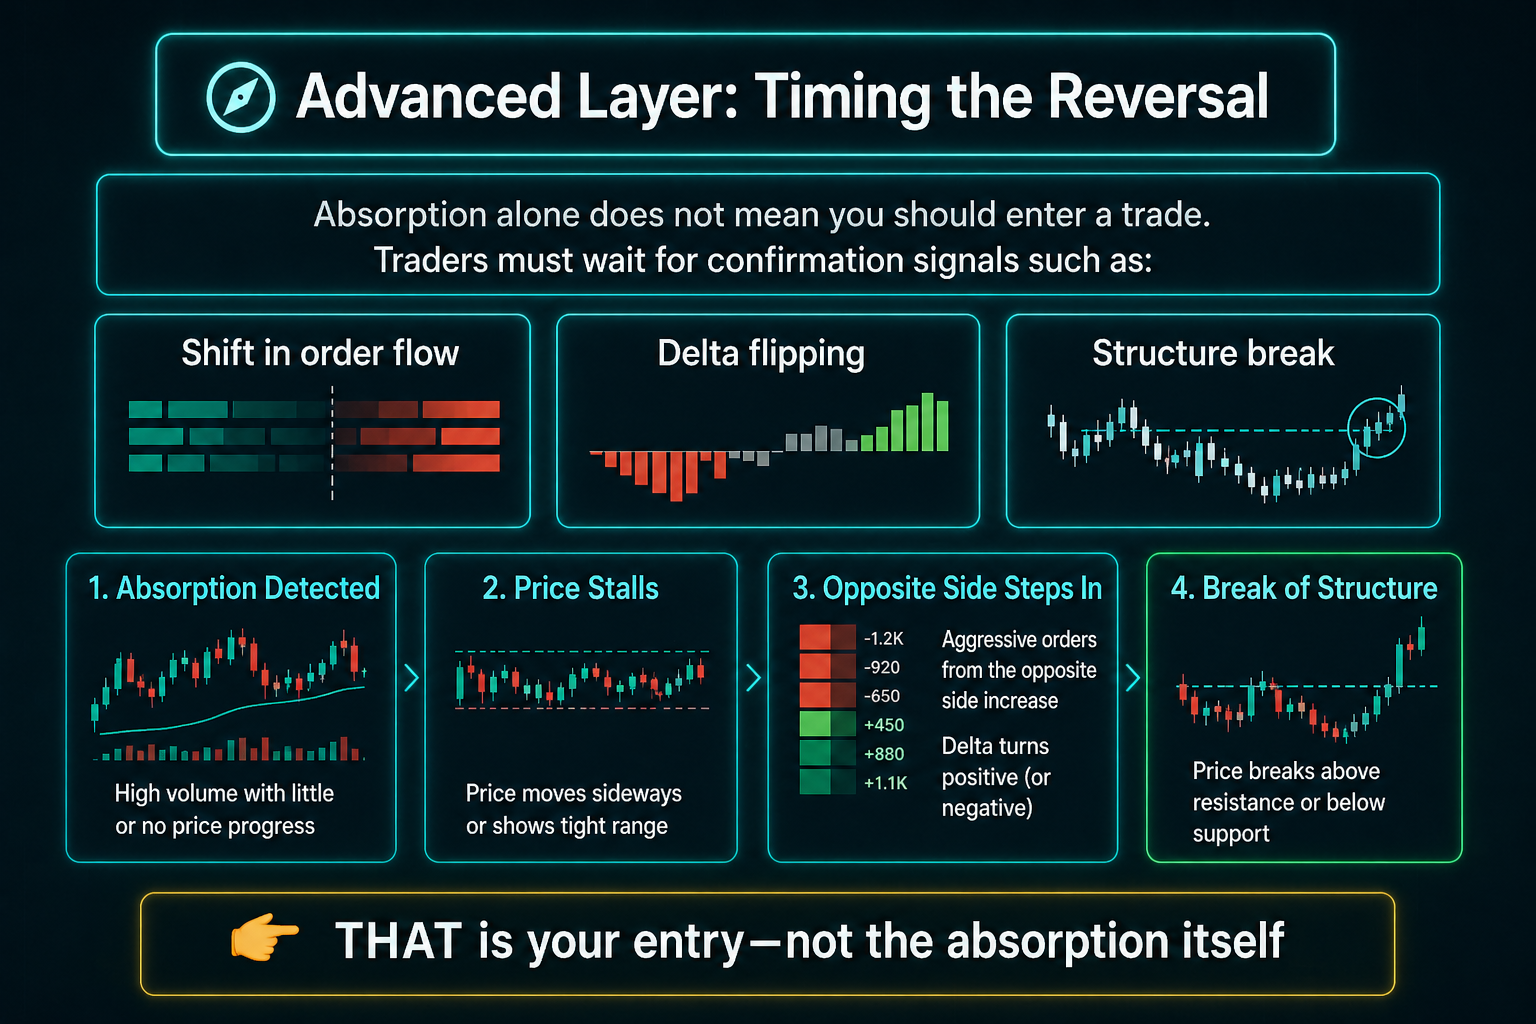
🧭 Advanced Layer: Timing the Reversal
Absorption alone does not mean you should enter a trade.
Traders must wait for confirmation signals such as:
- Shift in order flow
- Delta flipping
- Structure break
Sequence:
- Absorption detected
- Price stalls
- Opposite side steps in
- Break of structure
👉 THAT is your entry—not the absorption itself
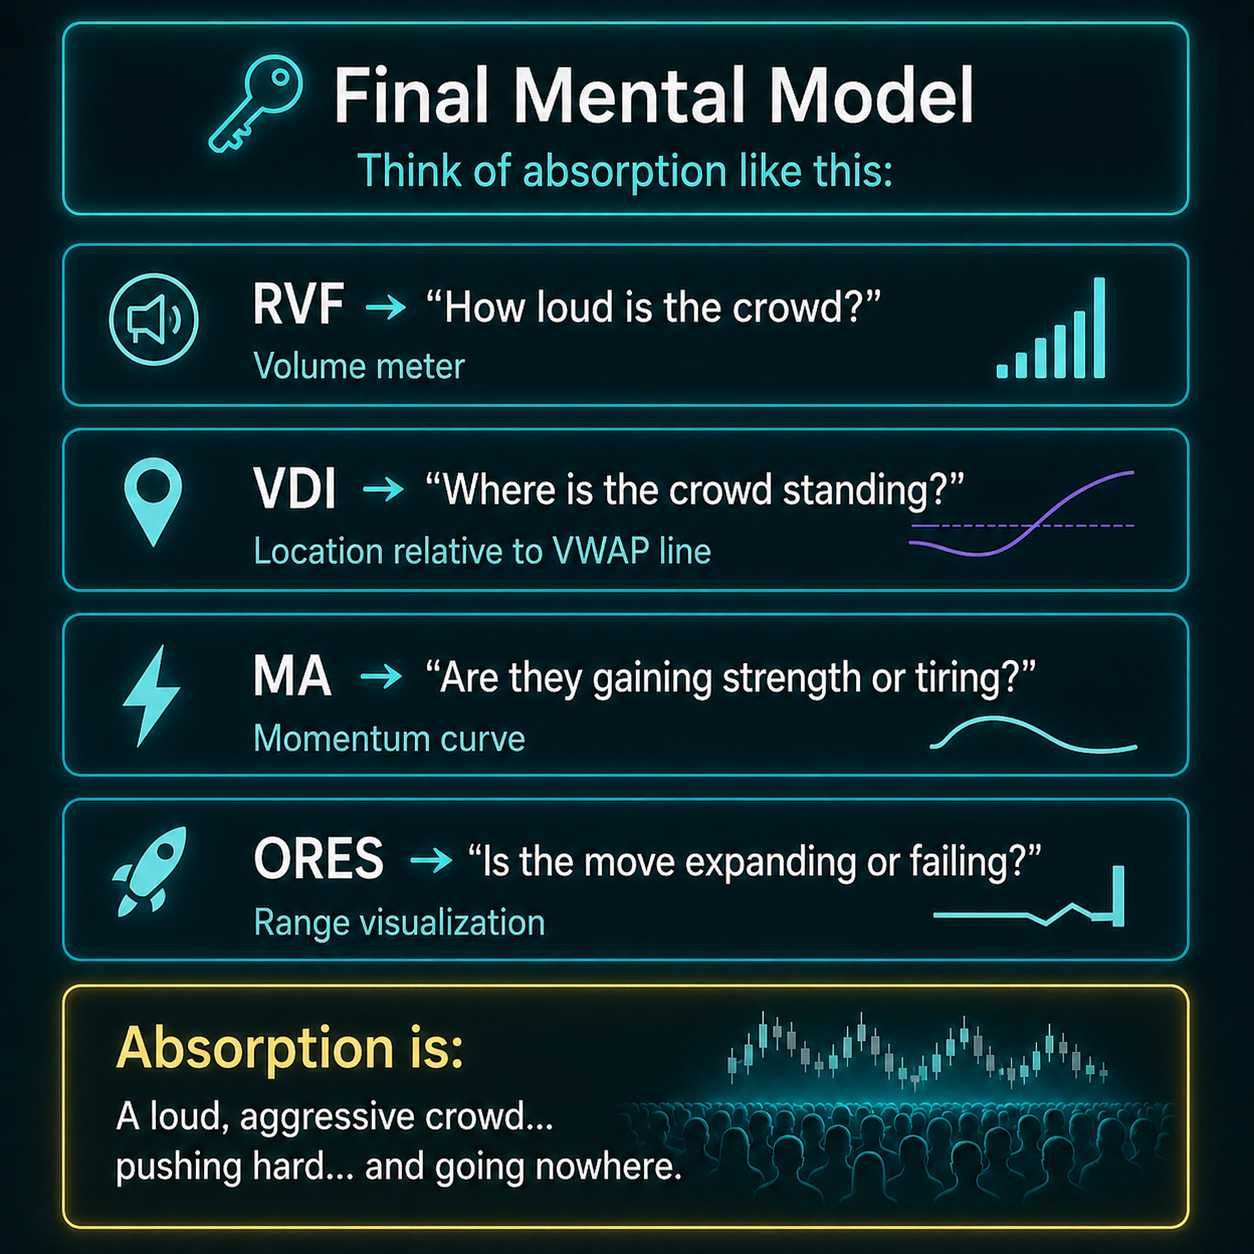
🔑 Final Mental Model
Think of absorption like this:
- RVF → “How loud is the crowd?”
- VDI → “Where is the crowd standing?”
- MA → “Are they gaining strength or tiring?”
- ORES → “Is the move expanding or failing?”
Absorption is:
A loud, aggressive crowd… pushing hard… and going nowhere.