SPX Direction Algorithm Dashboard Walkthrough - Where You See It All
Does the ES currently have enough strength and confirmation to make a meaningful move?
This dashboard is a real-time trading dashboard for ES, and individual stocks in upcoming updates. It is designed to monitor the underlying strength of the instrument, receive and interpret live market data, calculate volume and momentum scores, and identify which setups are the best for long or short trades. The page combines RVF, VDI, MA, and ORES into a single Trade Probability Score, while also showing live alerts and news.
Big picture: how the dashboard works
Think of the dashboard in 4 simple layers:
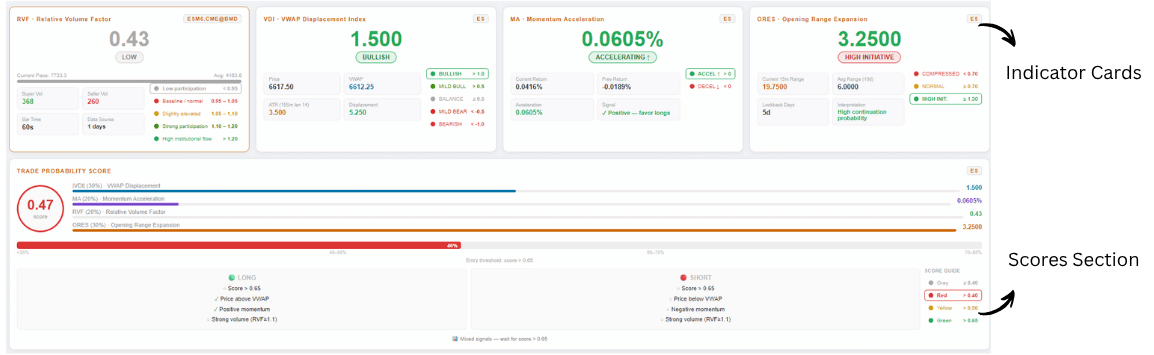
Layer 1: Frontend display
This is the page the user sees. It contains:
- indicator cards
- score section
- live alerts feed
Layer 2: Indicator processing
The dashboard receives incoming data and updates these 4 core indicators:
- RVF
- VDI
- MA
- ORES
Layer 3: Final scoring
Those indicators are normalized, weighted, and combined into one overall score and probability reading. That final score helps determine long or short bias.
Main sections of the dashboard
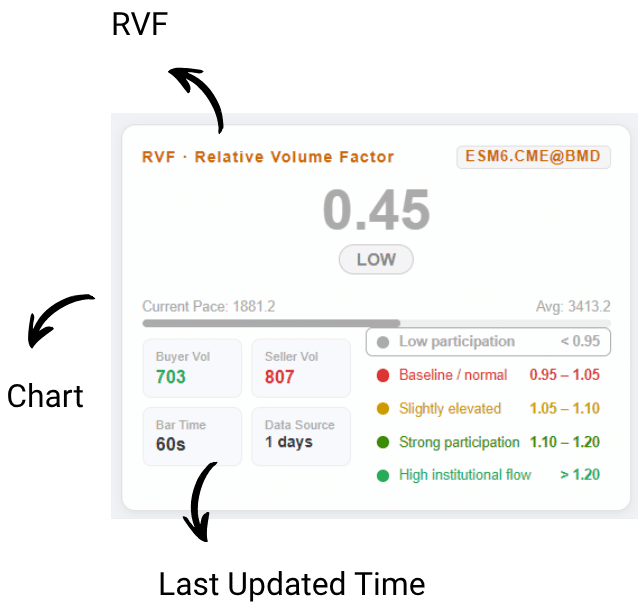
A. Status bar
Shows connection status for:
- RVF
- Chart
- last update time
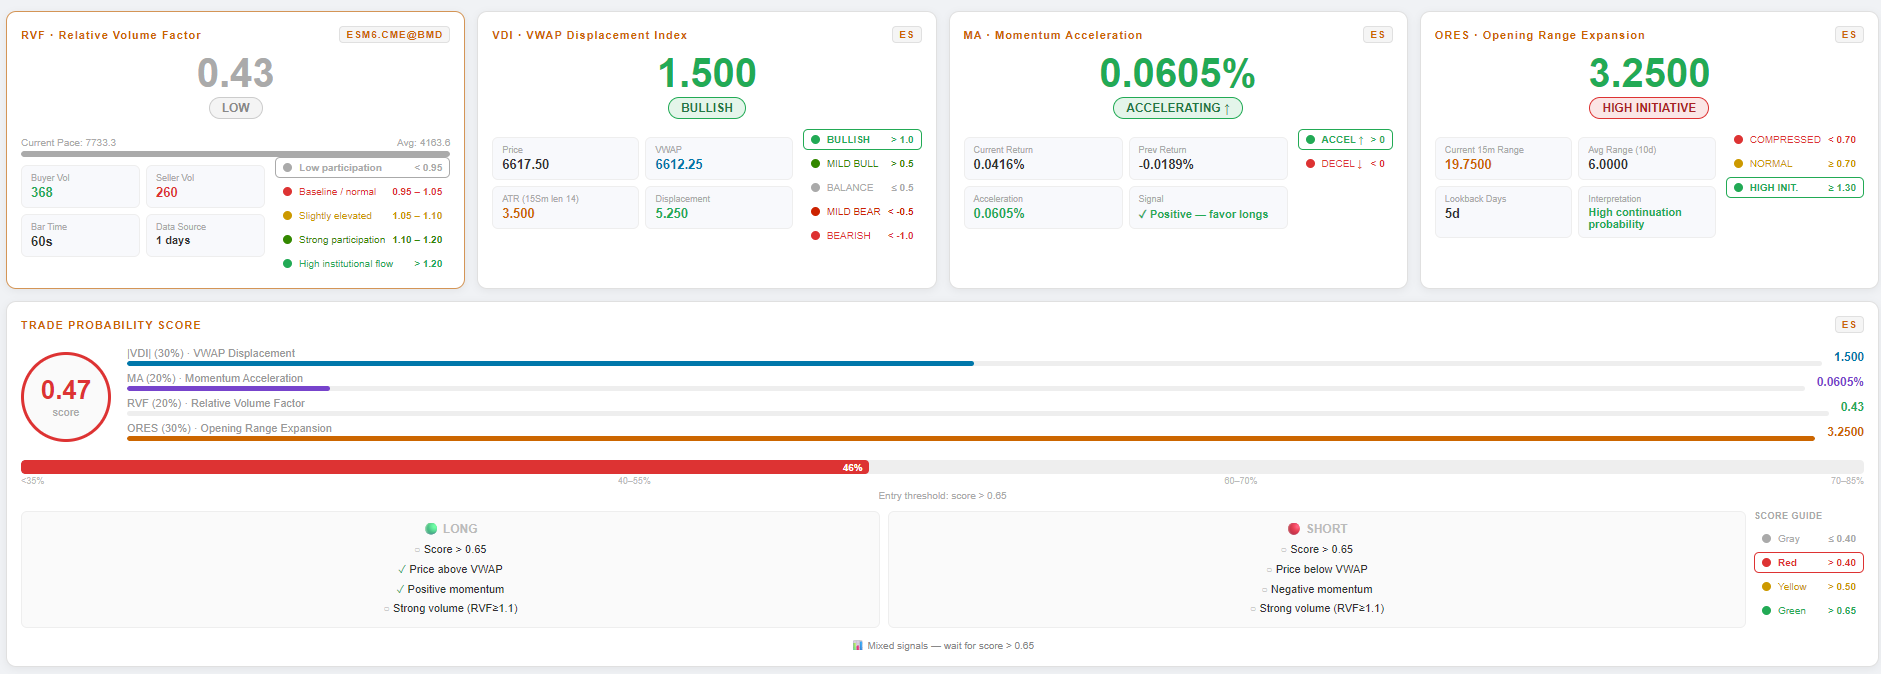
B. Indicator cards
There are 4 main indicator panels:
- RVF
- VDI
- MA
- ORES
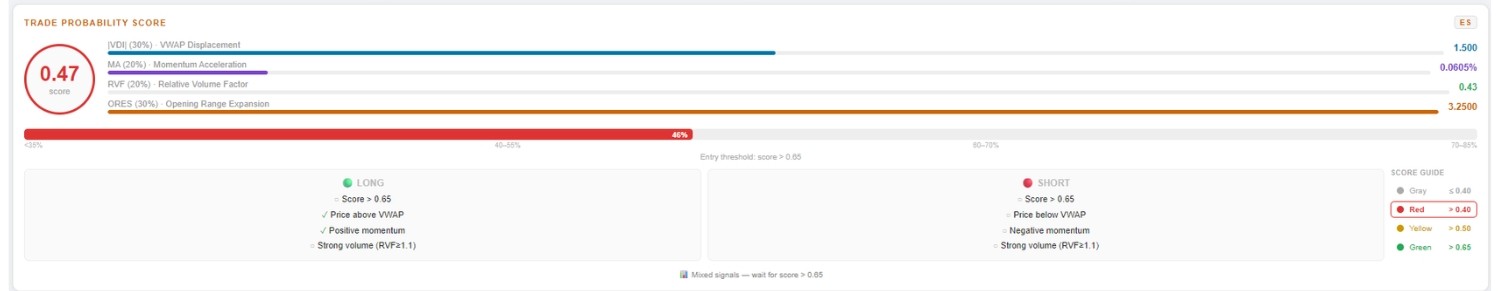
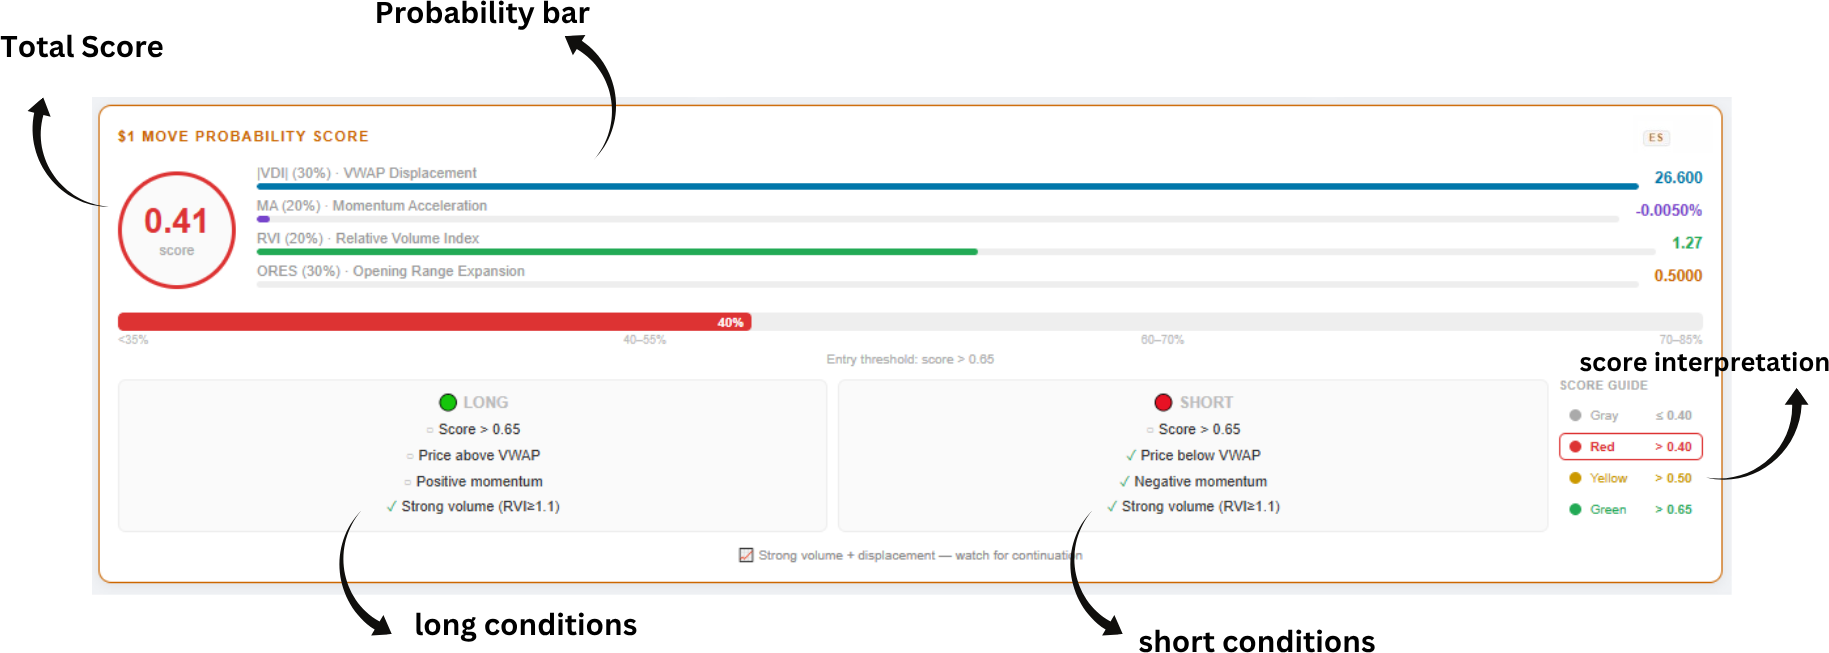
C. Score card
This shows:
- total score
- probability bar
- long conditions
- short conditions
- score interpretation
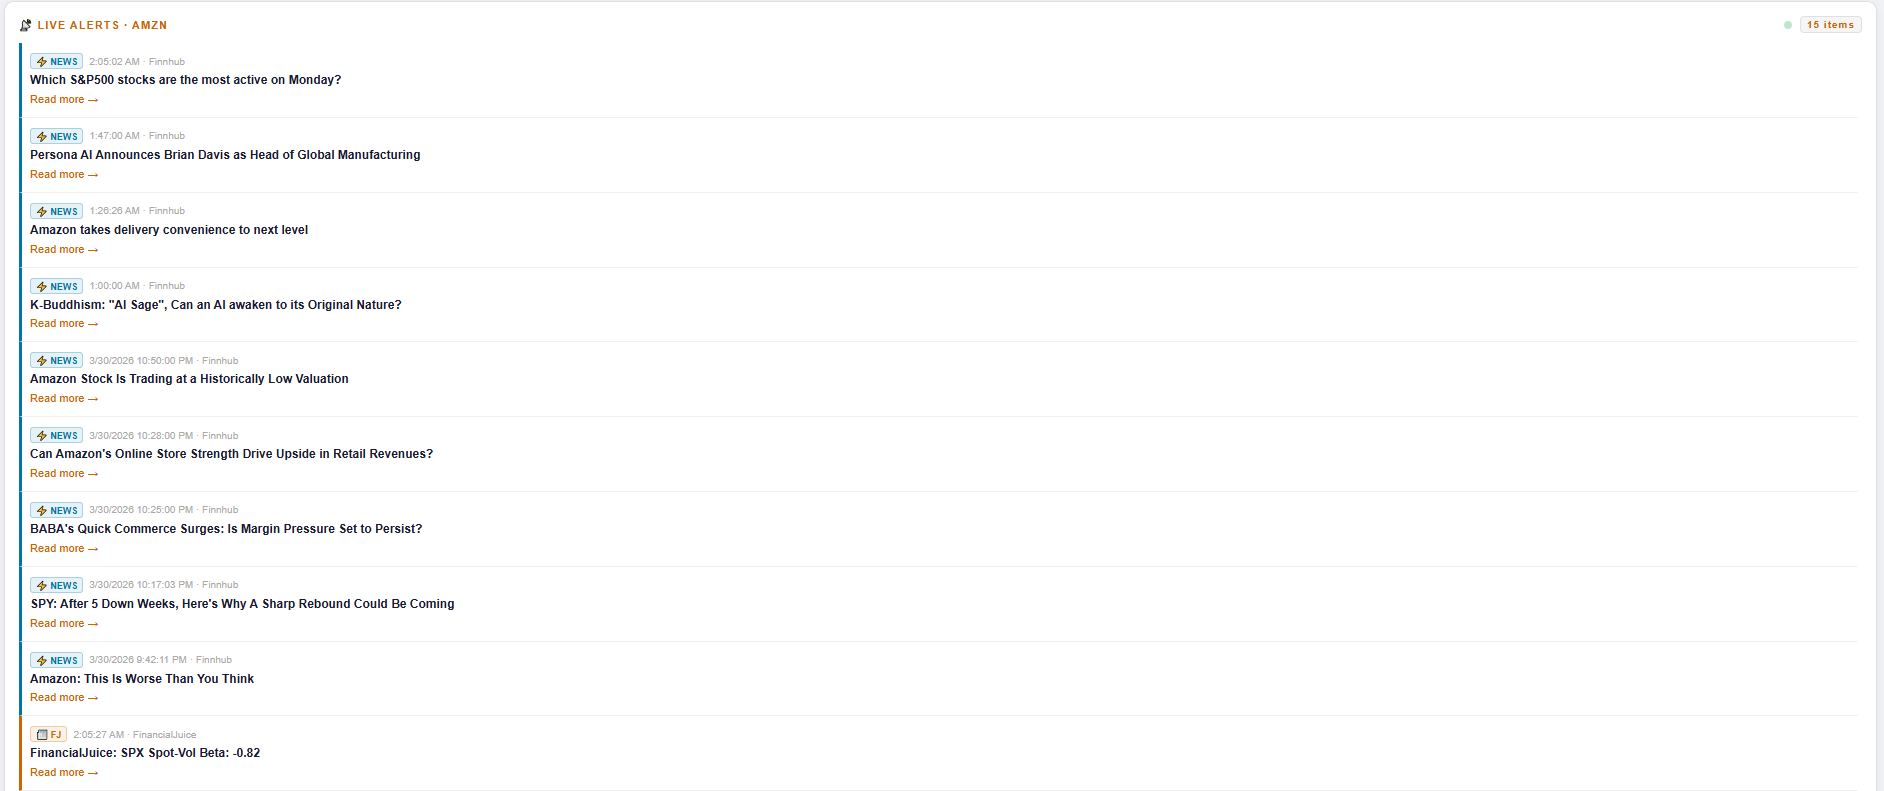
D. Live alerts feed
Shows live news and alerts connected to the active stock and relevant market topics.
The 4 indicators explained simply
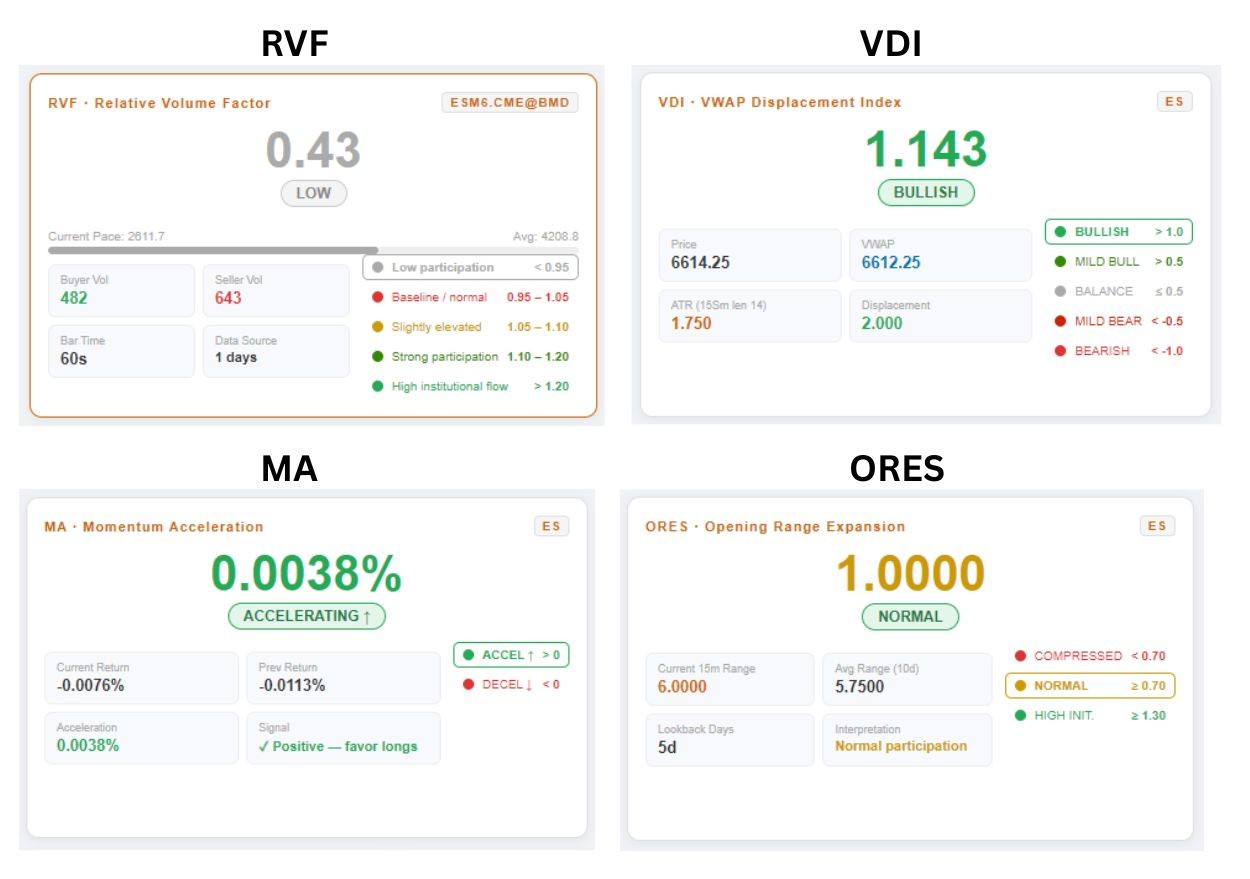
RVF = Relative Volume Factor
This shows how strong the current trading volume is compared to normal volume conditions.
The file uses these thresholds:
- Gray: below 0.95
- Red: 0.95 - 1.05
- Yellow: 1.05 - 1.10
- Green: 1.10 - 1.20
- Bright Green: above 1.20
Easy meaning
- very low RVF = weak participation
- low RVF = baseline/normal
- normal RVF = slightly elevated
- high RVF = strong interest
- very high RVF = unusually strong participation
What to teach users
RVF helps answer:
“Are enough traders participating for this move to matter?”

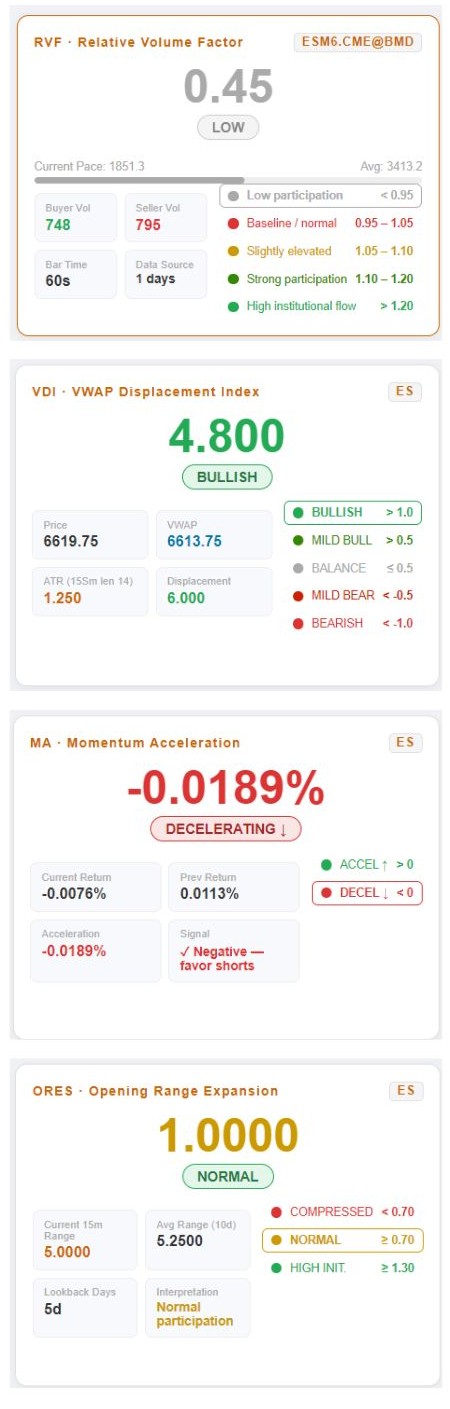
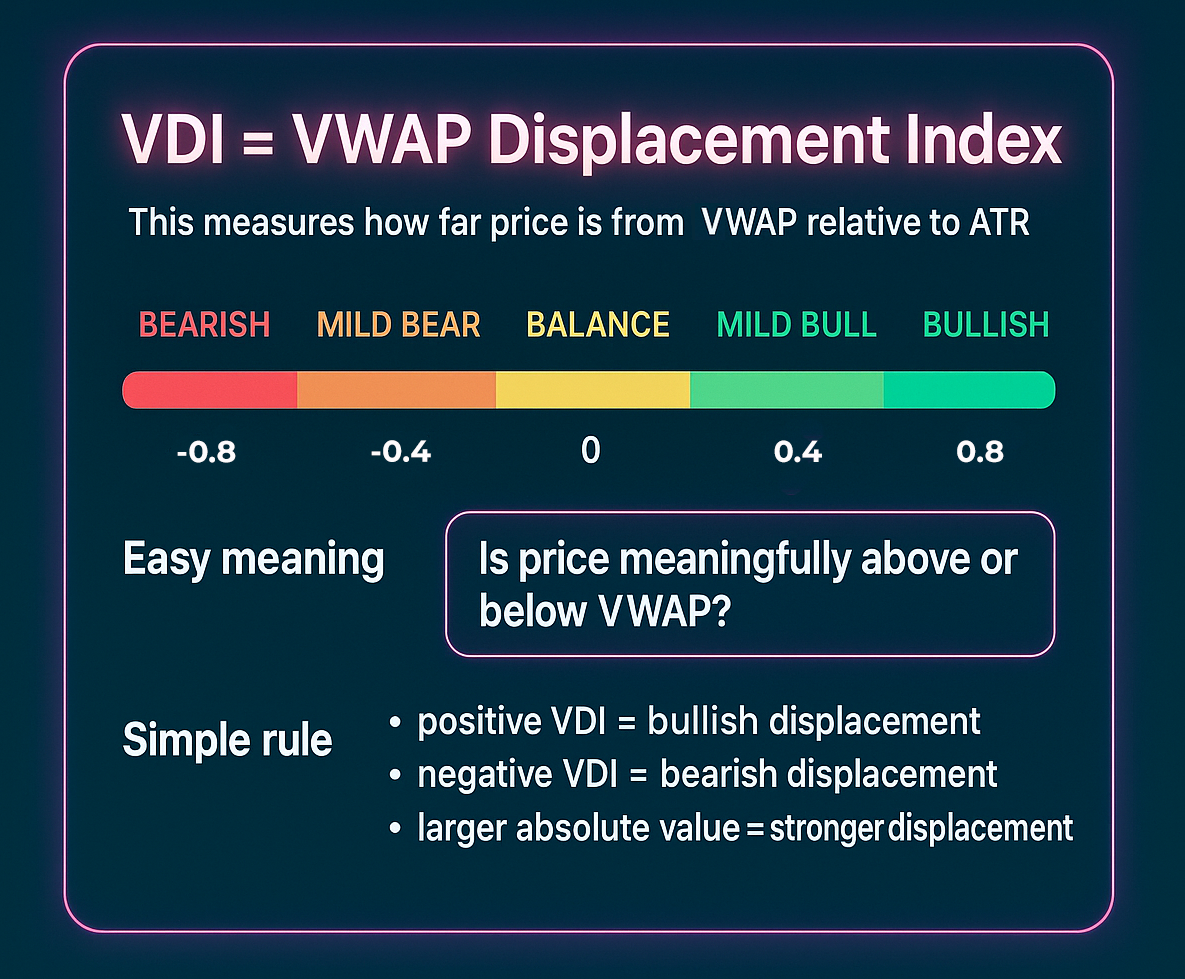
VDI = VWAP Displacement Index
This measures how far price is from VWAP relative to ATR.
The file labels VDI like this:
- BULLISH if above 0.8
- MILD BULL if above 0.4
- BALANCE near the middle
- MILD BEAR if below -0.4
- BEARISH if below -0.8
Easy meaning
VDI helps answer:
“Is price meaningfully above or below VWAP?”
Simple rule
- positive VDI = bullish displacement
- negative VDI = bearish displacement
- larger absolute value = stronger displacement
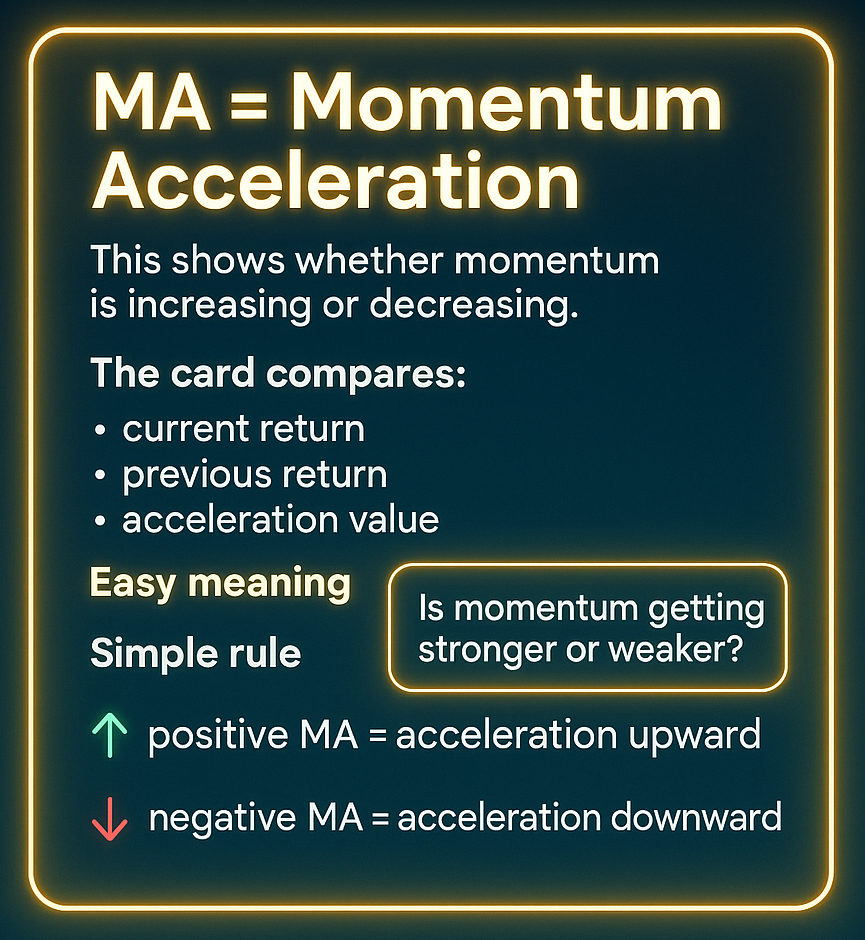
MA = Momentum Acceleration
This shows whether momentum is increasing or decreasing.
The card compares:
- current return
- previous return
- acceleration value
Easy meaning
MA helps answer:
“Is momentum getting stronger or weaker?”
Simple rule
- positive MA = acceleration upward
- negative MA = acceleration downward
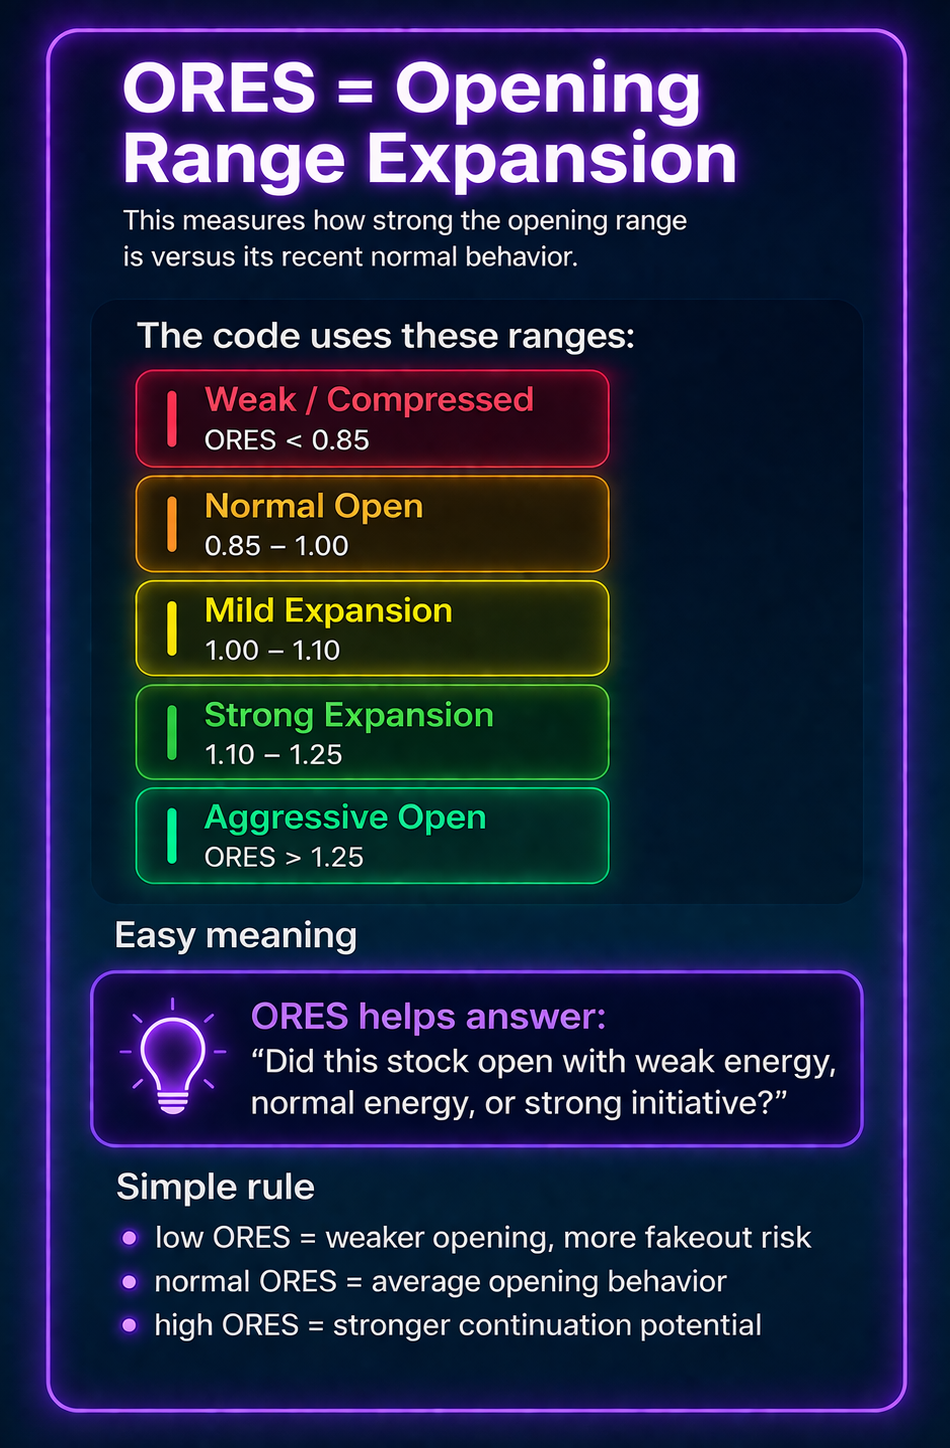
ORES = Opening Range Expansion
This measures how strong the opening range is versus its recent normal behavior.
The code uses these ranges:
- Weak / Compressed (ORES < 0.85)
- Normal Open (0.85 – 1.00)
- Mild Expansion (1.00 – 1.10)
- Strong Expansion (1.10 – 1.25)
- Aggressive Open (ORES > 1.25)
Easy meaning
ORES helps answer:
“Did this stock open with weak energy, normal energy, or strong initiative?”
Simple rule
- low ORES = weaker opening, more fakeout risk
- normal ORES = average opening behavior
- high ORES = stronger continuation potential
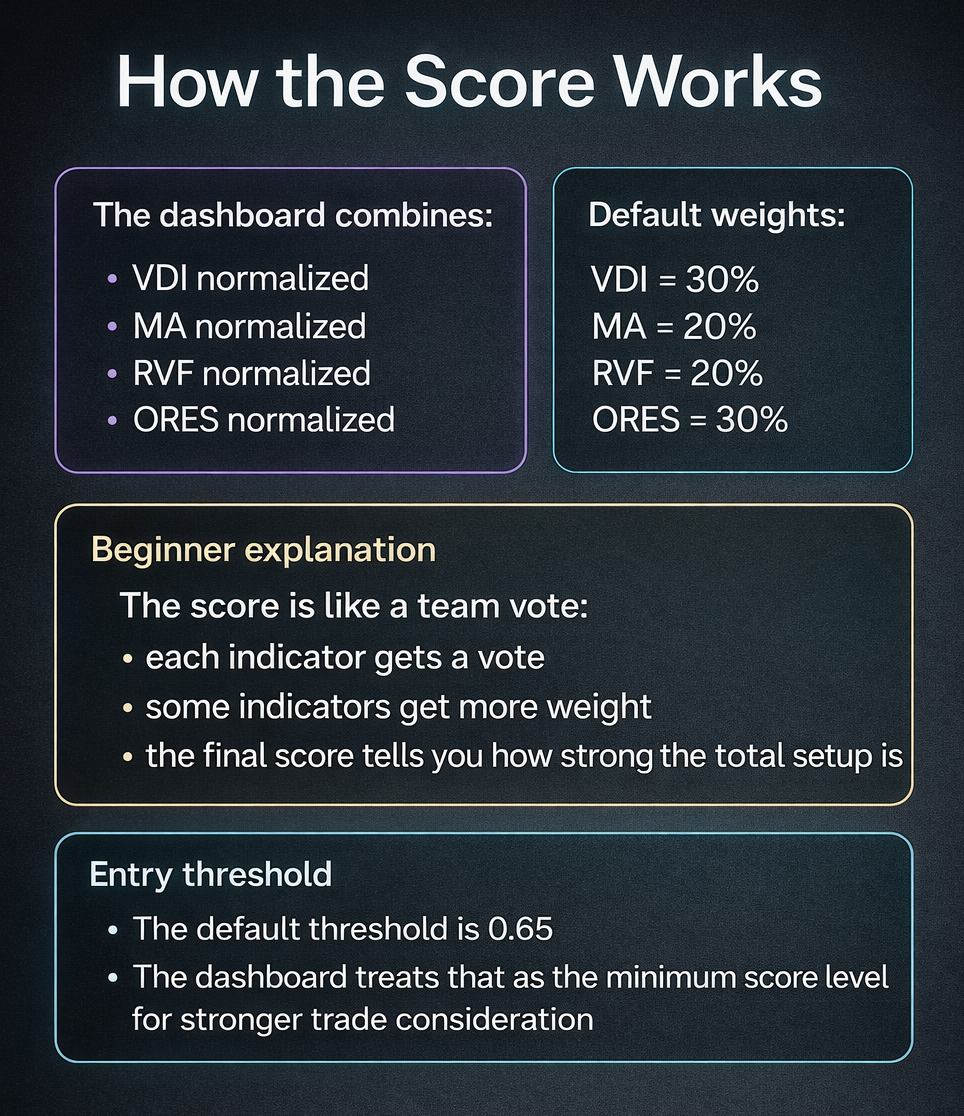
How the score works
The dashboard combines:
- VDI normalized
- MA normalized
- RVF normalized
- ORES normalized
Then it applies weights.
Default weights in the file:
- VDI = 30%
- MA = 20%
- RVF = 20%
- ORES = 30%
Beginner explanation
The score is like a team vote:
- each indicator gets a vote
- some indicators get more weight
- the final score tells you how strong the total setup is
Entry threshold
The default tradeable threshold is 0.60. The dashboard treats that as the minimum score level for trade consideration. For stronger setup you can trade at 0.70 - 0.80 threshold.
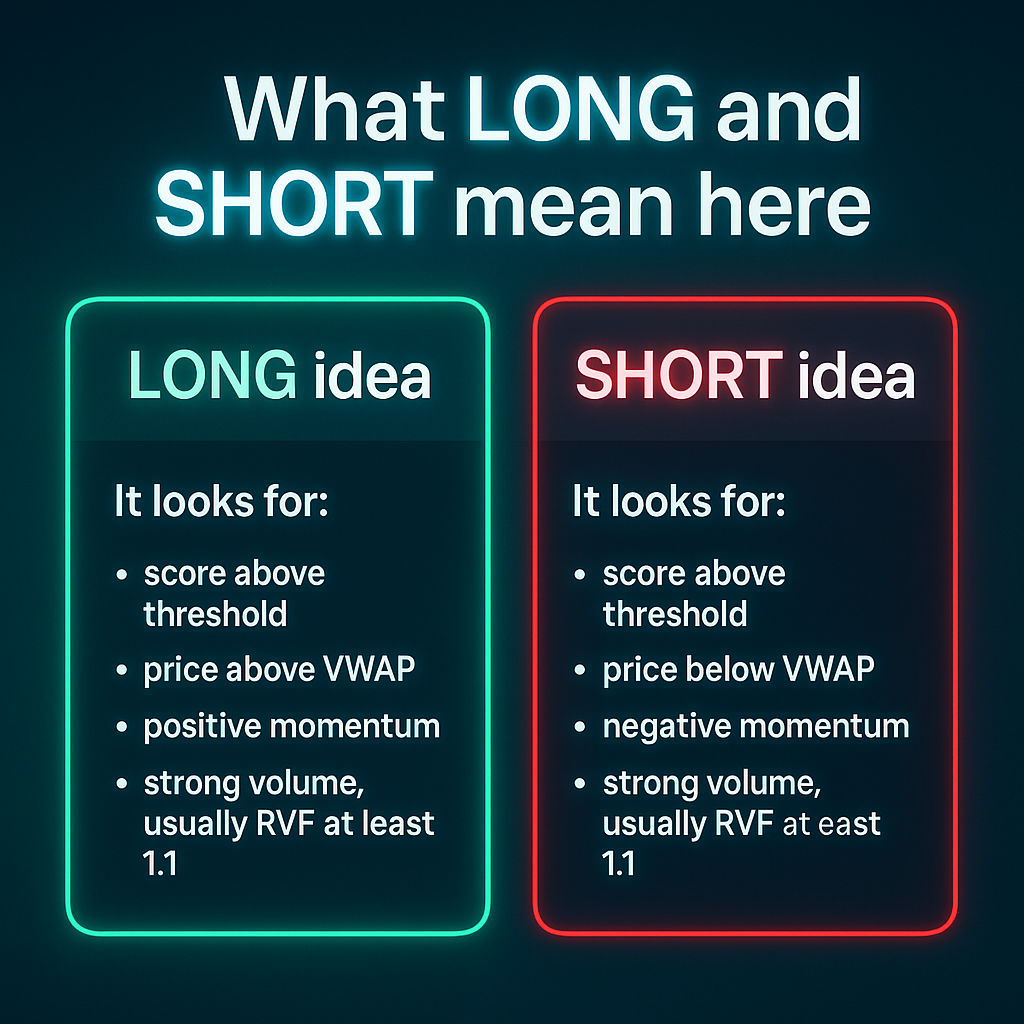
What LONG and SHORT mean here
The dashboard checks conditions before highlighting a direction.
LONG idea
It looks for:
- score above threshold
- price above VWAP
- positive momentum
- strong volume, usually RVF at least 1.1
SHORT idea
It looks for:
- score above threshold
- price below VWAP
- negative momentum
- strong volume, usually RVF at least 1.1
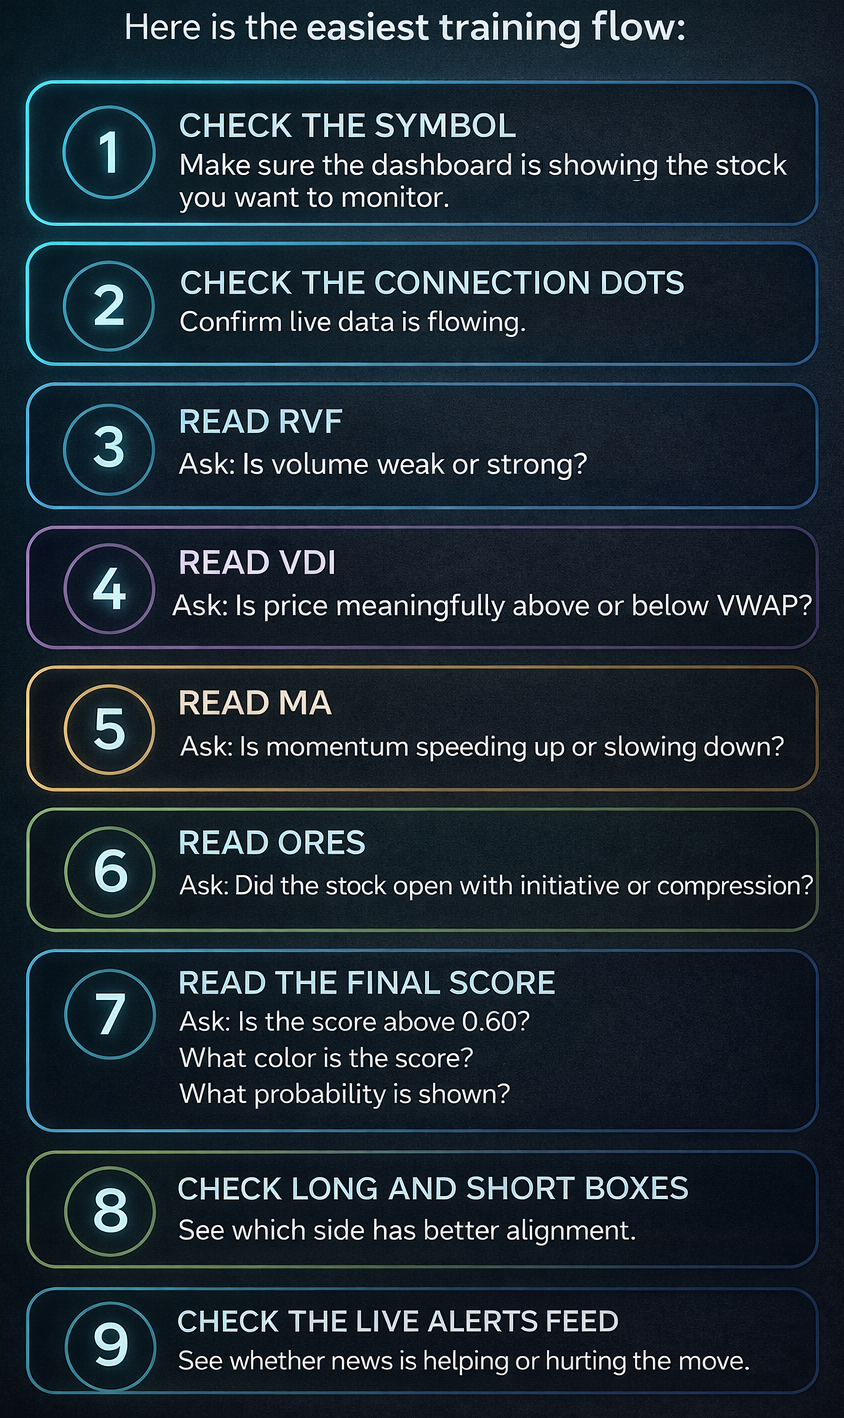
No-brainer workflow for any stock
Here is the easiest training flow:
- Check the symbol
Make sure the dashboard is showing the stock you want to monitor. - Check the connection dots
Confirm live data is flowing. - Read RVF
Ask:
Is volume weak or strong? - Read VDI
Ask:
Is price meaningfully above or below VWAP? - Read MA
Ask:
Is momentum speeding up or slowing down? - Read ORES
Ask:
Did the stock open with initiative or compression? - Read the final score
Ask:
Is the score above 0.60?
What color is the score?
What probability is shown? - Check LONG and SHORT boxes
See which side has better alignment. - Check the live alerts feed
See whether news is helping or hurting the move.
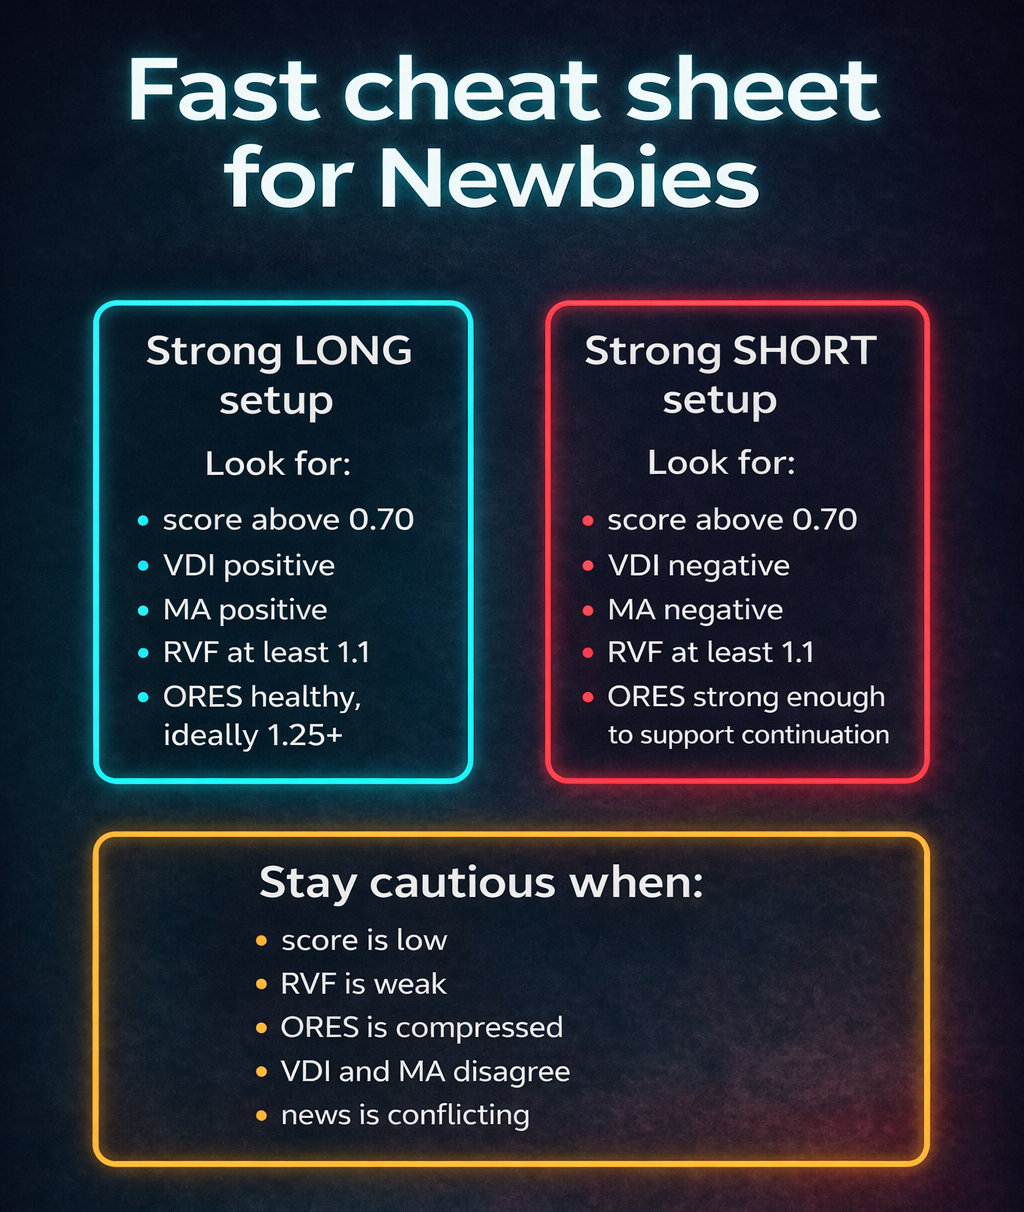
Fast cheat sheet for Newbies
Strong LONG setup
Look for:
- score above 0.70
- VDI positive
- MA positive
- RVF at least 1.1
- ORES healthy, ideally 1.25+
Strong SHORT setup
Look for:
- score above 0.70
- VDI negative
- MA negative
- RVF at least 1.1
- ORES strong enough to support continuation
Stay cautious when:
- score is low
- RVF is weak
- ORES is compressed
- VDI and MA disagree
- news is conflicting