RVF Full Screen Chart
Contact customer support at support@spxdirection.com
RVF Fullscreen Chart
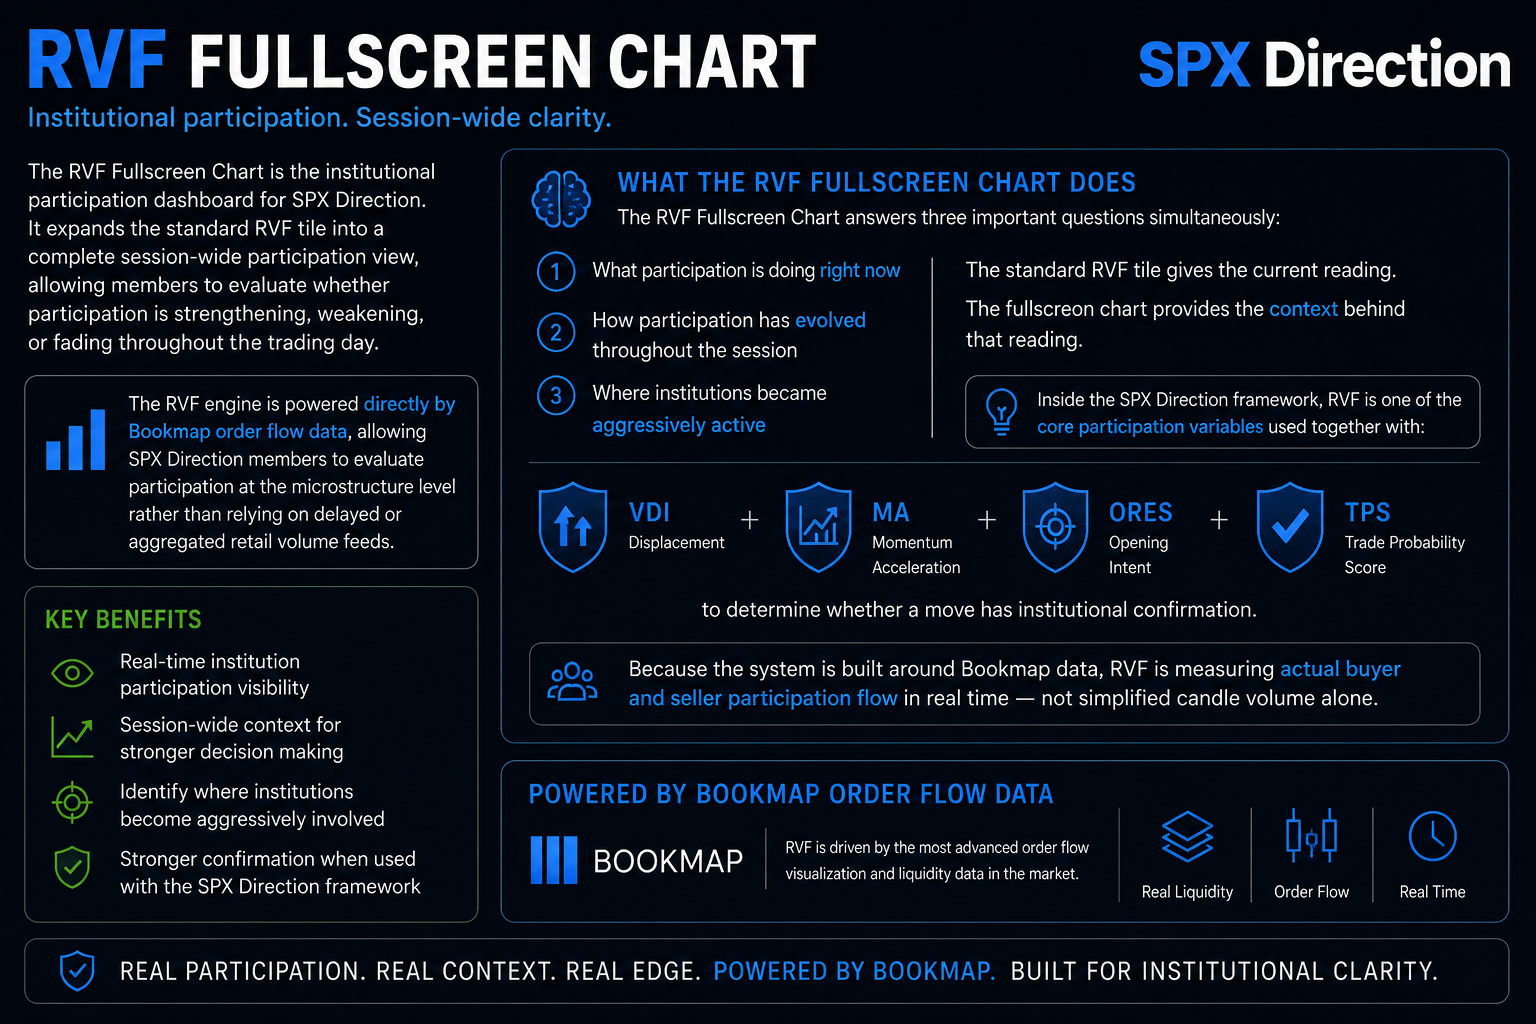
The RVF Fullscreen Chart is the institutional participation dashboard for SPX Direction. It expands the standard RVF tile into a complete session-wide participation view, allowing members to evaluate whether participation is strengthening, weakening, or fading throughout the trading day.
The RVF engine is powered directly by Bookmap order flow data, allowing SPX Direction members to evaluate participation at the microstructure level rather than relying on delayed or aggregated retail volume feeds.
🧠 WHAT THE RVF FULLSCREEN CHART DOES
The RVF Fullscreen Chart answers three important questions simultaneously:
- What participation is doing right now
- How participation has evolved throughout the session
- Where institutions became aggressively active
The standard RVF tile gives the current reading.
The fullscreen chart provides the context behind that reading.
Inside the SPX Direction framework, RVF is one of the core participation variables used together with:
- VDI (displacement)
- MA (momentum acceleration)
- ORES (opening intent)
- TPS (trade probability score)
to determine whether a move has institutional confirmation.
Because the system is built around Bookmap data, RVF is measuring actual buyer and seller participation flow in real time — not simplified candle volume alone.
🧠 HOW BOOKMAP POWERS RVF
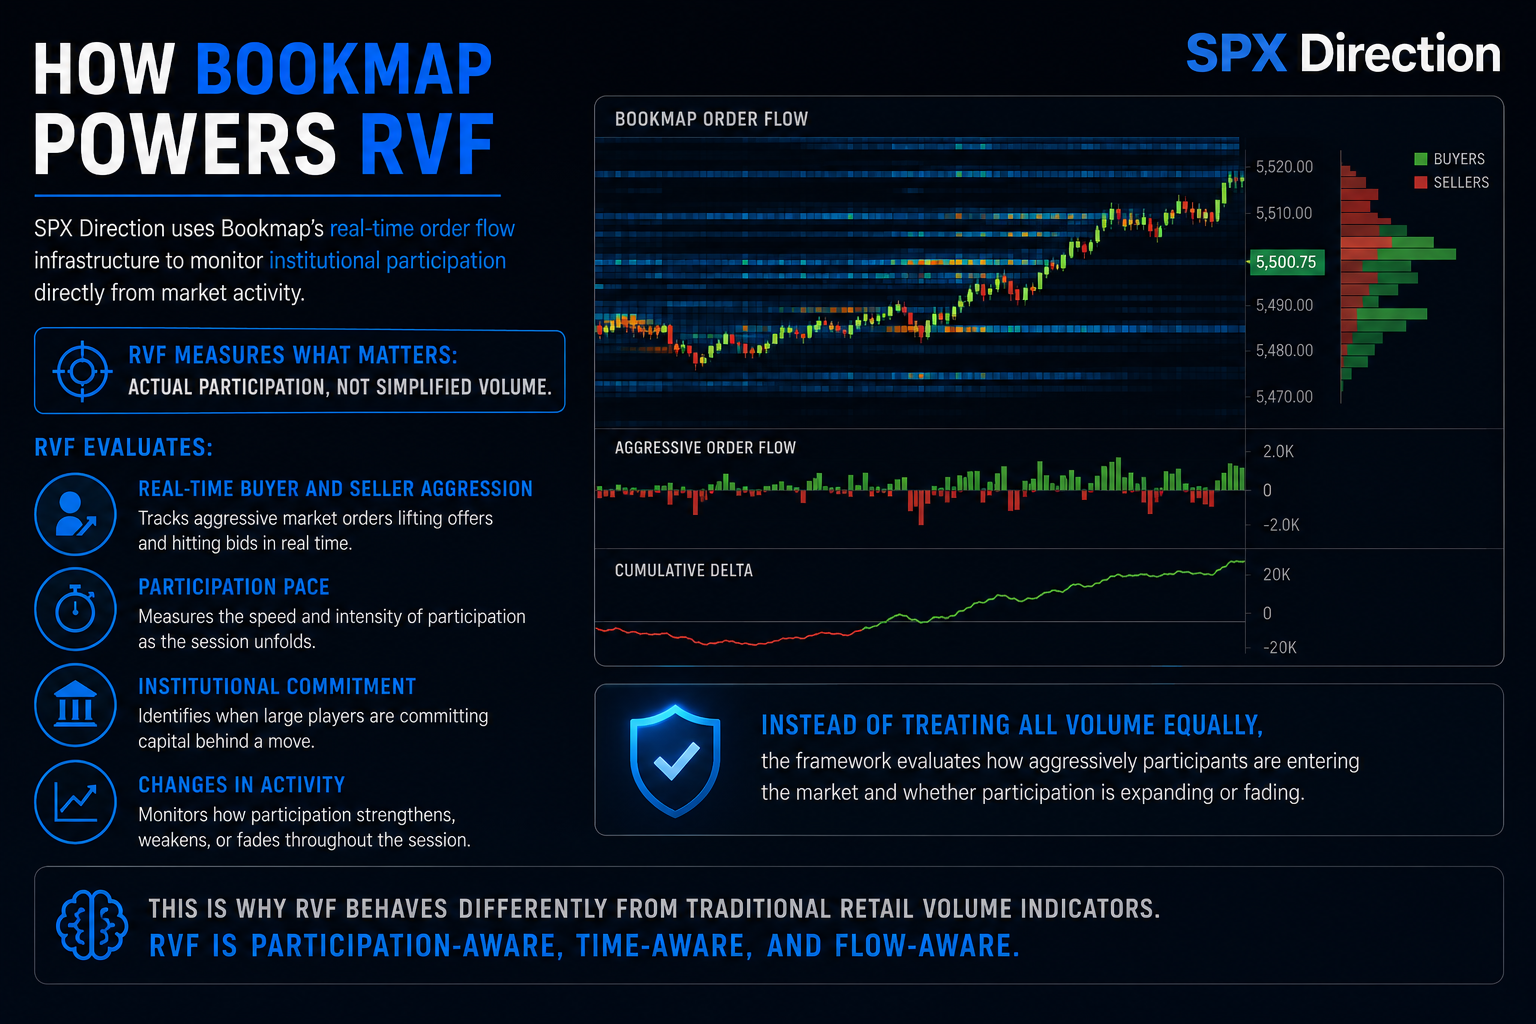
SPX Direction uses Bookmap’s real-time order flow infrastructure to monitor institutional participation directly from market activity.
This allows RVF to evaluate:
- Real-time buyer and seller aggression
- Participation pace
- Institutional commitment
- Changes in activity throughout the session
Instead of treating all volume equally, the framework evaluates how aggressively participants are entering the market and whether participation is expanding or fading.
This is why RVF behaves differently from traditional retail volume indicators.
RVF is participation-aware, time-aware, and flow-aware.
🧠 WHAT RVF MEASURES
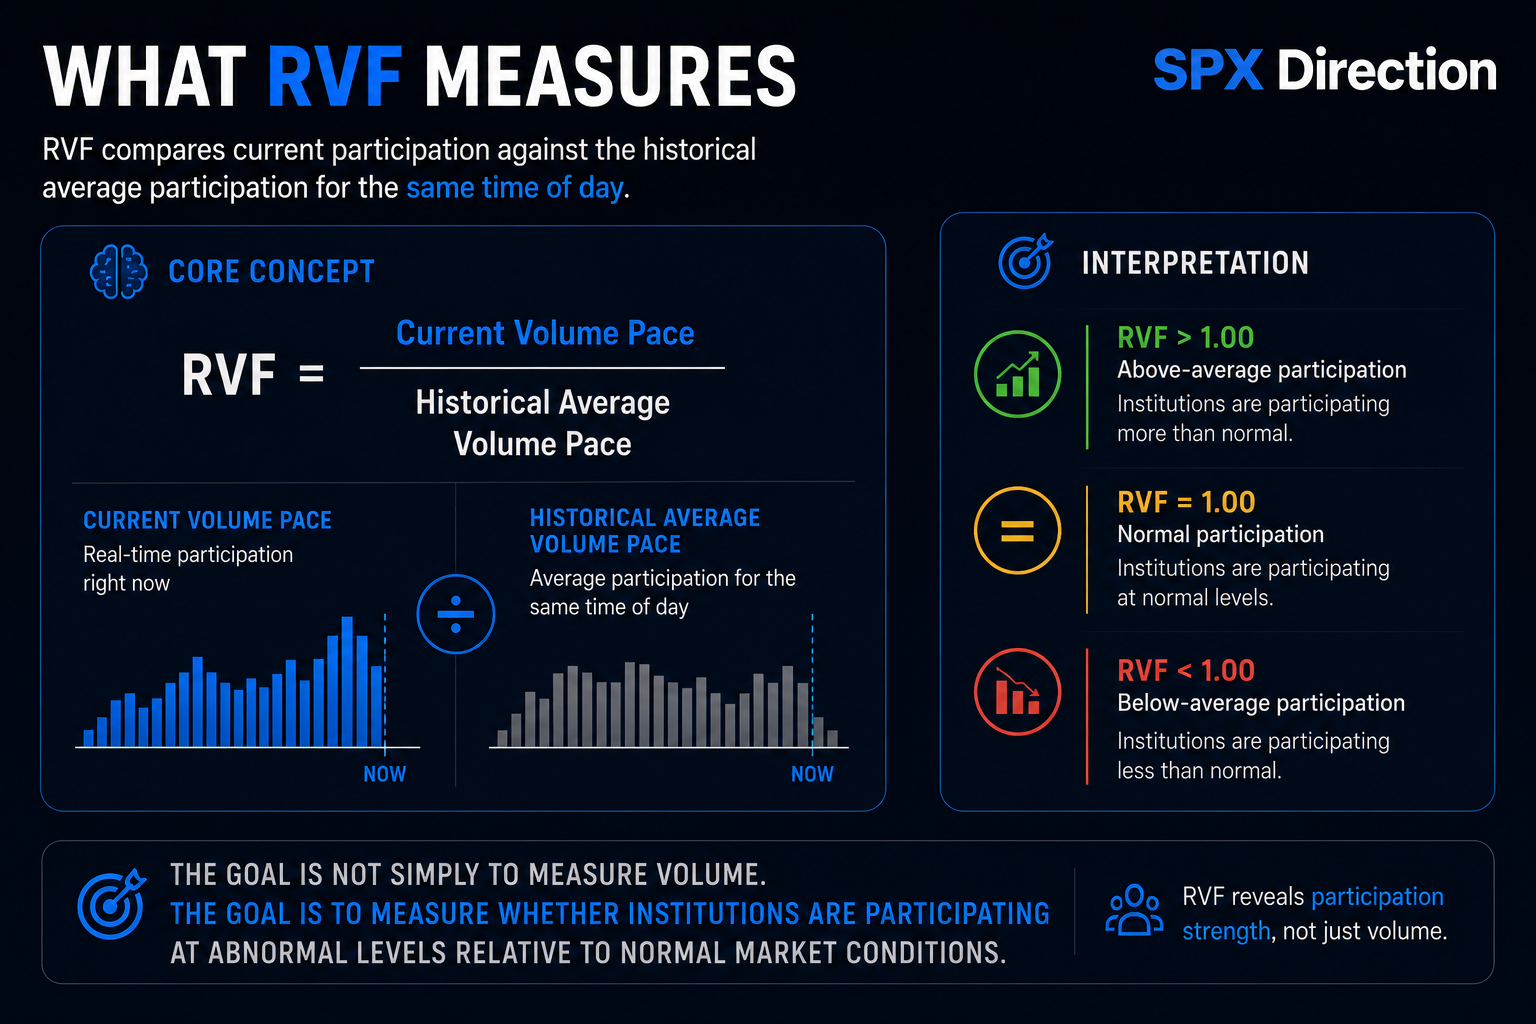
RVF compares current participation against the historical average participation for the same time of day.
Core concept:
RVF = Current Volume Pace ÷ Historical Average Volume Pace
Interpretation:
- RVF > 1.00 → above-average participation
- RVF = 1.00 → normal participation
- RVF < 1.00 → below-average participation
The goal is not simply to measure volume.
The goal is to measure whether institutions are participating at abnormal levels relative to normal market conditions.
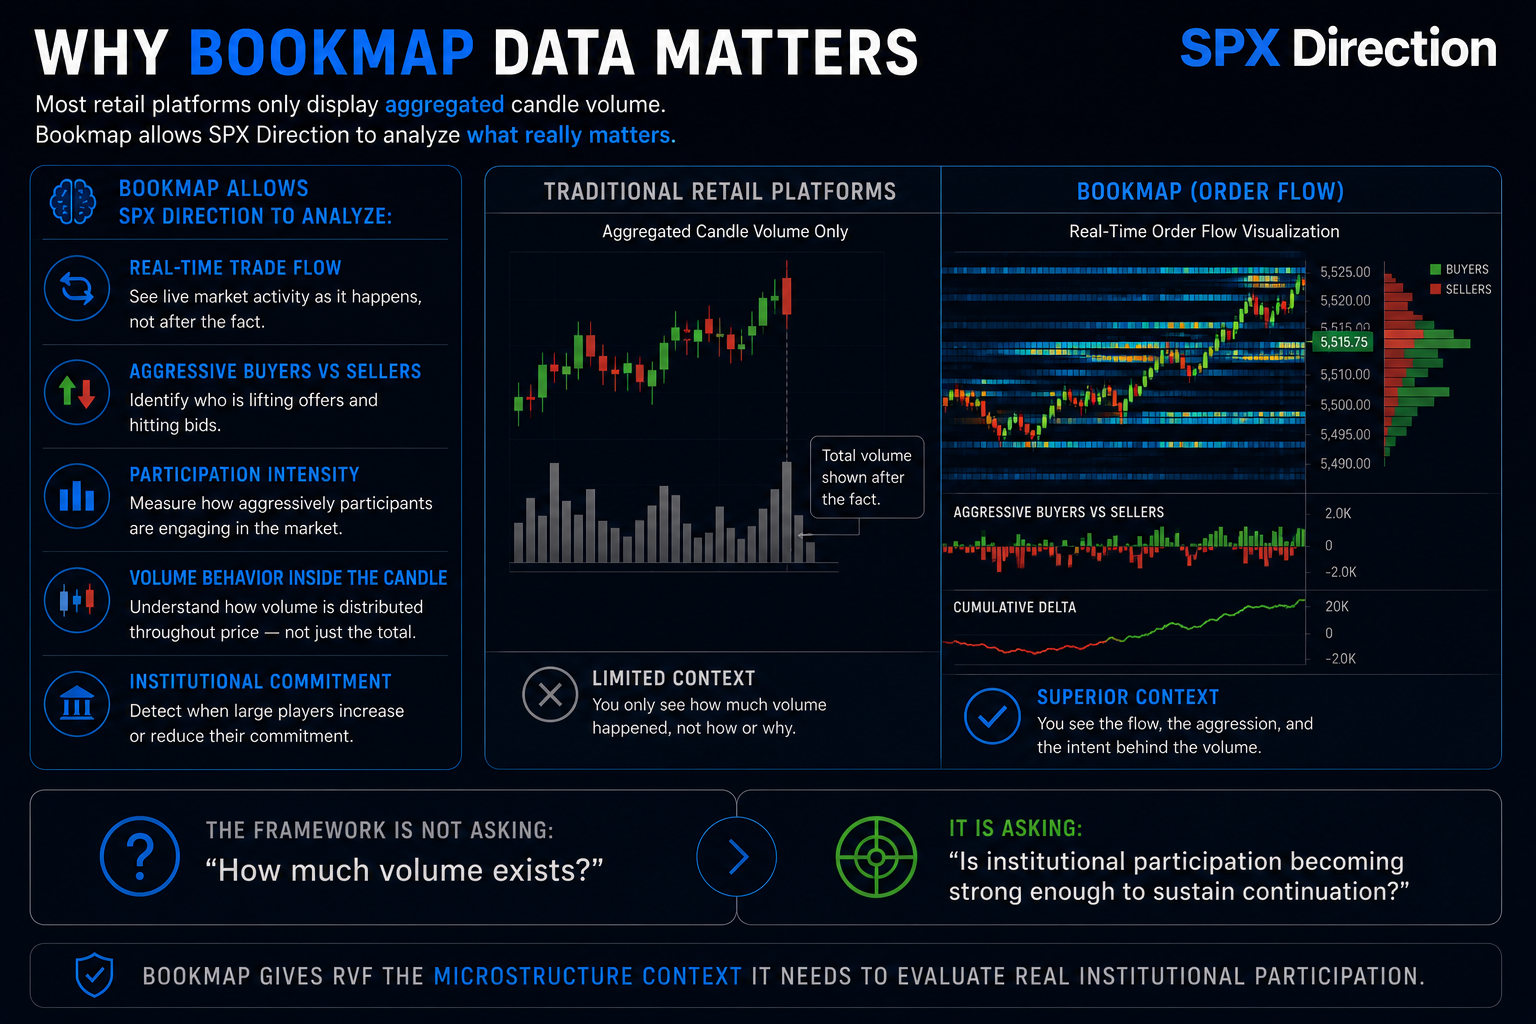
🧠 WHY BOOKMAP DATA MATTERS
Most retail platforms only display aggregated candle volume.
Bookmap allows SPX Direction to analyze:
- Real-time trade flow
- Aggressive buyers vs sellers
- Participation intensity
- Volume behavior inside the candle
- Institutional commitment changes over time
This gives RVF significantly more context than traditional volume indicators.
The framework is not asking:
“How much volume exists?”
It is asking:
“Is institutional participation becoming strong enough to sustain continuation?”
🧠 RVF PARTICIPATION ZONES
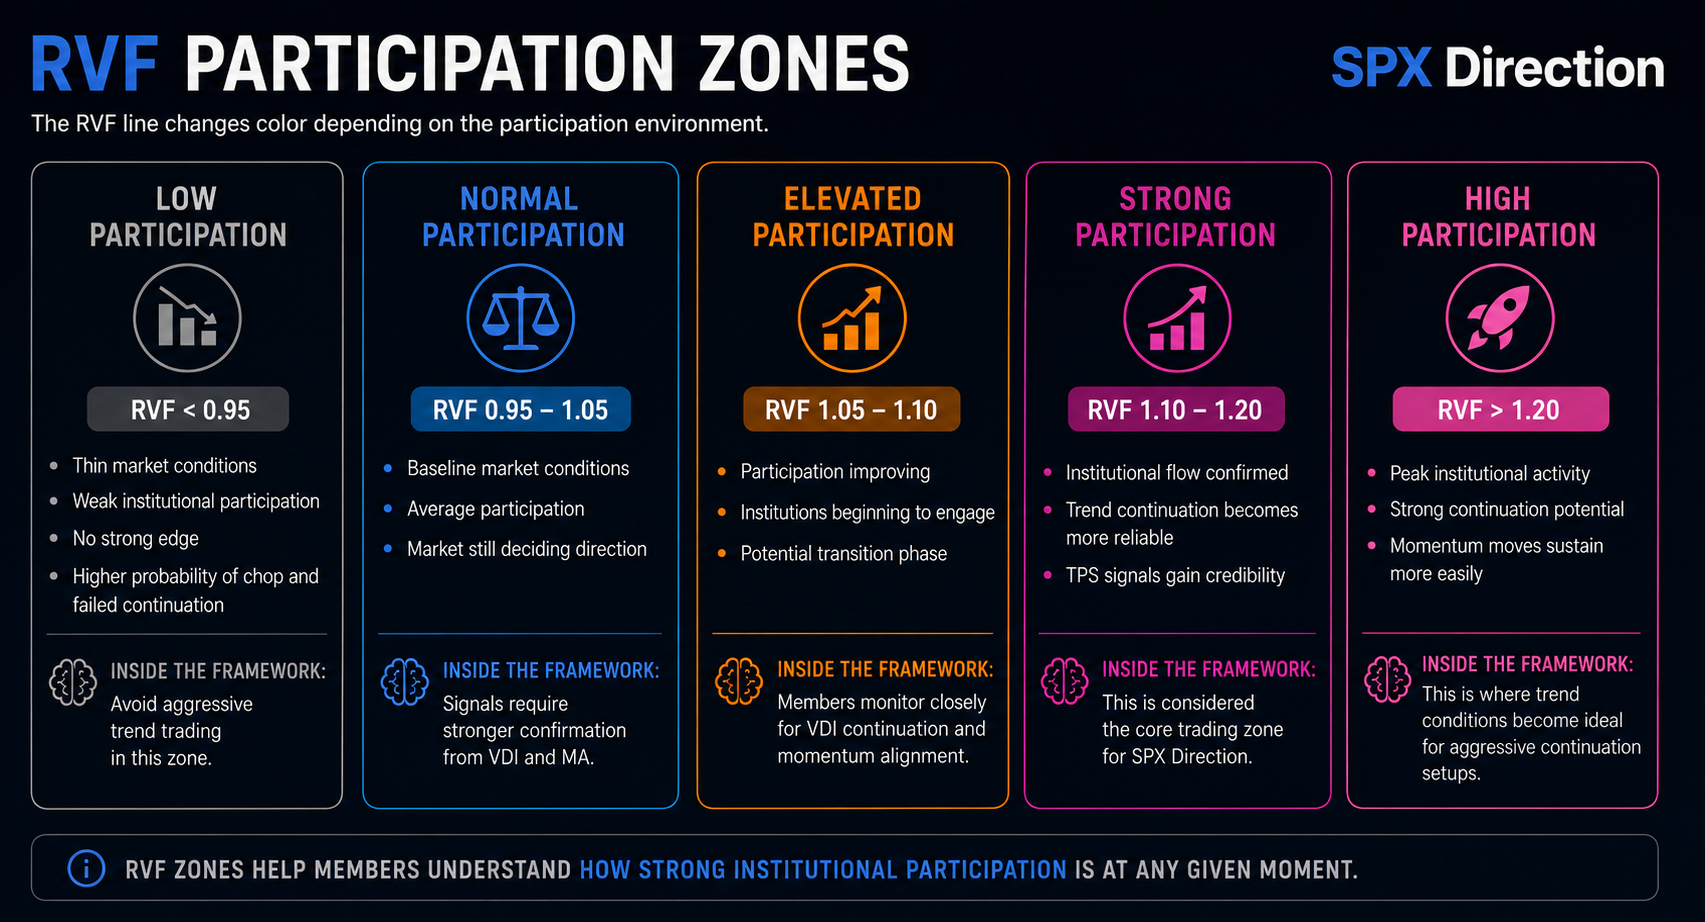
The RVF line changes color depending on the participation environment.
🔘 LOW PARTICIPATION
RVF < 0.95
- Thin market conditions
- Weak institutional participation
- No strong edge
- Higher probability of chop and failed continuation
Inside the SPX Direction framework:
Avoid aggressive trend trading in this zone.
🔵 NORMAL PARTICIPATION
RVF 0.95 – 1.05
- Baseline market conditions
- Average participation
- Market still deciding direction
Inside the framework:
Signals require stronger confirmation from VDI and MA.
🟠 ELEVATED PARTICIPATION
RVF 1.05 – 1.10
- Participation improving
- Institutions beginning to engage
- Potential transition phase
Inside the framework:
Members monitor closely for VDI continuation and momentum alignment.
🟣 STRONG PARTICIPATION
RVF 1.10 – 1.20
- Institutional flow confirmed
- Trend continuation becomes more reliable
- TPS signals gain credibility
Inside the framework:
This is considered the core trading zone for SPX Direction.
🌸 HIGH PARTICIPATION
RVF > 1.20
- Peak institutional activity
- Strong continuation potential
- Momentum moves sustain more easily
Inside the framework:
This is where trend conditions become ideal for aggressive continuation setups.
🧠 HOW TO READ THE RVF LINE
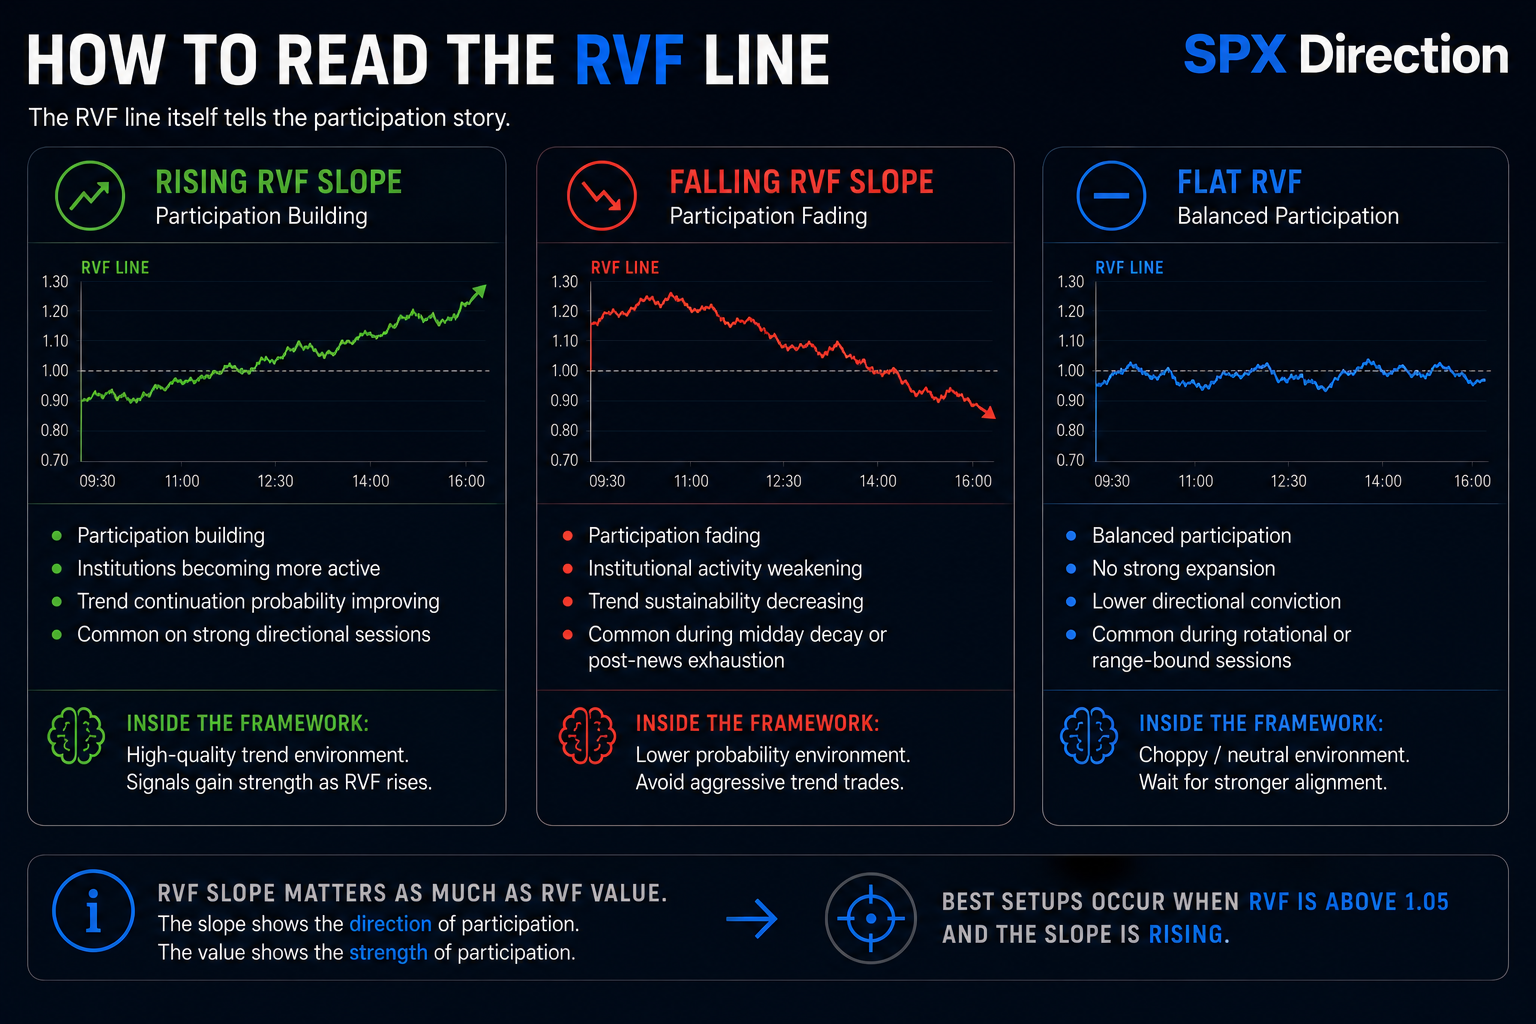
The RVF line itself tells the participation story.
Rising RVF Slope
- Participation building
- Institutions becoming more active
- Trend continuation probability improving
Common on strong directional sessions.
Falling RVF Slope
- Participation fading
- Institutional activity weakening
- Trend sustainability decreasing
Common during midday decay or post-news exhaustion.
Flat RVF
- Balanced participation
- No strong expansion
- Lower directional conviction
Common during rotational or range-bound sessions.
🧠 ZONE TRANSITION MARKERS
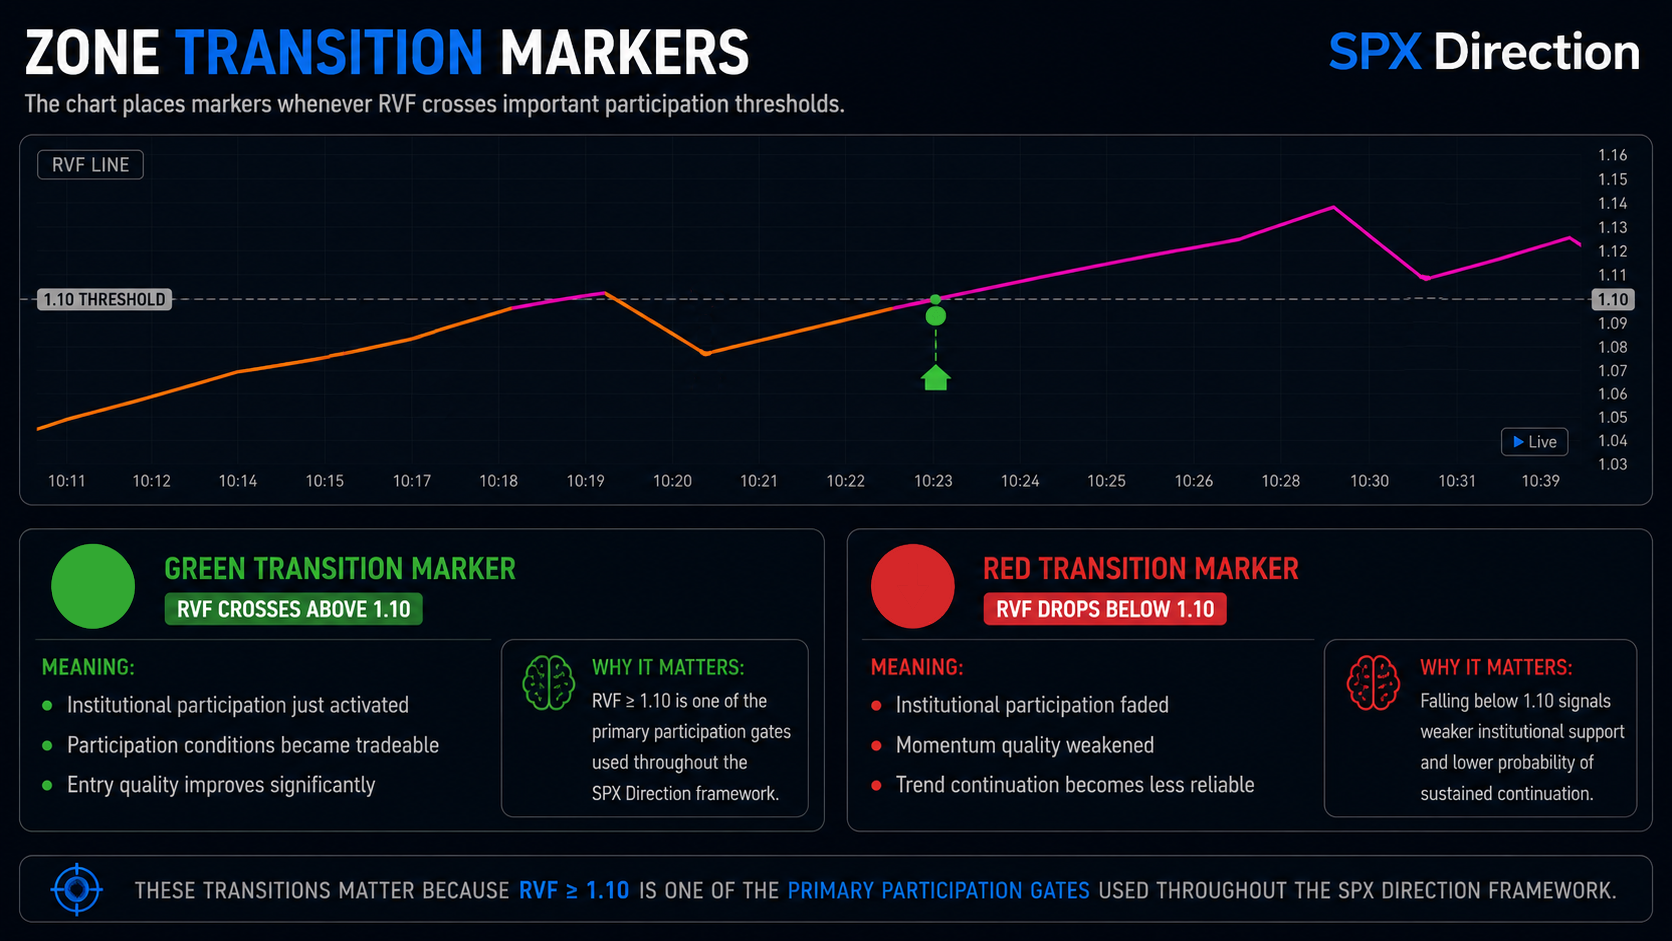
The chart places markers whenever RVF crosses important participation thresholds.
🟢 Green Transition Marker
RVF crosses above 1.10
Meaning:
- Institutional participation just activated
- Participation conditions became tradeable
- Entry quality improves significantly
🔴 Red Transition Marker
RVF drops below 1.10
Meaning:
- Institutional participation faded
- Momentum quality weakened
- Trend continuation becomes less reliable
These transitions matter because RVF ≥ 1.10 is one of the primary participation gates used throughout the SPX Direction framework.
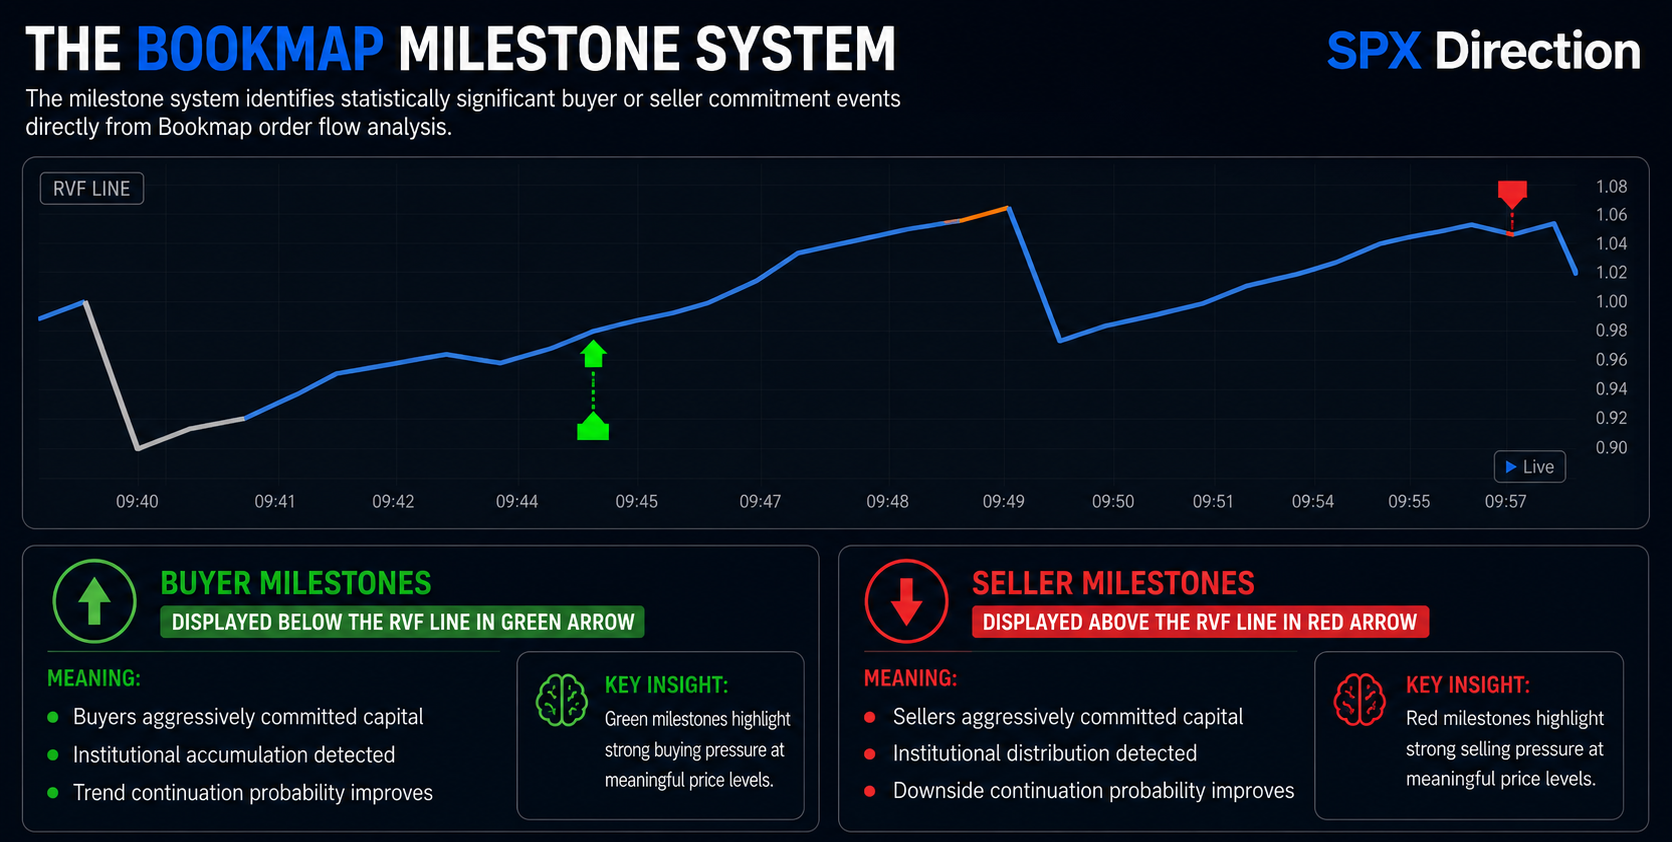
🧠 THE BOOKMAP MILESTONE SYSTEM
The milestone system identifies statistically significant buyer or seller commitment events directly from Bookmap order flow analysis.
These are not ordinary volume spikes.
They represent aggressive institutional participation concentrated at meaningful price levels.
Buyer Milestones
Displayed below the RVF line in green arrow.
Meaning:
- Buyers aggressively committed capital
- Institutional accumulation detected
- Trend continuation probability improves
Seller Milestones
Displayed above the RVF line in red arrow.
Meaning:
- Sellers aggressively committed capital
- Institutional distribution detected
- Downside continuation probability improves
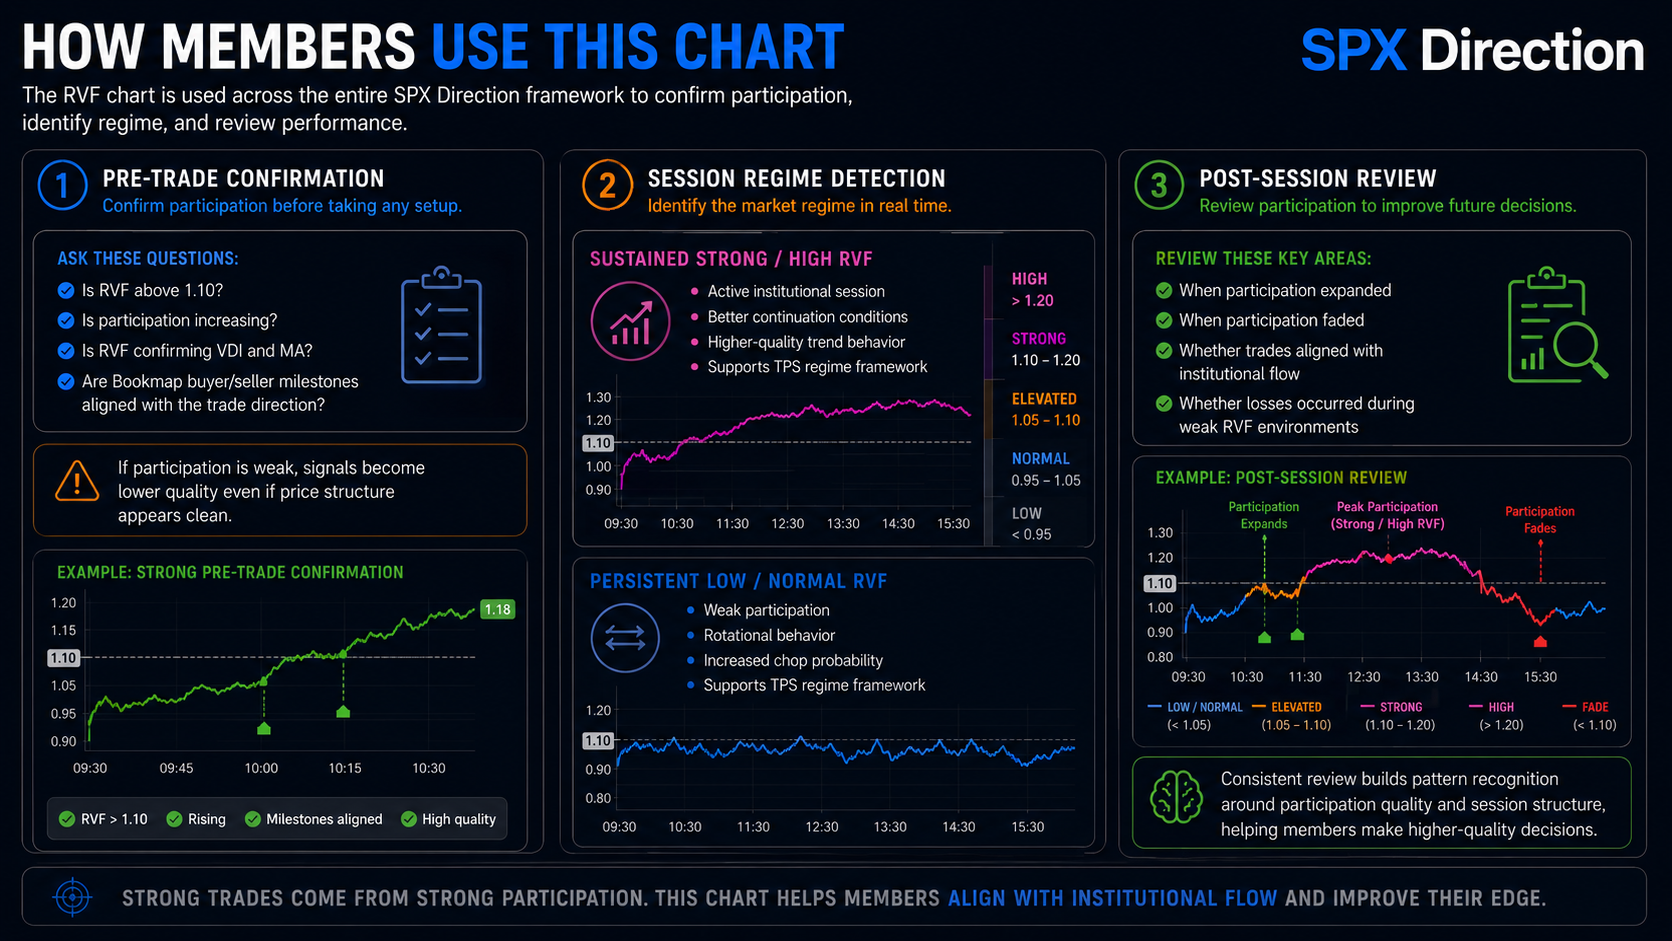
🧠 HOW MEMBERS USE THIS CHART
PRE-TRADE CONFIRMATION
Before entering any setup:
Ask:
- Is RVF above 1.10?
- Is participation increasing?
- Is RVF confirming VDI and MA?
- Are Bookmap buyer/seller milestones aligned with the trade direction?
If participation is weak, signals become lower quality even if price structure appears clean.
🧠 SESSION REGIME DETECTION
The RVF chart helps identify market regime.
Sustained Strong/High RVF
Usually means:
- Active institutional session
- Better continuation conditions
- Higher-quality trend behavior
Persistent Low/Normal RVF
Usually means:
- Weak participation
- Rotational behavior
- Increased chop probability
This directly supports the TPS regime framework used throughout SPX Direction.
🧠 POST-SESSION REVIEW
Members can review:
- When participation expanded
- When participation faded
- Whether trades aligned with institutional flow
- Whether losses occurred during weak RVF environments
This helps traders develop pattern recognition around participation quality and session structure.
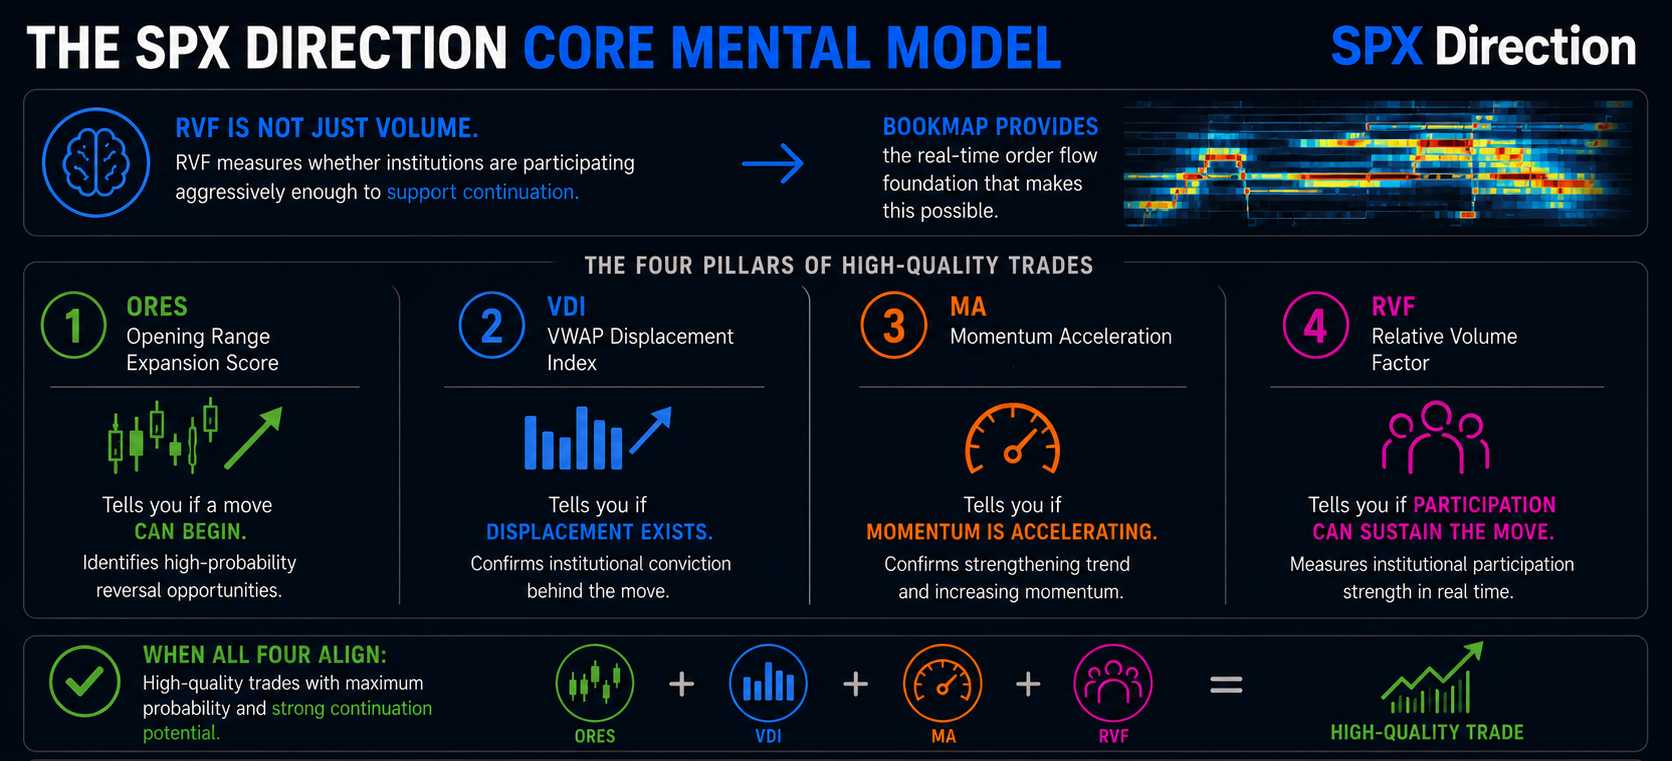
🧠 CORE MENTAL MODEL
RVF does not simply measure volume.
It measures whether institutions are participating aggressively enough to support continuation.
Bookmap provides the real-time order flow foundation that makes this possible.
Inside the SPX Direction framework:
- ORES tells you if a move can begin
- VDI tells you if displacement exists
- MA tells you if momentum is accelerating
- RVF tells you if participation can sustain the move
High-quality trades occur when all four align together.