Introduction to SPX Direction Volume Whale Hunter
Contact customer support at support@spxdirection.com
ES Volume Analysis
SPX direction has partnered with Bookmap to provide the most comprehensive real-time volume analysis in the world using level 3 data.
This data displayed by SPX Direction is far more granular and accurate than the volume data available on other platforms like TradingView.
Understanding the difference between volume data from SPX Direction and volume data from Tradingview gets to the core difference between retail charting vs professional order-flow tools.
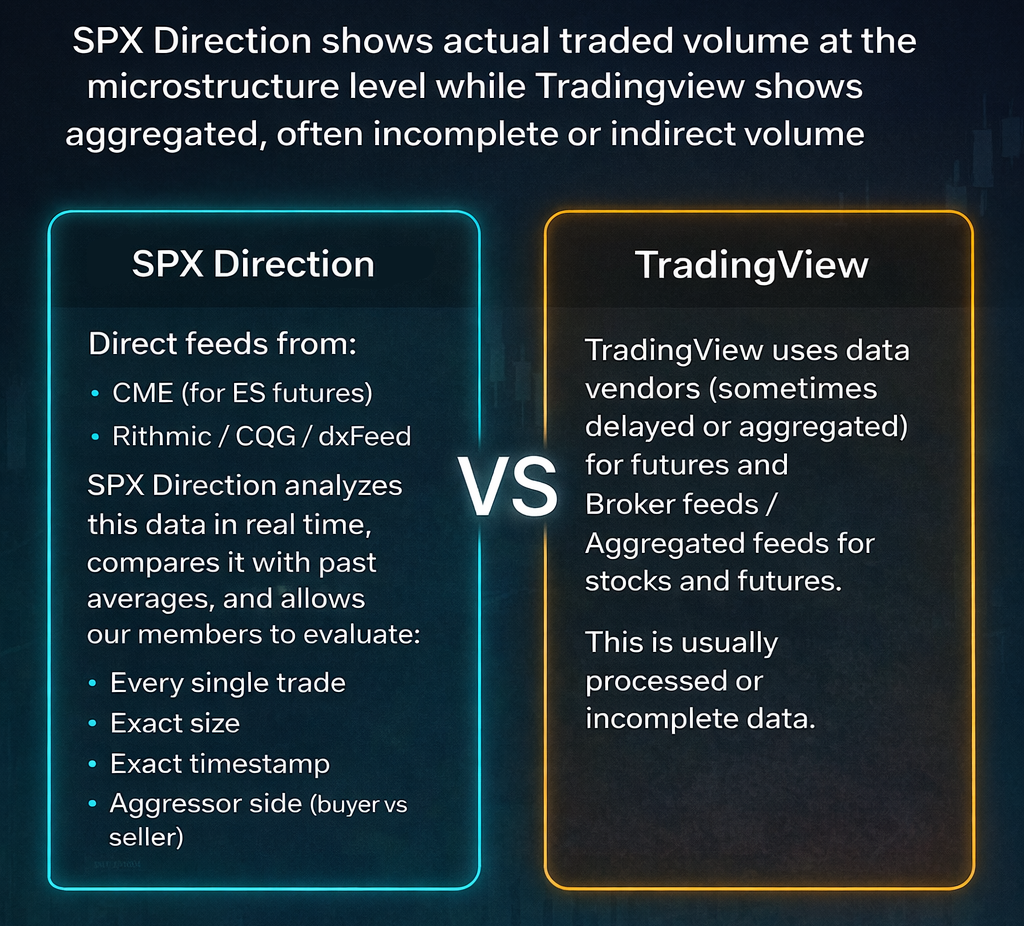
SPX Direction shows actual traded volume at the microstructure level while Tradingview shows aggregated, often incomplete or indirect volume
SPX Direction gets:
- Direct feeds from:
- CME (for ES futures)
- Rithmic / CQG / dxFeed
- SPX Direction analyzes this data in real time, compares it with past averages, and allows our members to evaluate:
- Every single trade
- Exact size
- Exact timestamp
- Aggressor side (buyer vs seller)
TradingView uses data vendors (sometimes delayed or aggregated) for futures and Broker feeds / Aggregated feeds for stocks and futures. This is usually processed or incomplete data.
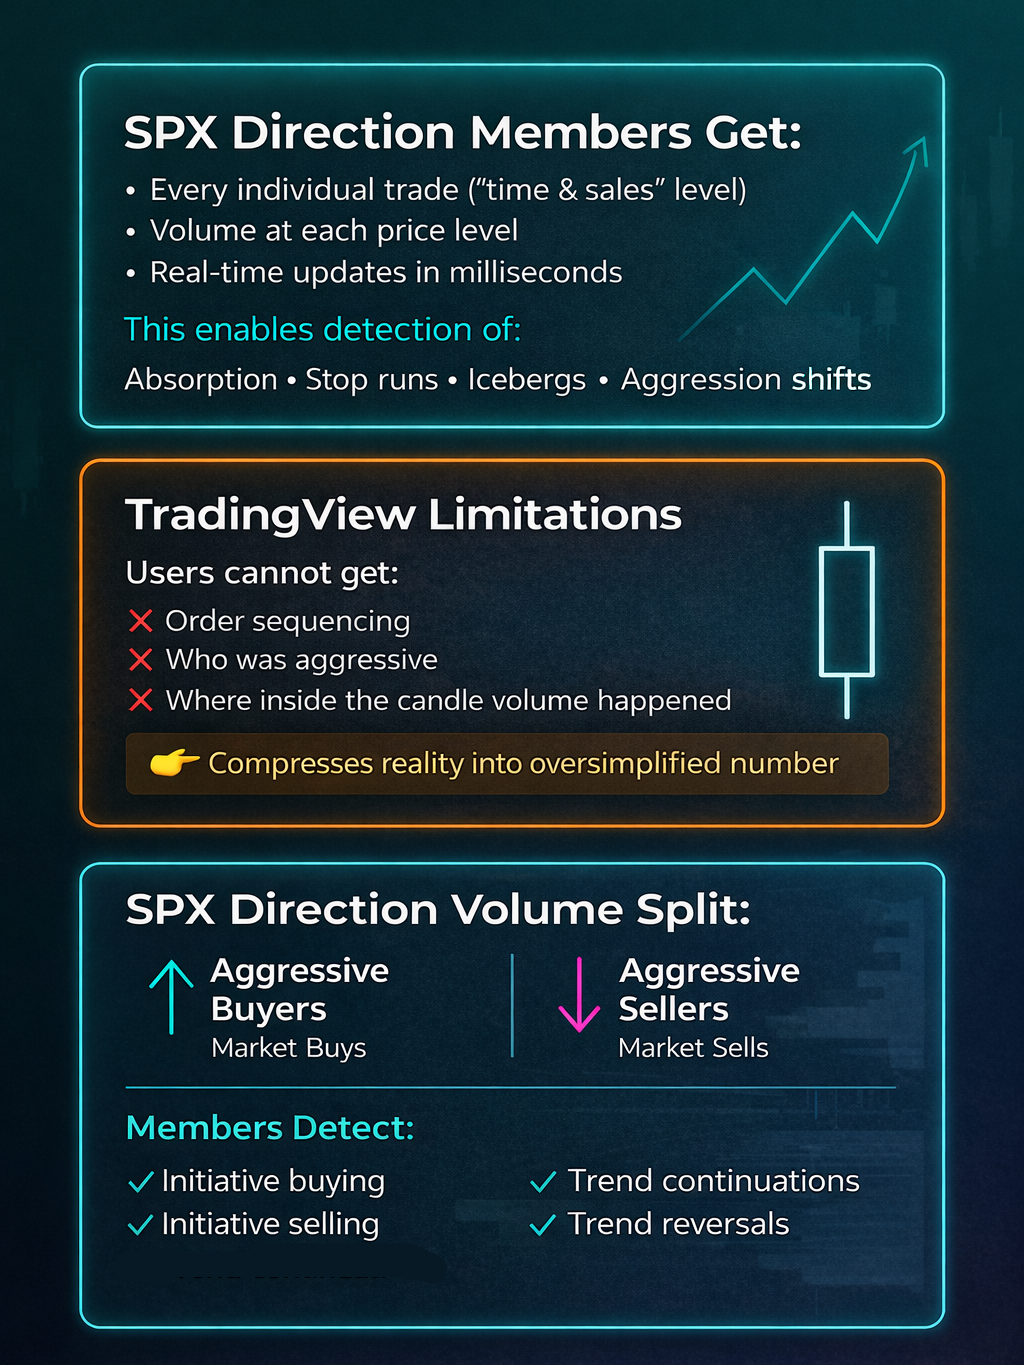
With SPX Direction, members get to see
- Every individual trade (“time & sales” level)
- Volume at each price level
- Real-time updates in milliseconds
This enables our users to detect:
- Absorption
- Stop runs
- Icebergs
- Aggression shifts
With TradingView, users get volume per candle, users cannot get
- Order sequencing
- Who was aggressive
- Where inside the candle volume happened
👉 It compresses reality into a single ‘oversimplified’ number
SPX Direction splits volume into:
- Aggressive buyers (market buys)
- Aggressive sellers (market sells)
This is how our members detect:
- Initiative buying
- Initiative selling
- Trend continuations
- Trend reversals
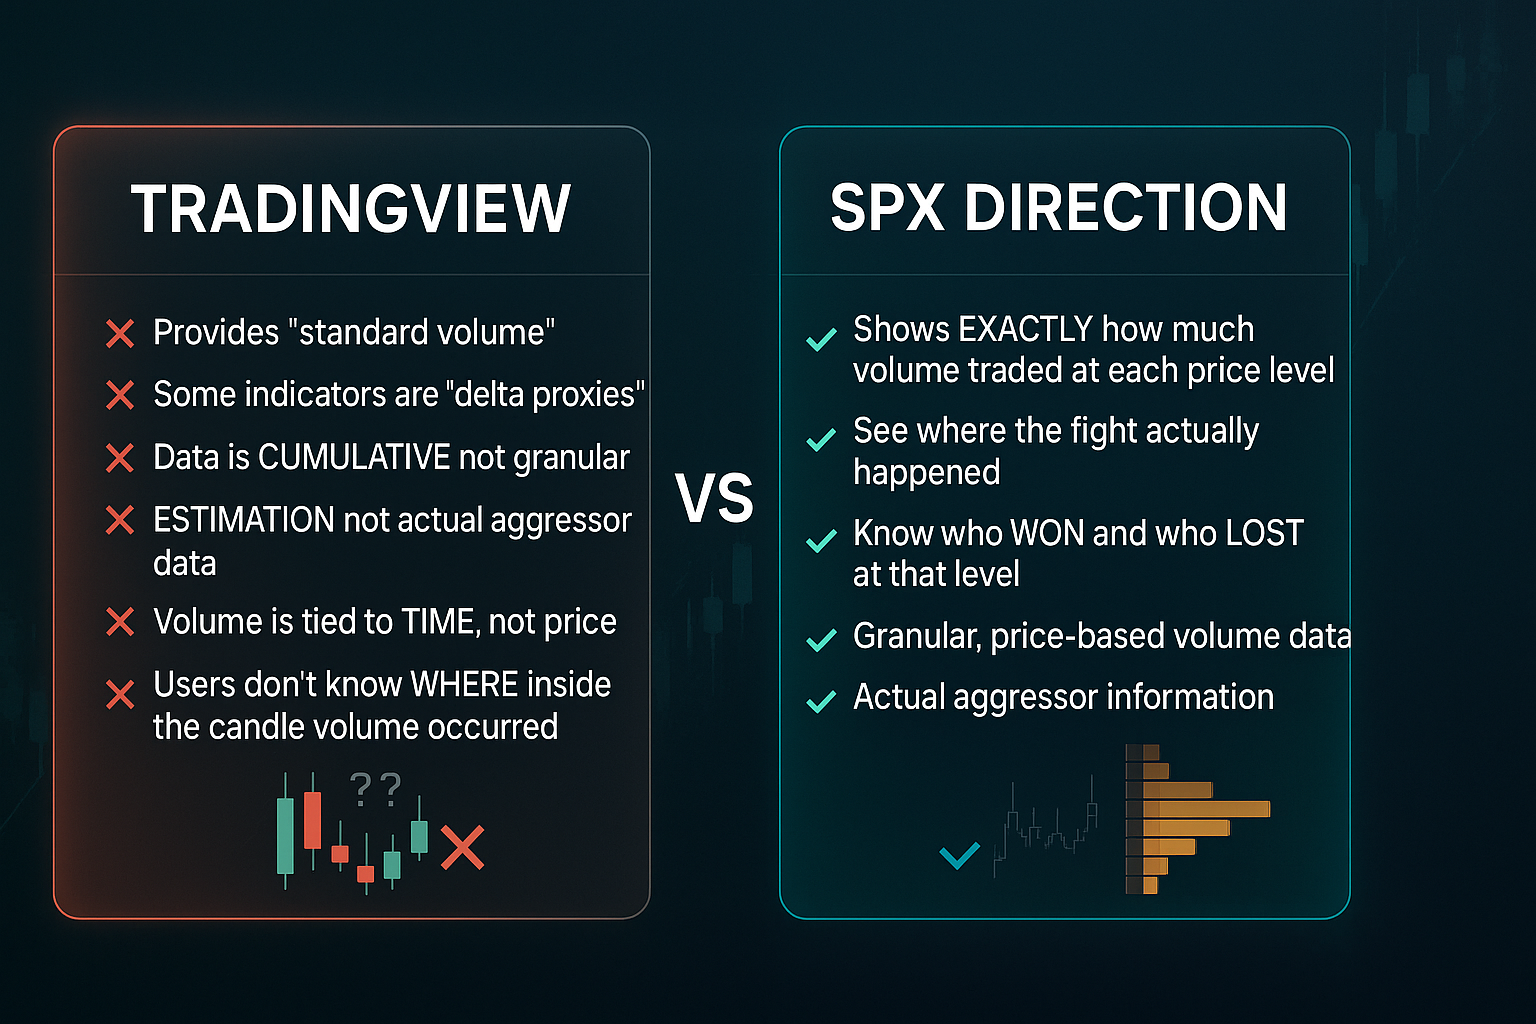
TradingView provides “standard volume”. Some indicators are “delta proxies” and try to improve accuracy, but the data is “cumulative” not granular, it is an “estimation” not actual aggressor data
SPX Direction shows exactly how much volume traded at each price level
You see where the fight actually happened, who won and who lost at that level.
With TradingView, volume is tied to time, not price
Users do not know where where inside the candle the volume occurred
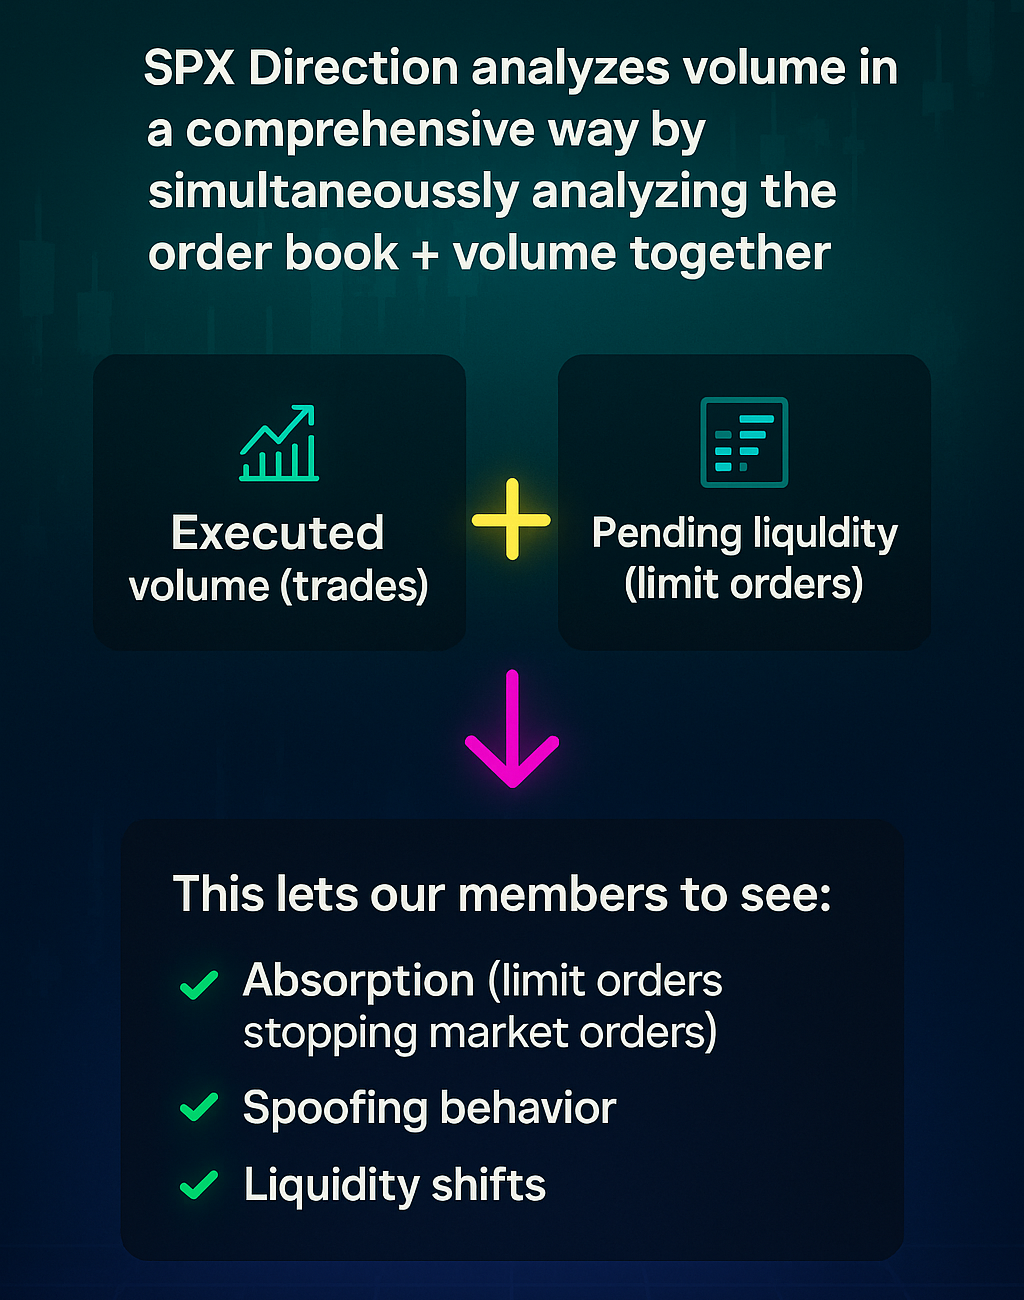
SPX Direction analyzes volume in a comprehensive way by simultaneously analyzing the order book + volume together.
SPX Direction combines
-
Executed volume (trades)
- Pending liquidity (limit orders)
This lets our members to see:
- Absorption (limit orders stopping market orders)
- Spoofing behavior
- Liquidity shifts
With Tradingview, there is no real order book (in most cases), users are missing half the equation or ‘running blind’
SPX Direction is built for institutional traders, prop desks, quant traders, HFT-adjacent workflows who require very low latency and tick-level precision.
Tradingview is built for retail traders who require charting and convenience, and relative to the SPX Direction’s volume analysis, the volume tools in Tradingview include slight delays and aggregation smoothing
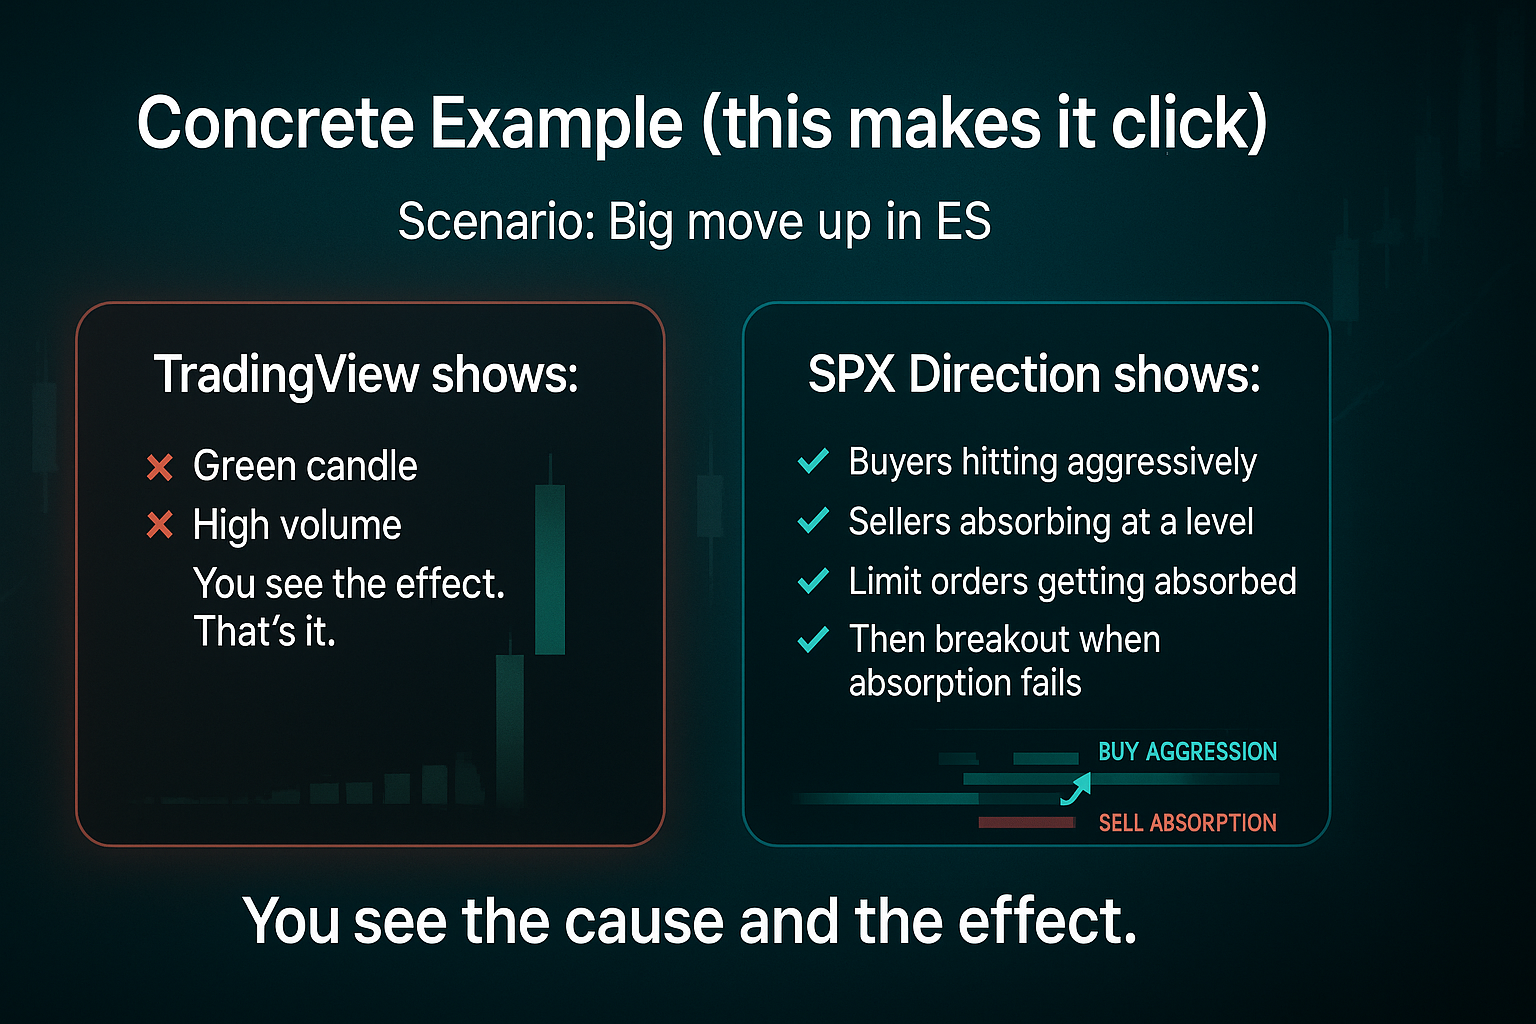
Concrete example (this makes it click)
Scenario: Big move up in ES
TradingView shows:
- Green candle
- High volume
You see the effect. That’s it.
SPX Direction shows:
- Buyers hitting aggressively
- Sellers absorbing at a level
- Limit orders getting absorbed
- Then breakout when absorption fails
You see the cause and the effect.
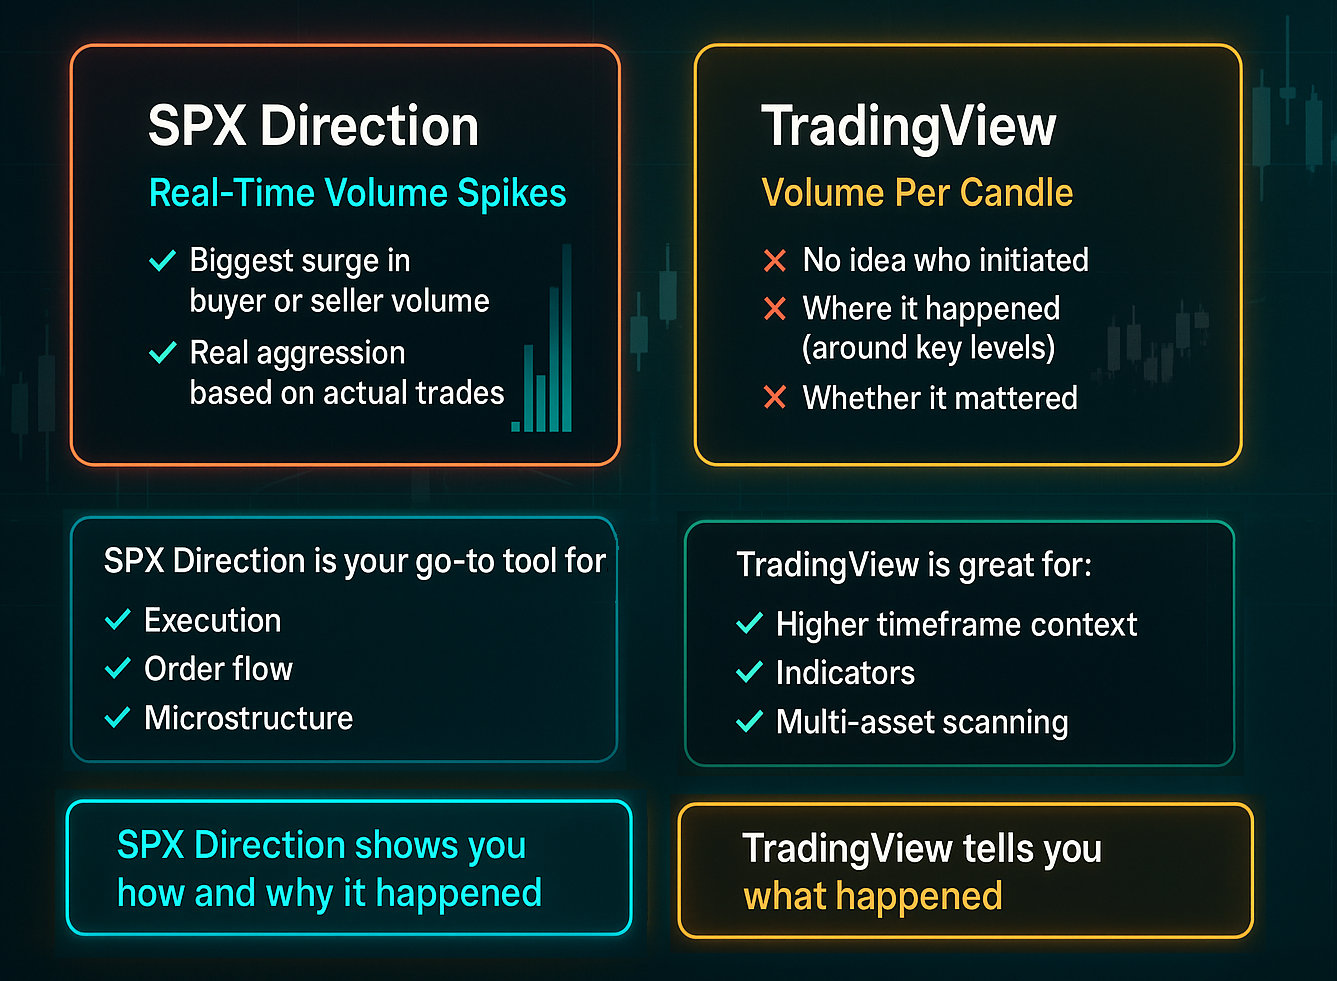
SPX Direction displays volume spikes in real time - “Biggest surge in buyer or seller volume”. This is real aggression based on actual trades
TradingView shows you volume in a candle, but no idea who initiated, where it happened (around key levels) and whether it mattered
Having said that, TradingView is great for:
- Higher timeframe context
- Indicators
- Multi-asset scanning
- Simplicity
SPX Direction is your go-to tool for:
- Execution
- Order flow
- Microstructure
TradingView tells you what happened
SPX Direction shows you how and why it happened
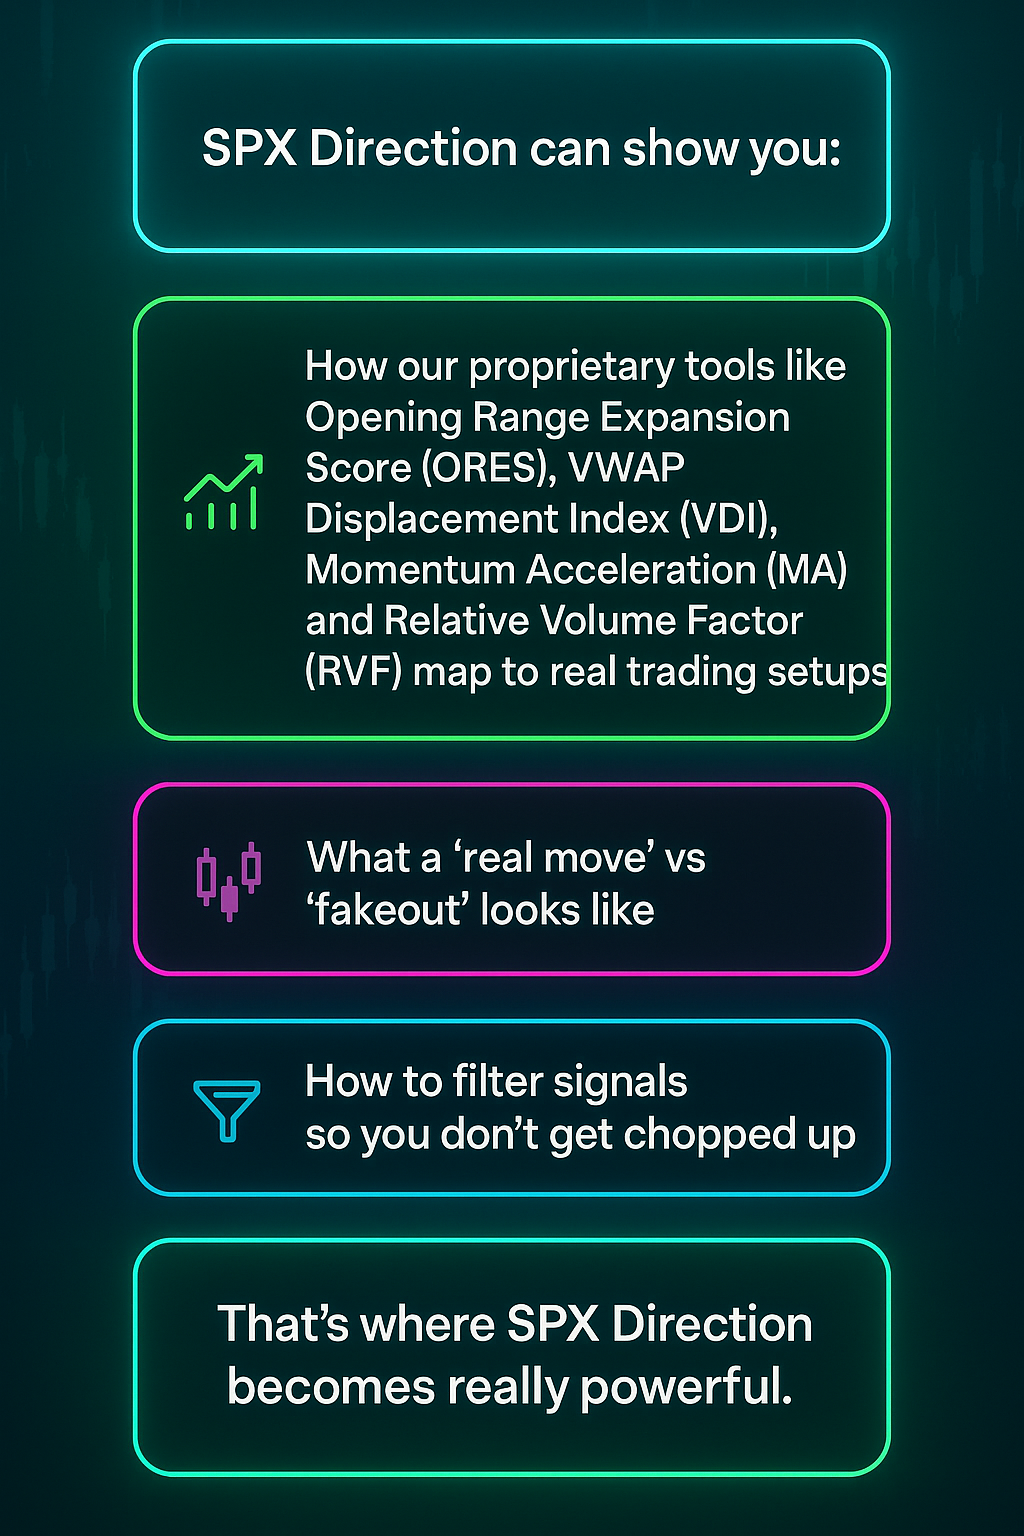
SPX Direction can show you:
- How our proprietary tools like Opening Range Expansion Score (ORES), VWAP Displacement Index (VDI), Momentum Acceleration (MA) and Relative Volume Factor (RVF) map to real trading setups
- What a “real move” vs “fakeout” looks like
- How to filter signals so you don’t get chopped up
That’s where SPX Direction becomes really powerful.