How to Detect Institutional Liquidity & Fakeouts with SPX Direction
Contact customer support at support@spxdirection.com
Liquidity Grabs
Hunting Stops to Fill Orders
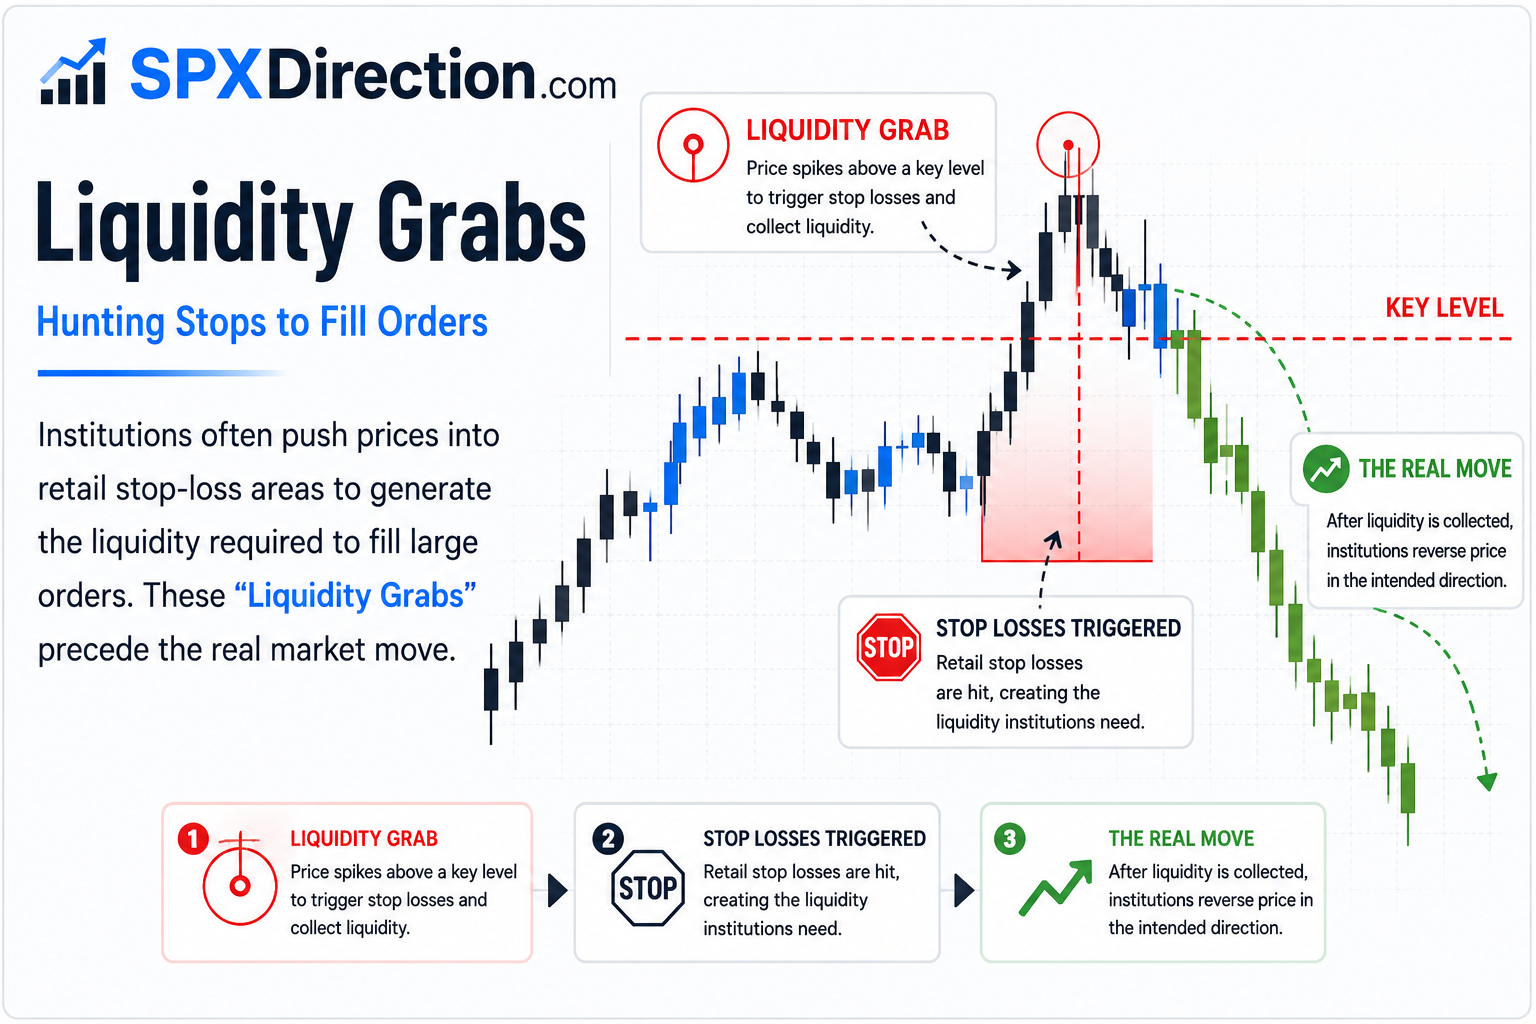
Institutions often push prices into retail stop-loss areas to generate the liquidity required to fill large orders. These "Liquidity Grabs" precede the “real market move”. These are the traps set by the market to ensure retail traders lose money.
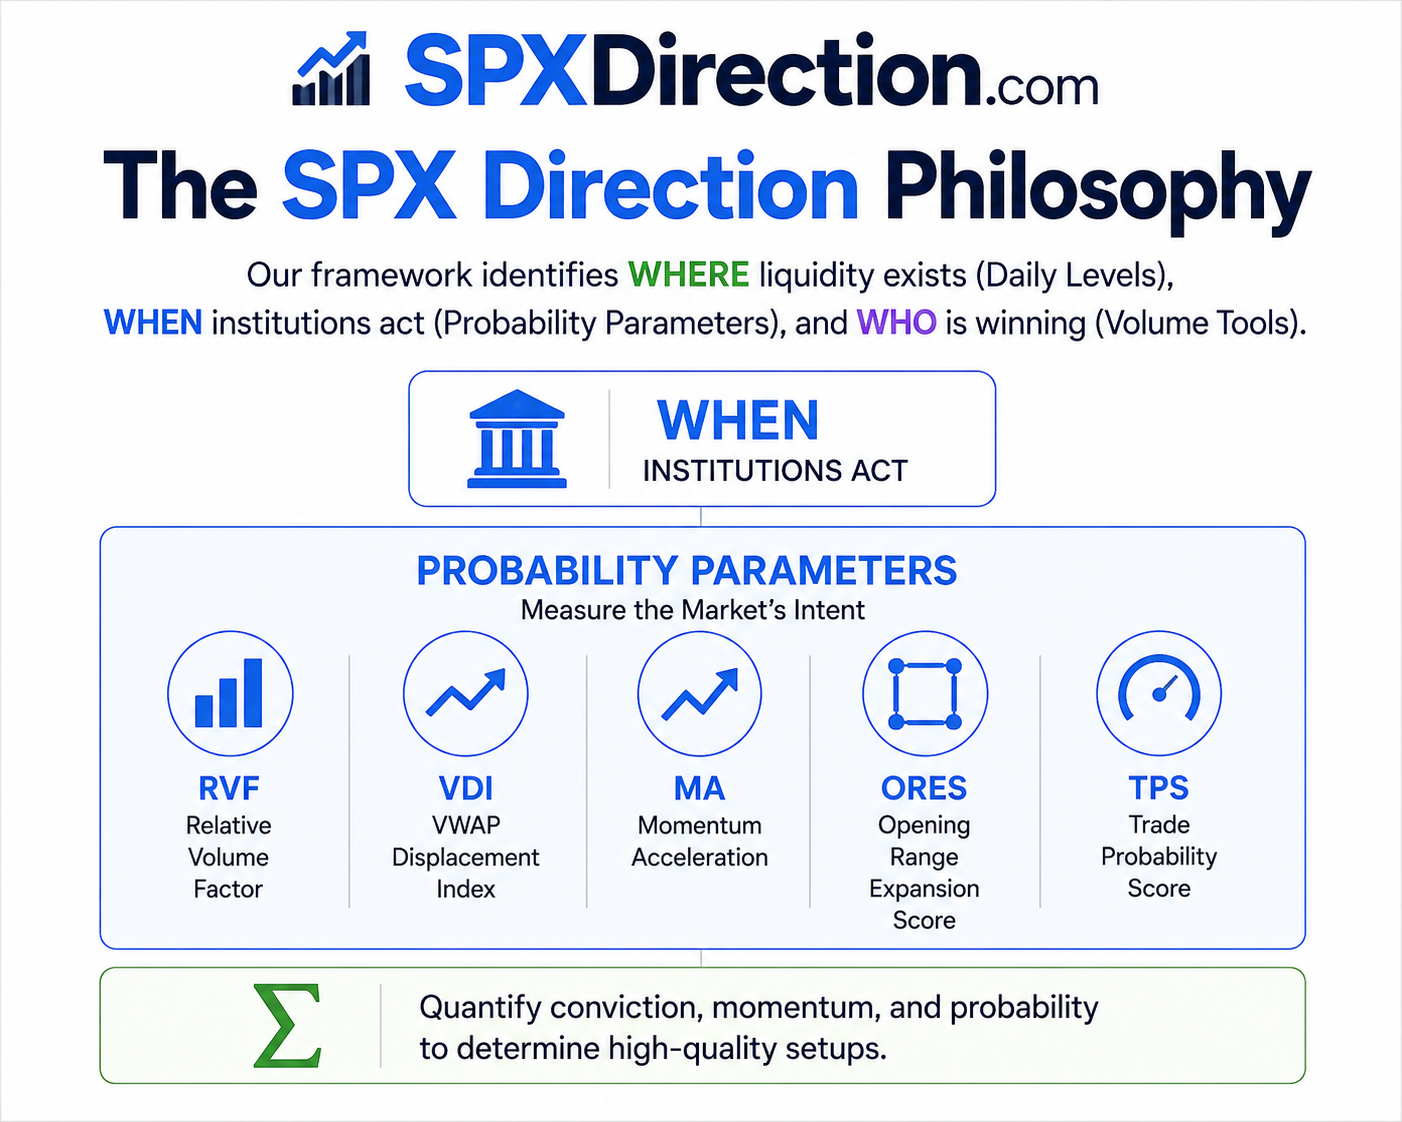
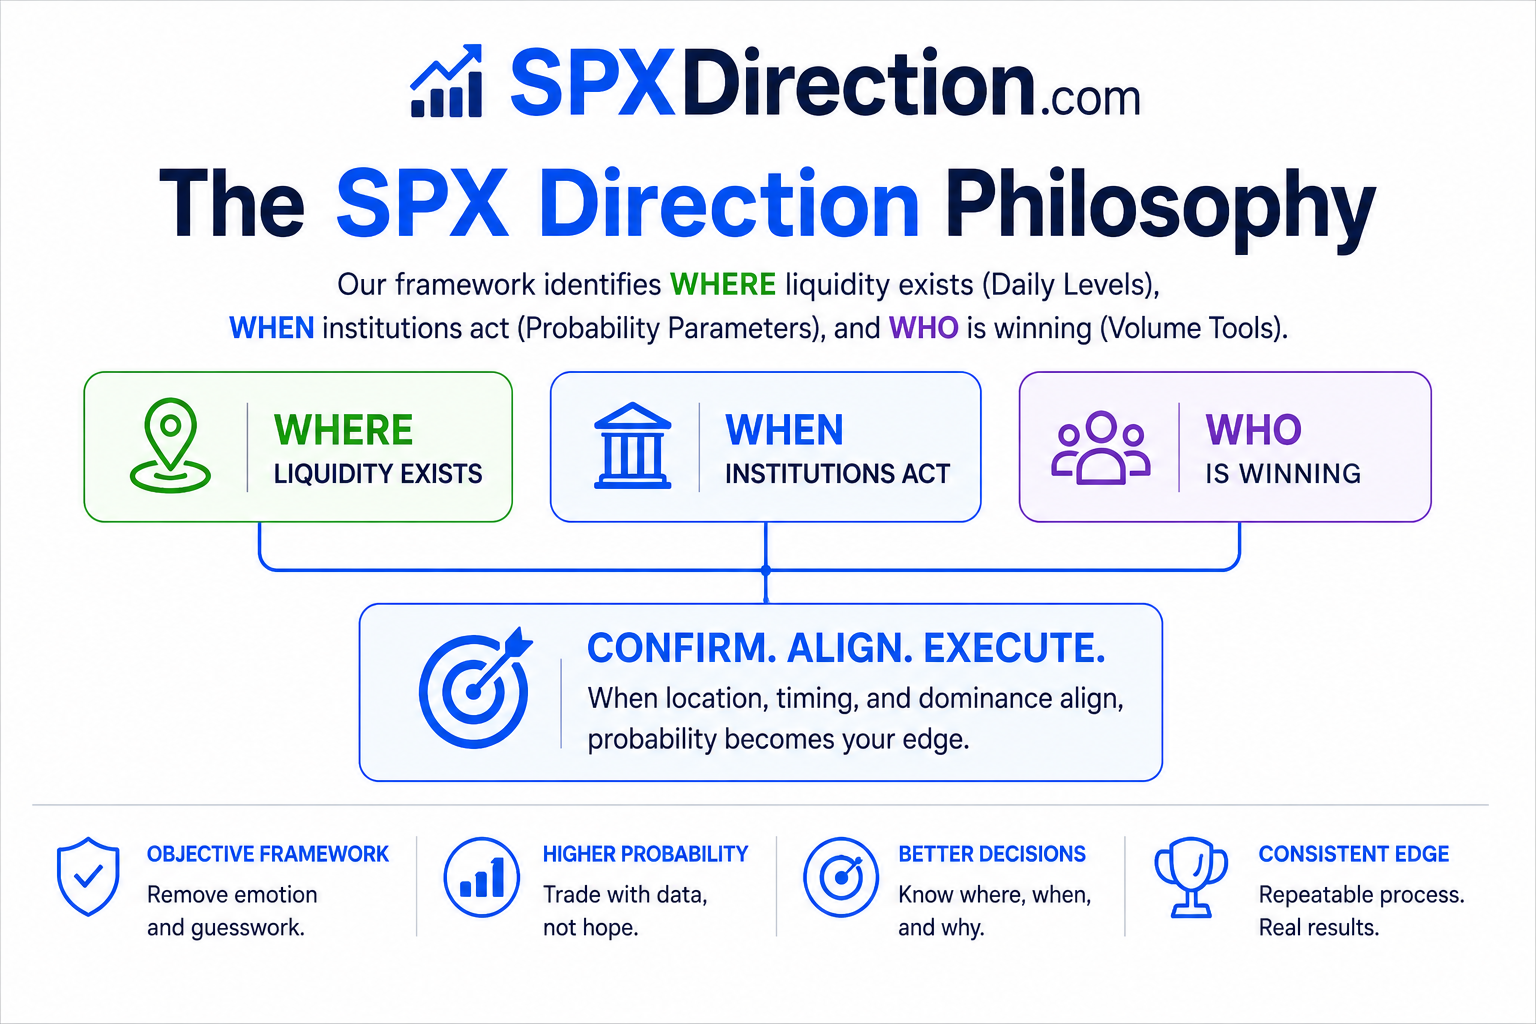
The SPX Direction Philosophy
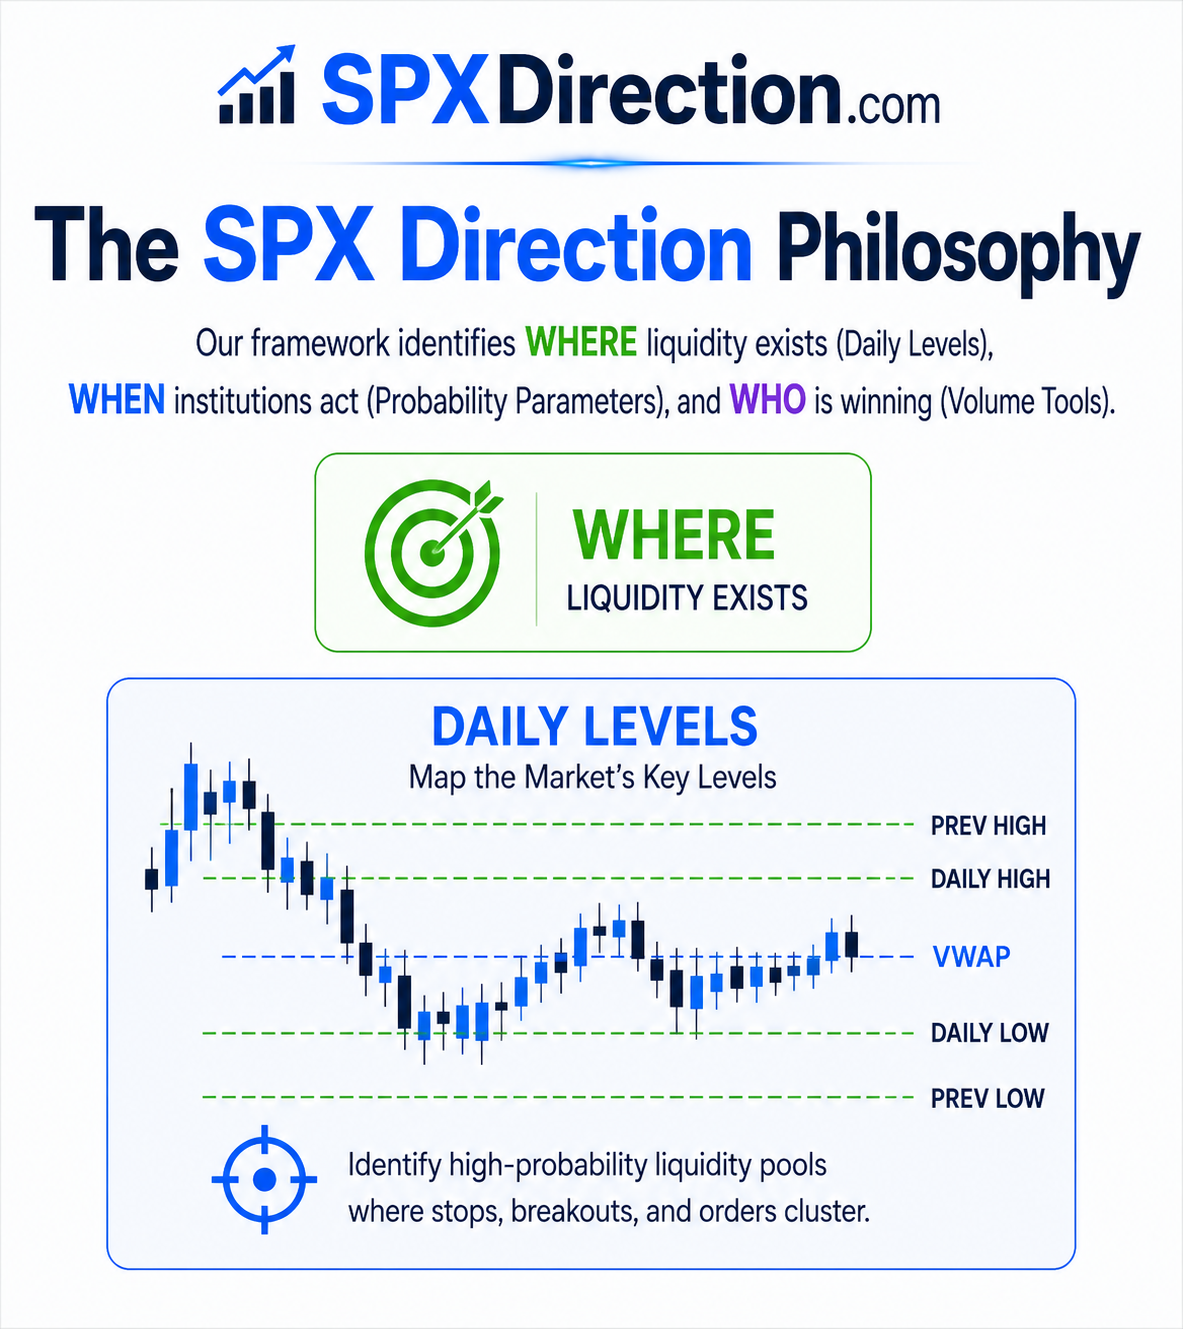
Our framework identifies WHERE liquidity exists (Daily Levels), WHEN institutions act (Probability Parameters), and WHO is dominating at the present time (Volume Tools).

The Liquidity Process
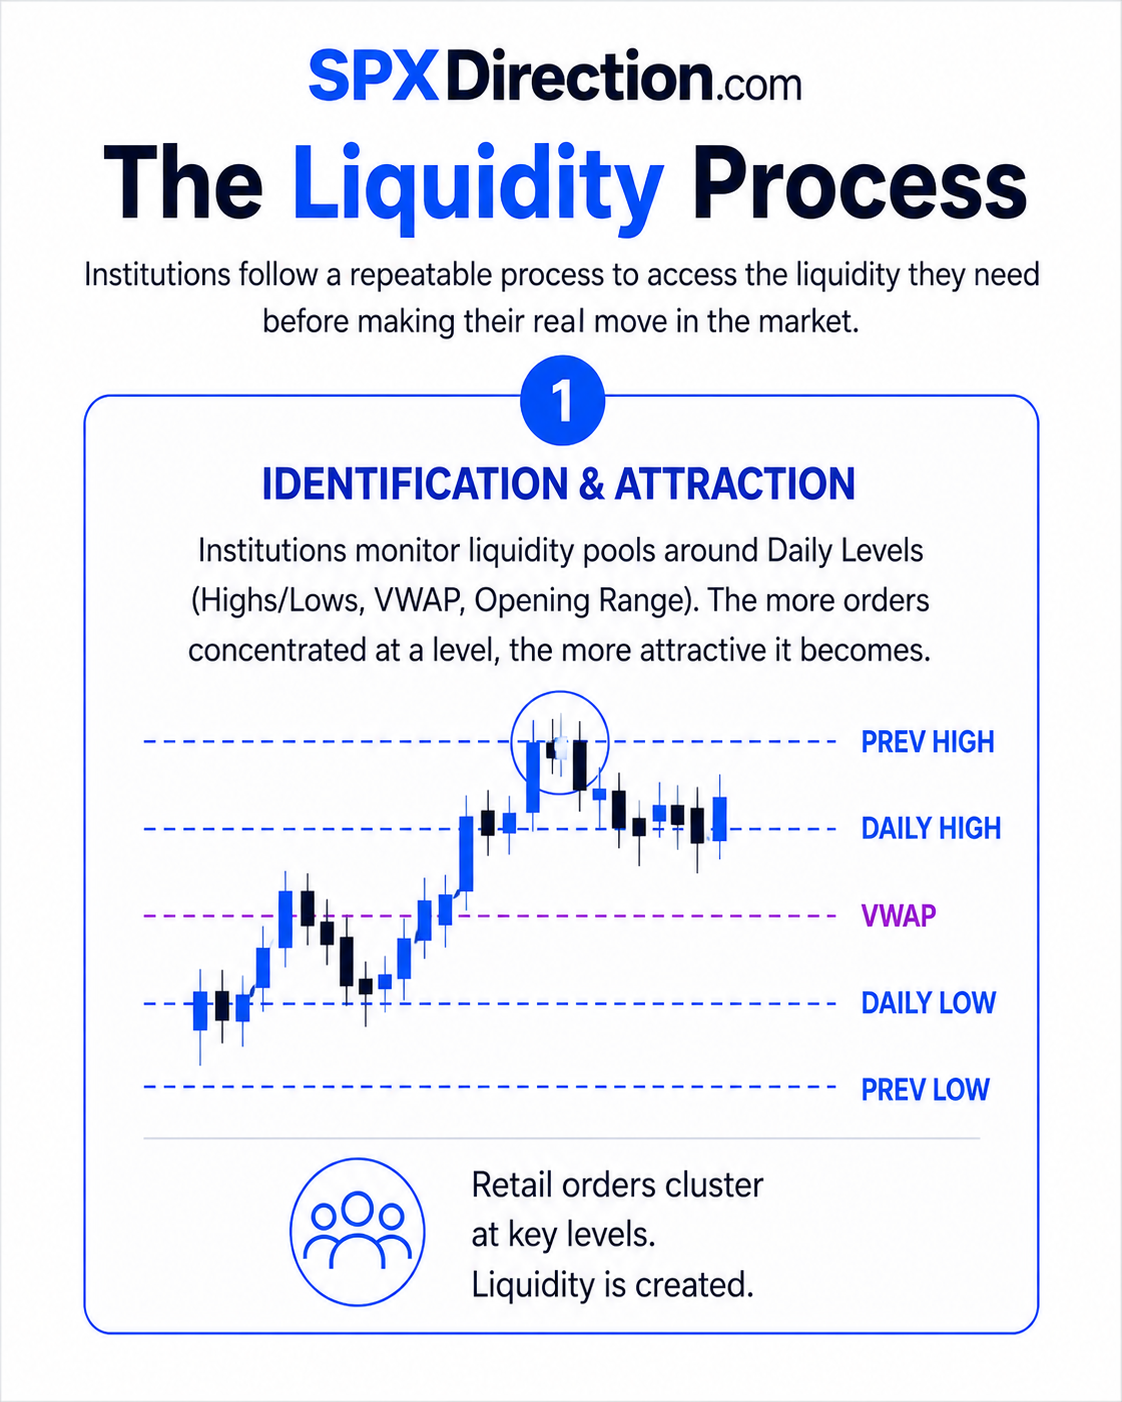
1. Identification & Attraction
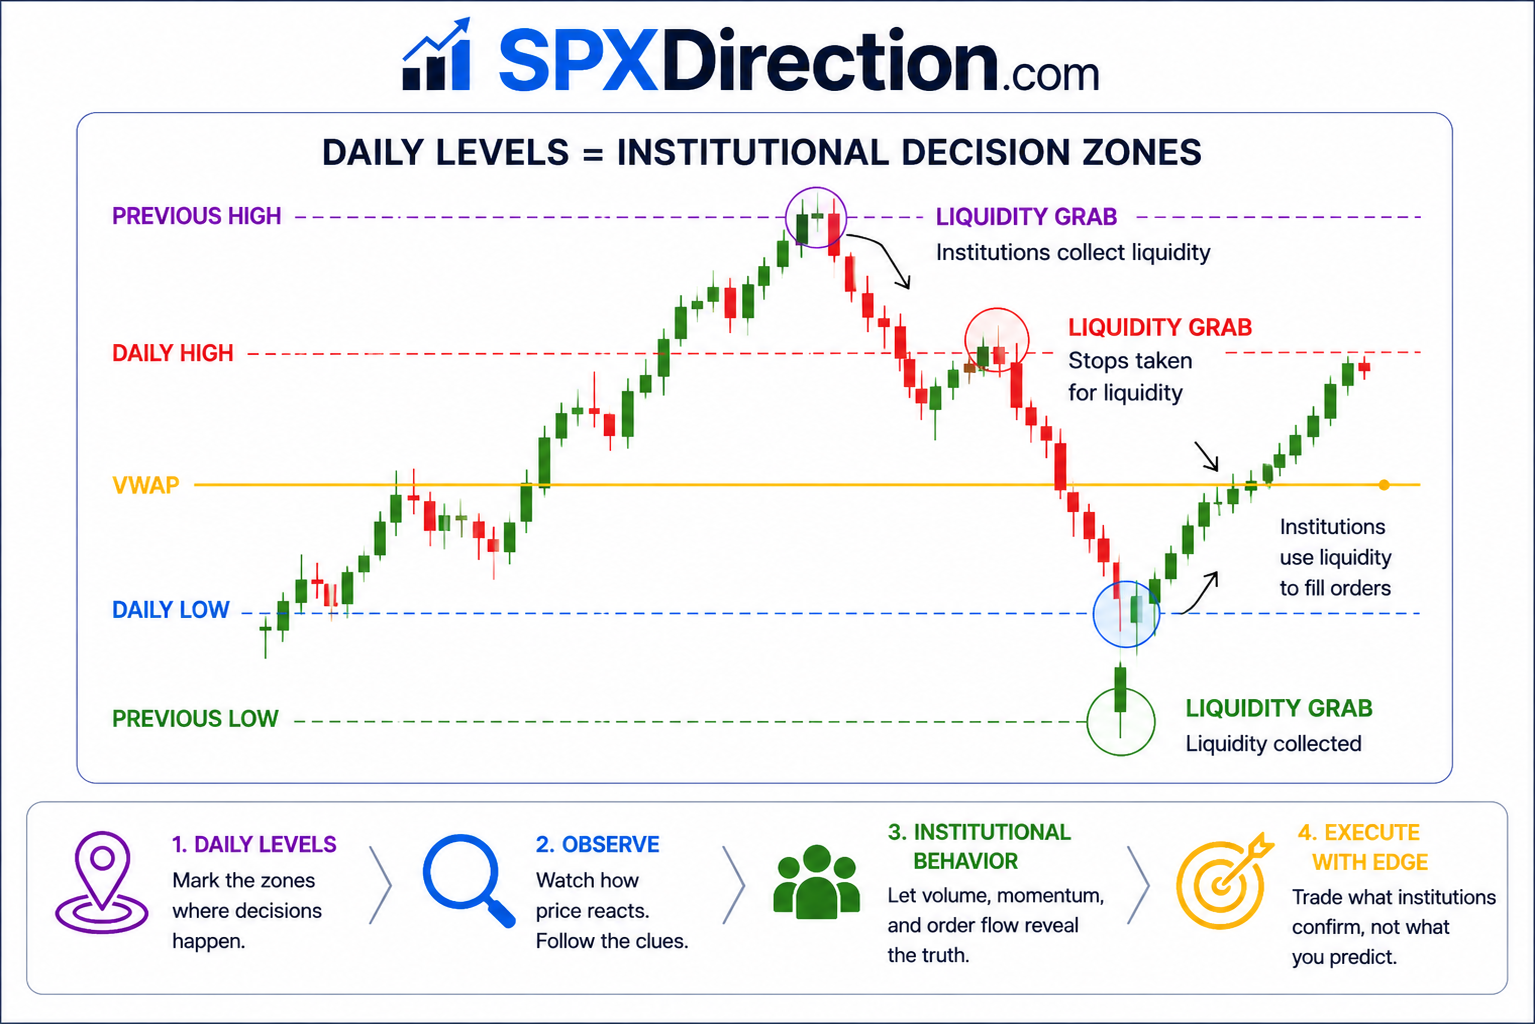
Institutions monitor liquidity pools around Daily Levels (Highs/Lows, VWAP, Opening Ranges). All of these liquidity pools and all of these daily levels are automatically calculated, and dynamically displayed in our algorithm and with our trading view indicator. The more orders are concentrated at a level, the more attractive it becomes. Our volume tool identifies in real time how many orders are resting at a particular level.
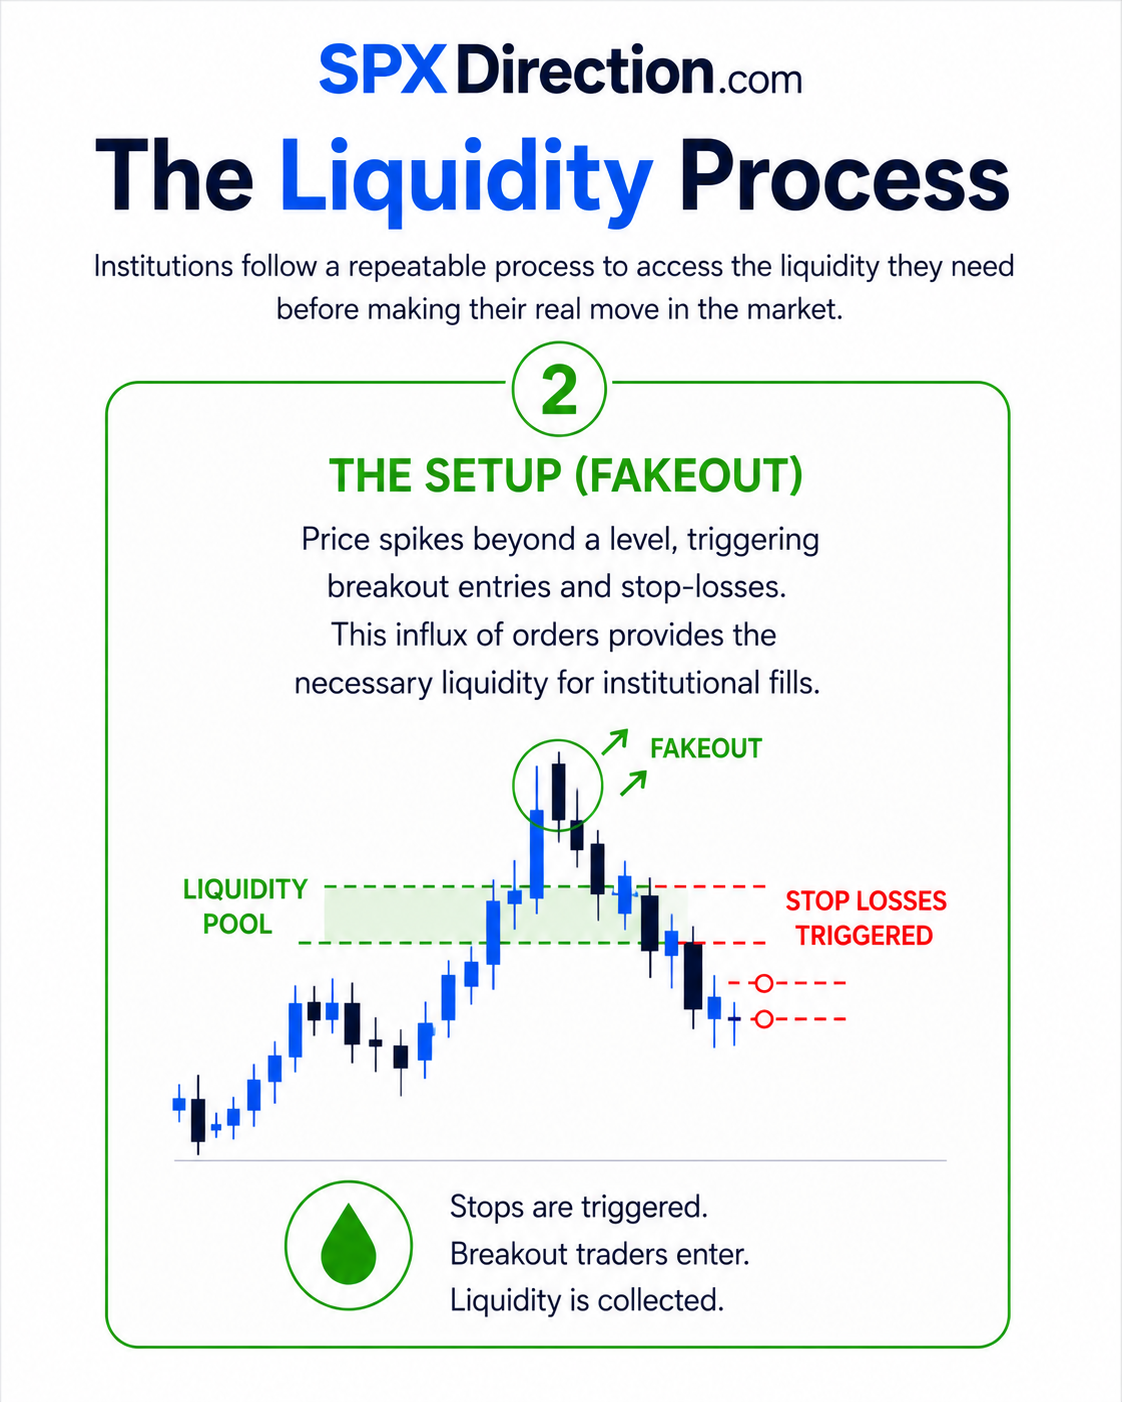
2. The Setup (Fakeout)
Price spikes beyond a level, triggering breakout entries and stop-losses. This influx of orders provides the necessary liquidity for institutional fills.
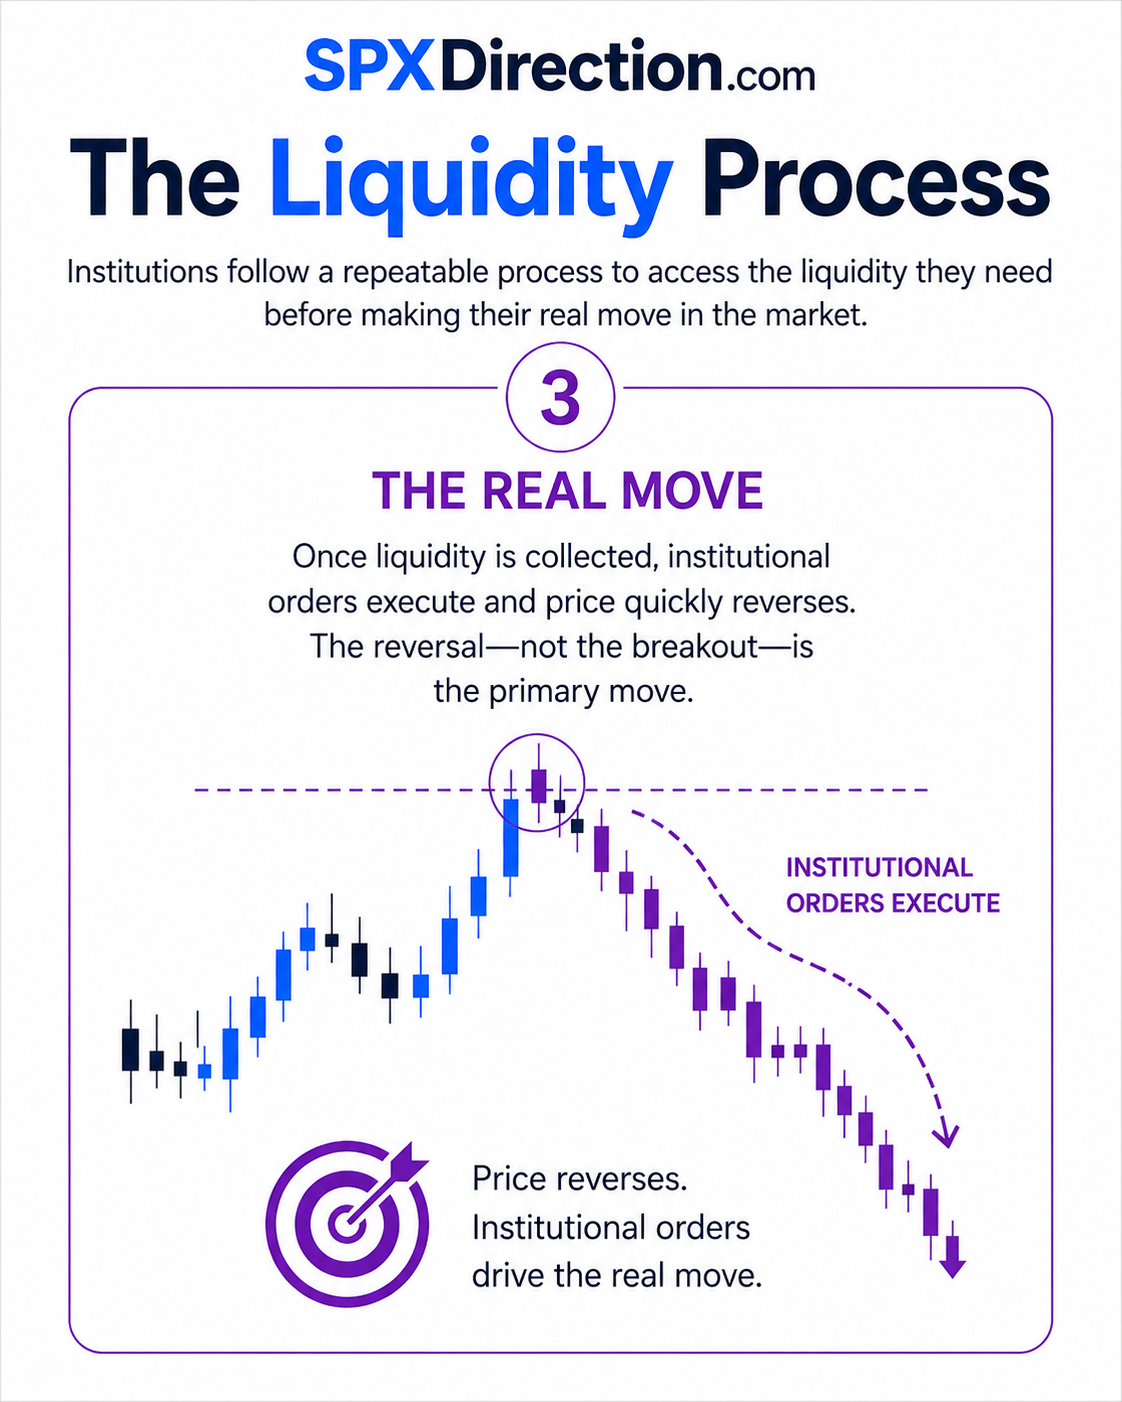
3. The Real Move
Once liquidity is absorbed, institutional orders execute and price quickly reverses. The reversal (not the breakout) is the primary move that SPX direction identifies for members. SPX direction also allows members to identify liquidity absorptions in real time.
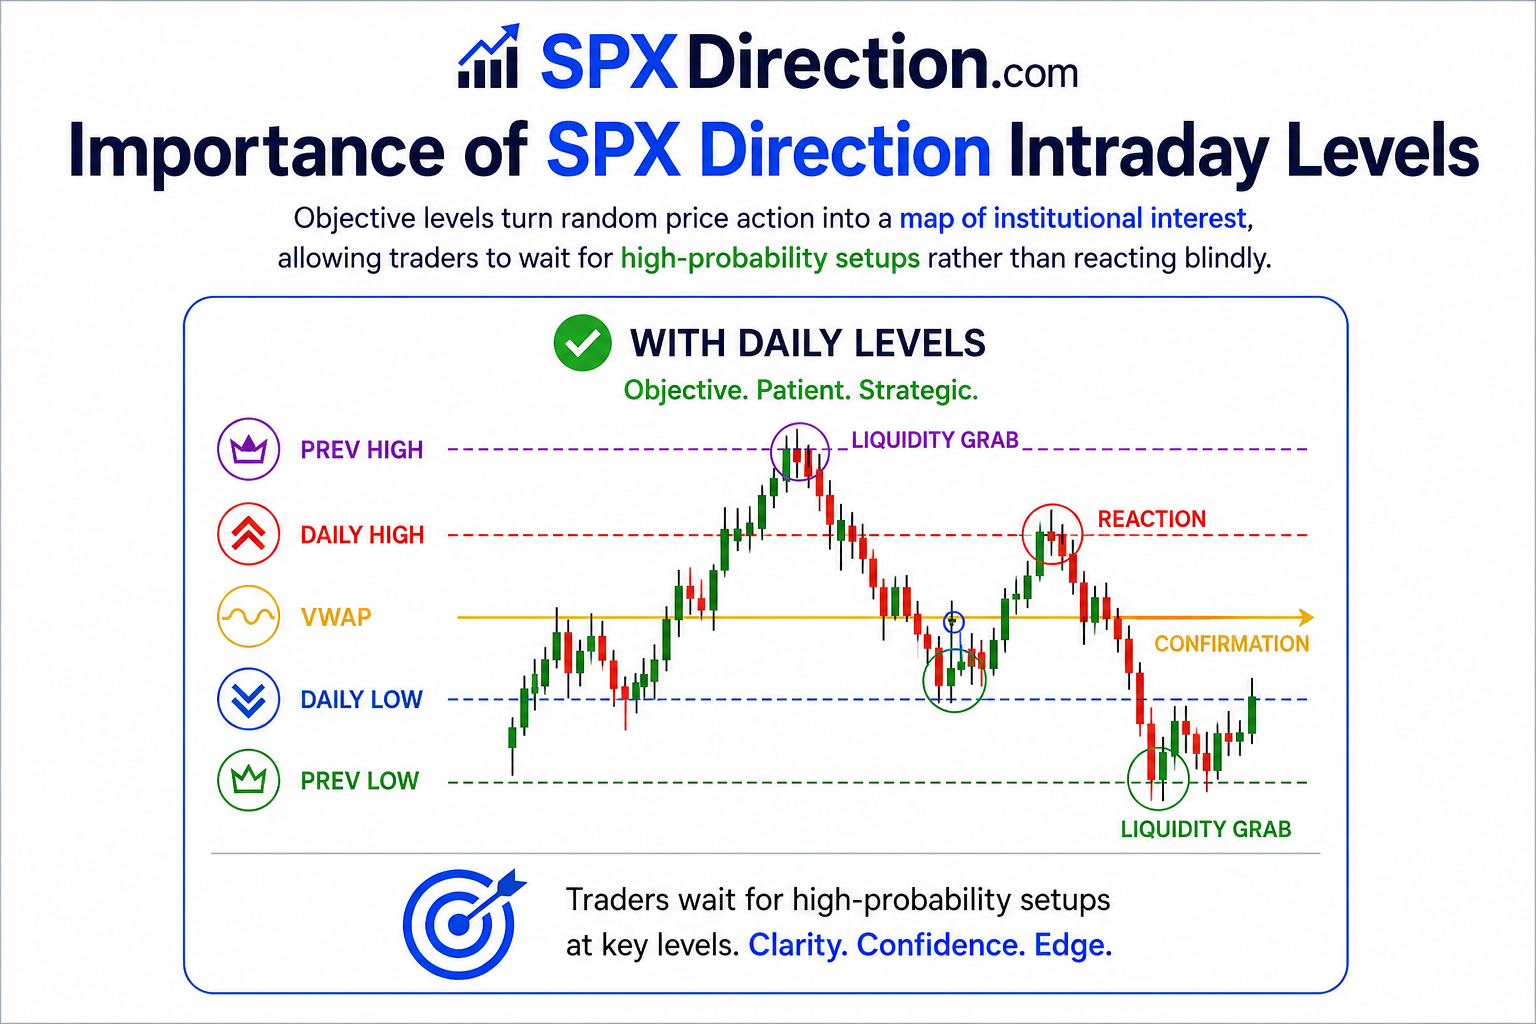
Importance of SPX Direction Intraday Levels
These objective levels turn random price action into a map of institutional interest, allowing traders to wait for high-probability setups rather than reacting blindly.
The daily levels that are most important for the SPX direction algorithm are:
- Daily High/Low (DH/DL) from the daily candle
- Yesterday's levels: YH / YL / YC / YM (yesterday high/low/close/mid)
- Weekly range: WH / WL (computed from the last 5 daily candles' highs/lows)
- Opening Range (OR): OH / OL / OM (high/low/mid of the first hour of NYC open)
- Initial Opening Range (IOH/IOL): high/low/mid of the first 30 minutes of NYC open
For more information about the SPX Direction Intraday Levels, please click here.

Identifying Liquidity Grabs with SPX Direction
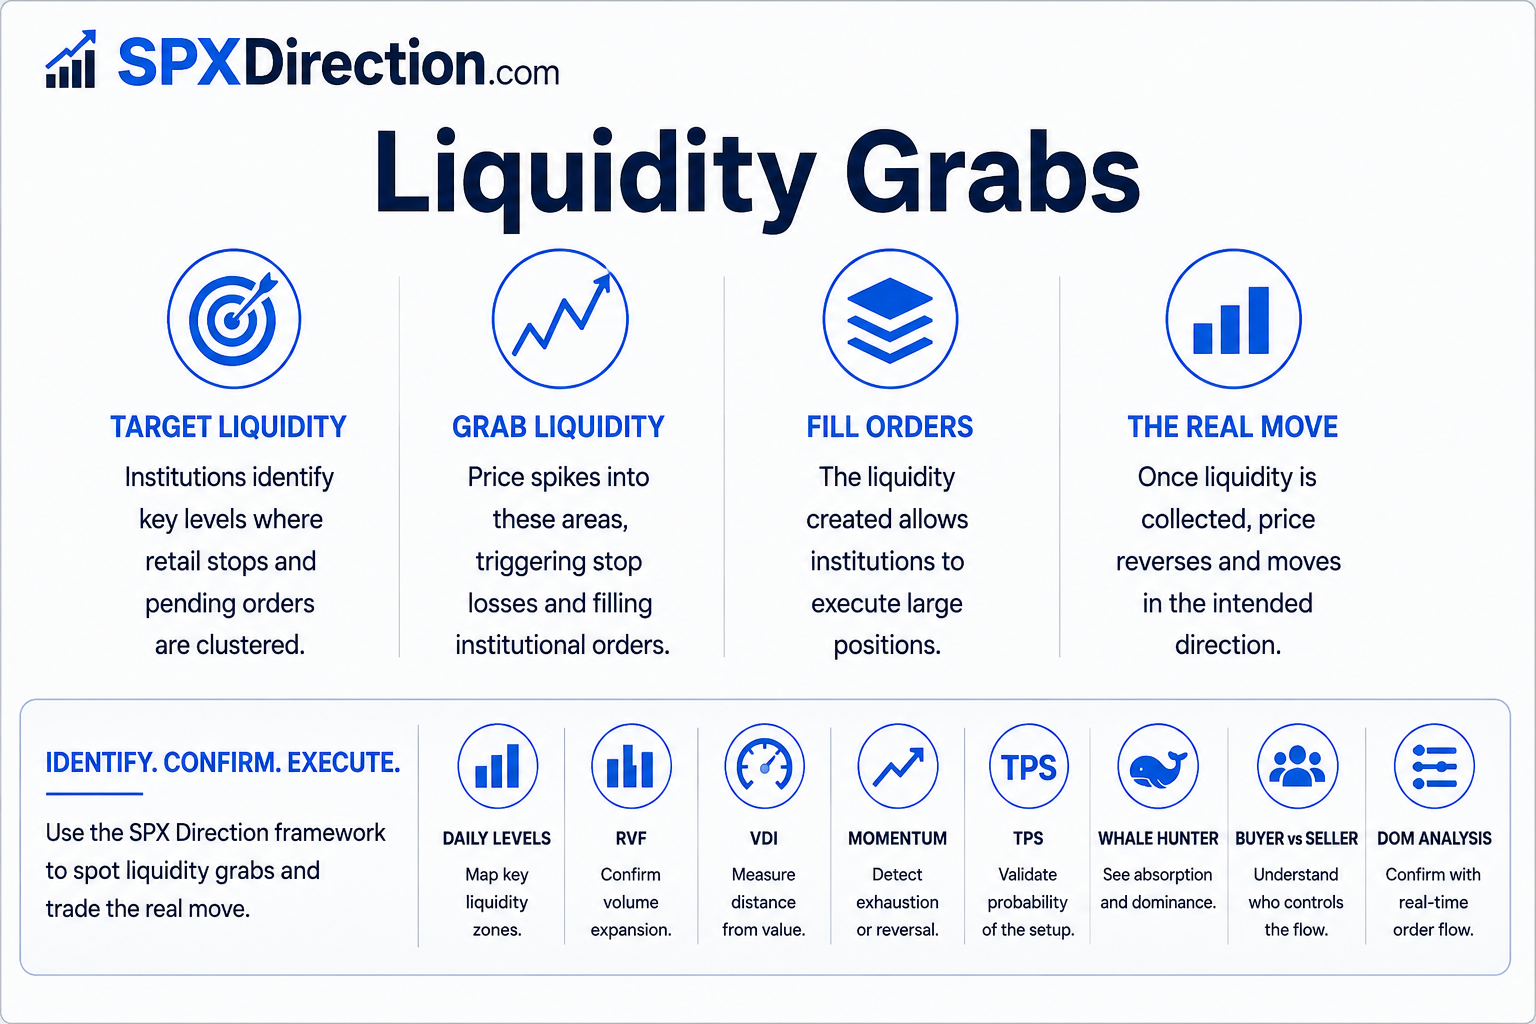
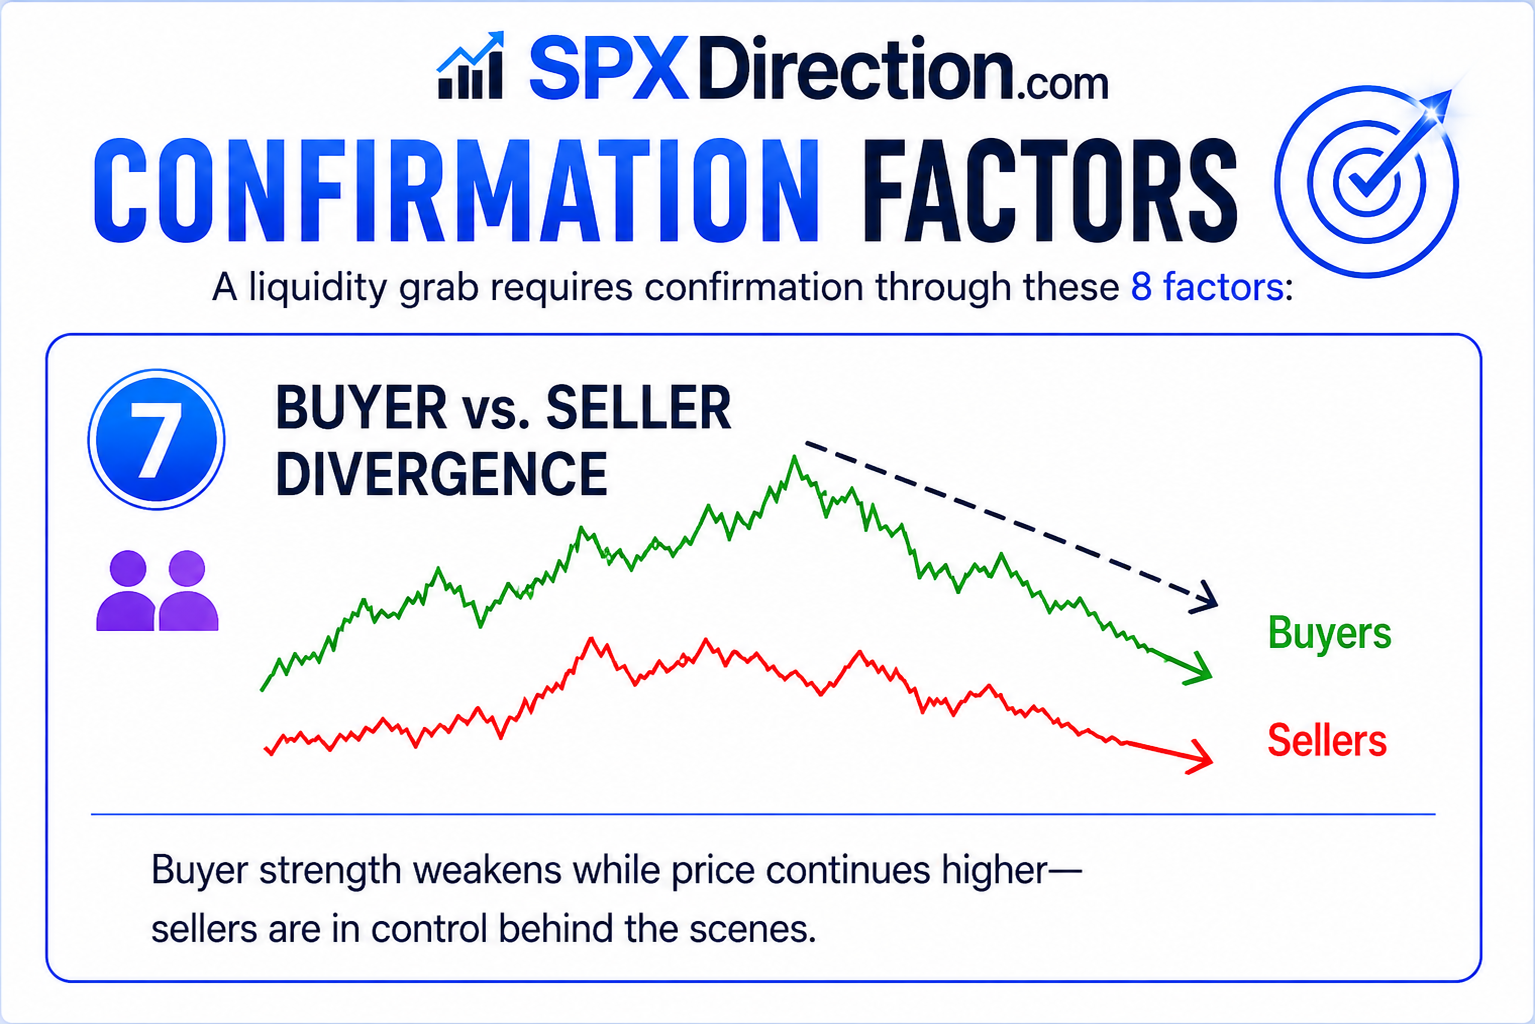
A liquidity grab requires confirmation through these 8 factors:
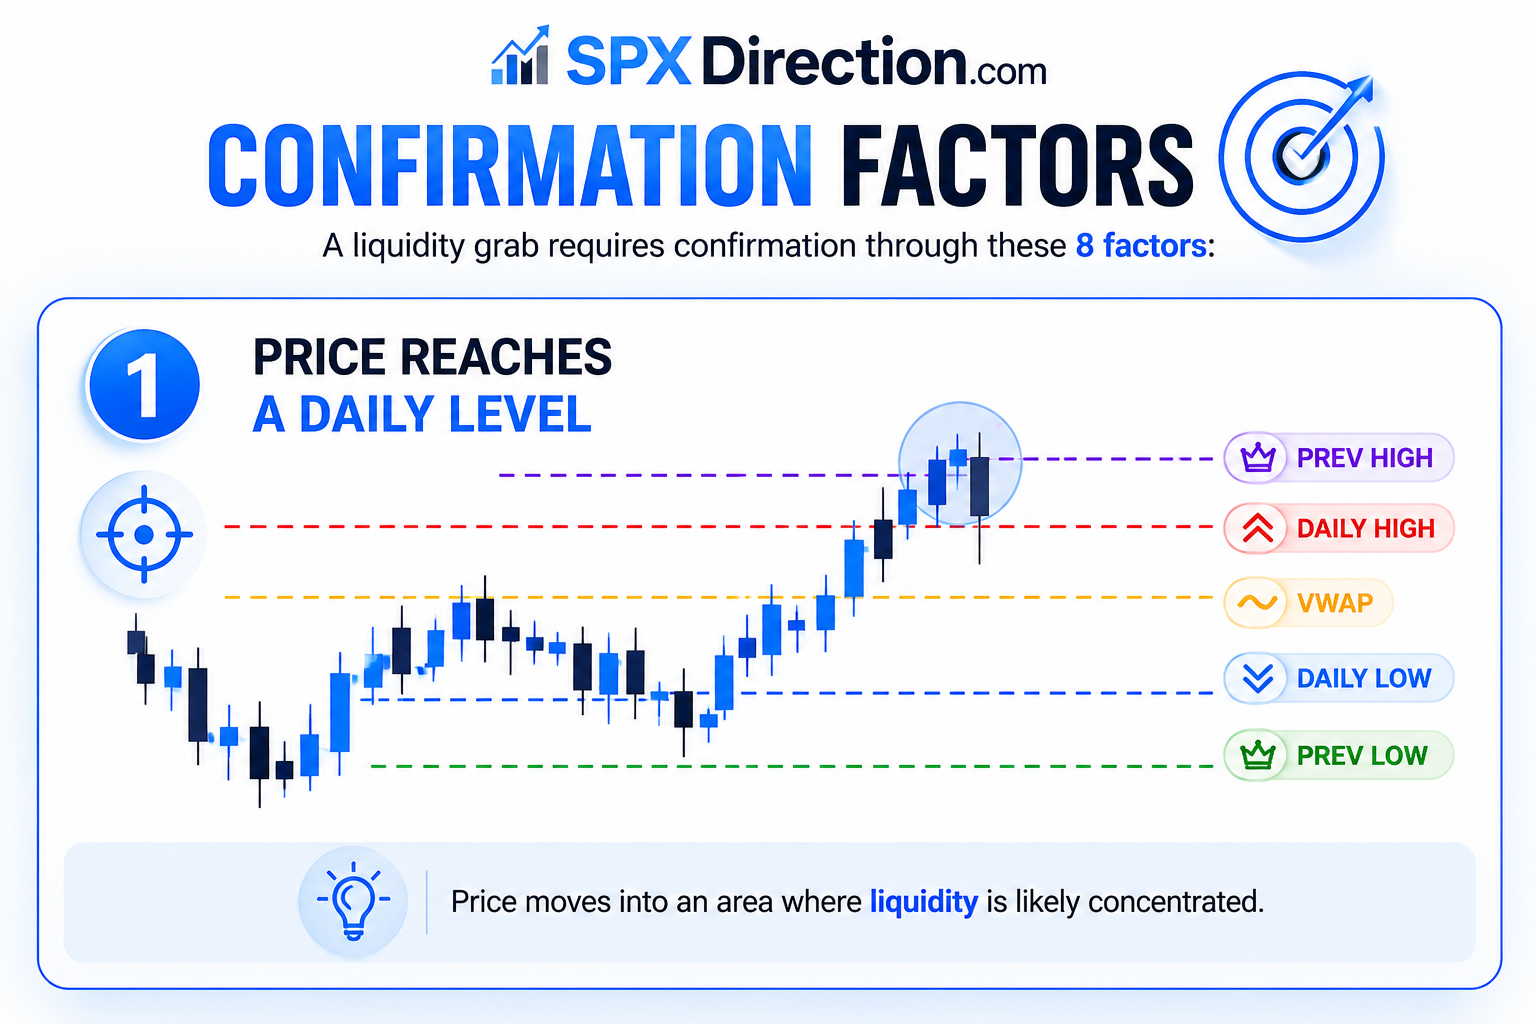
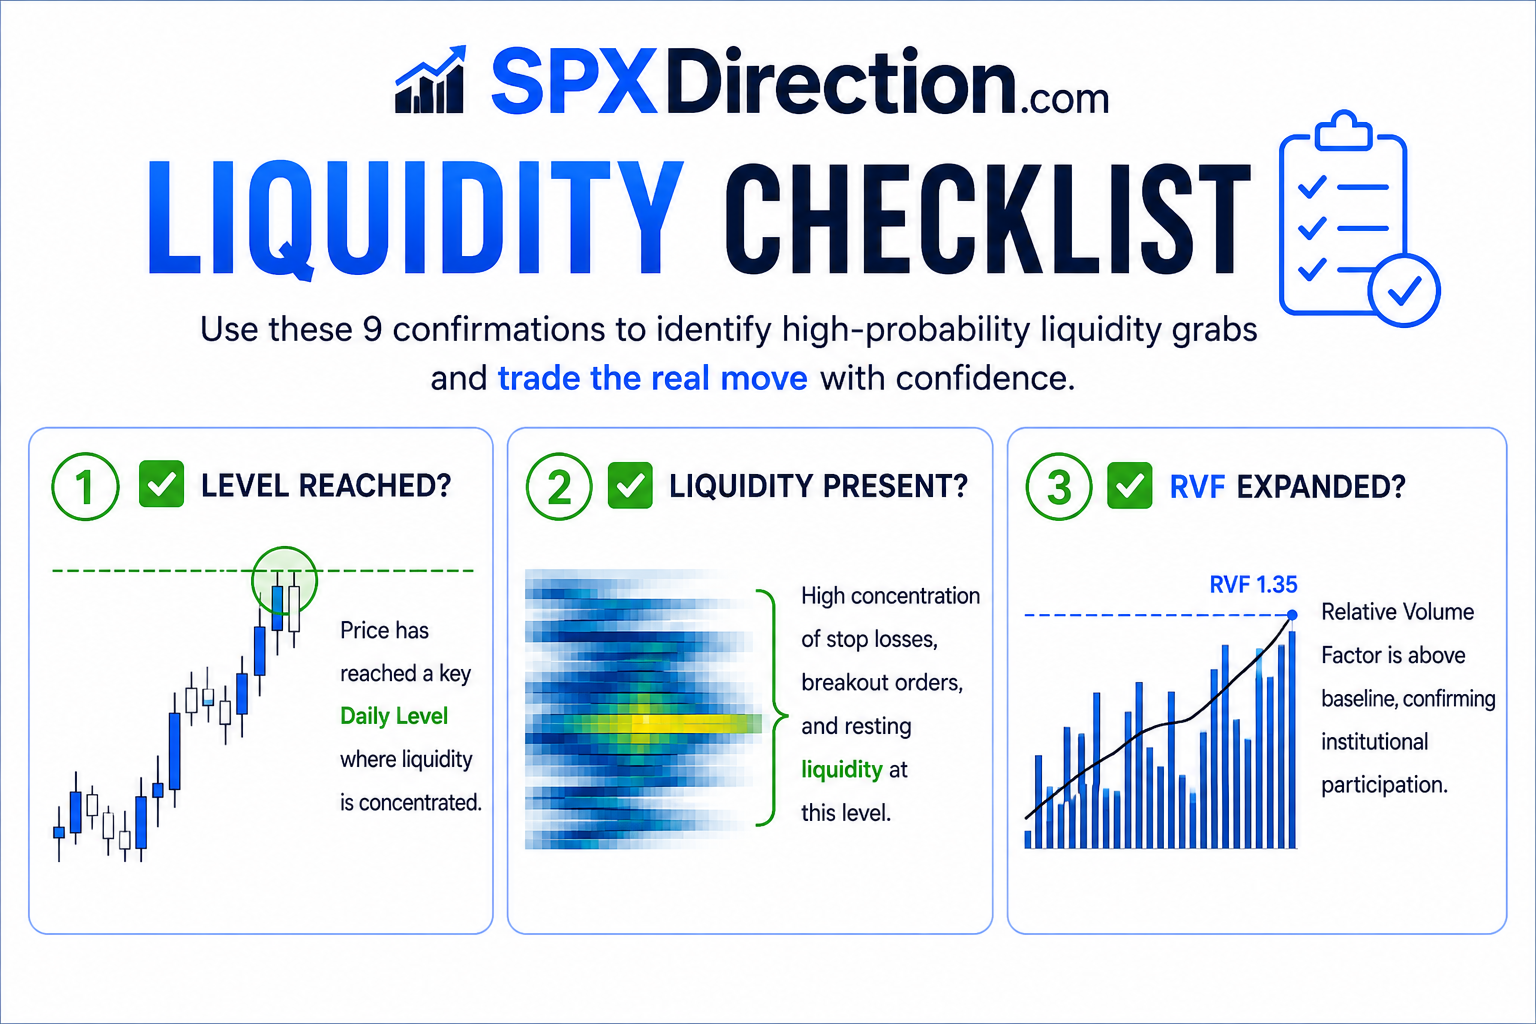
- Price reaches a Daily Level
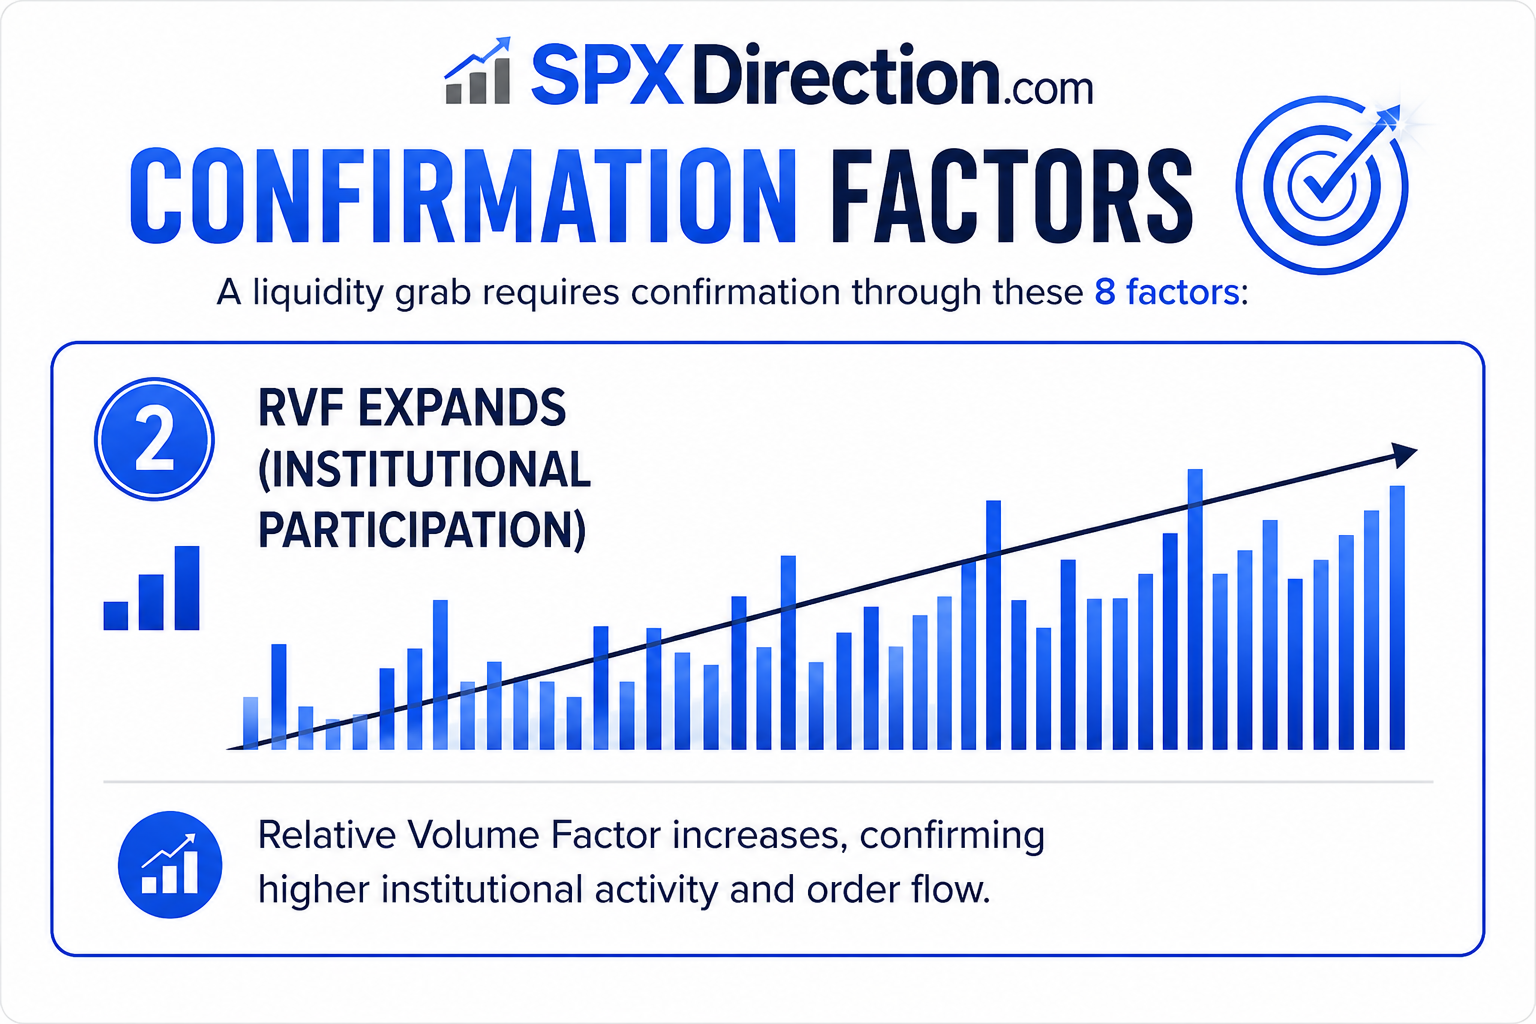
- RVF expands (institutional participation)
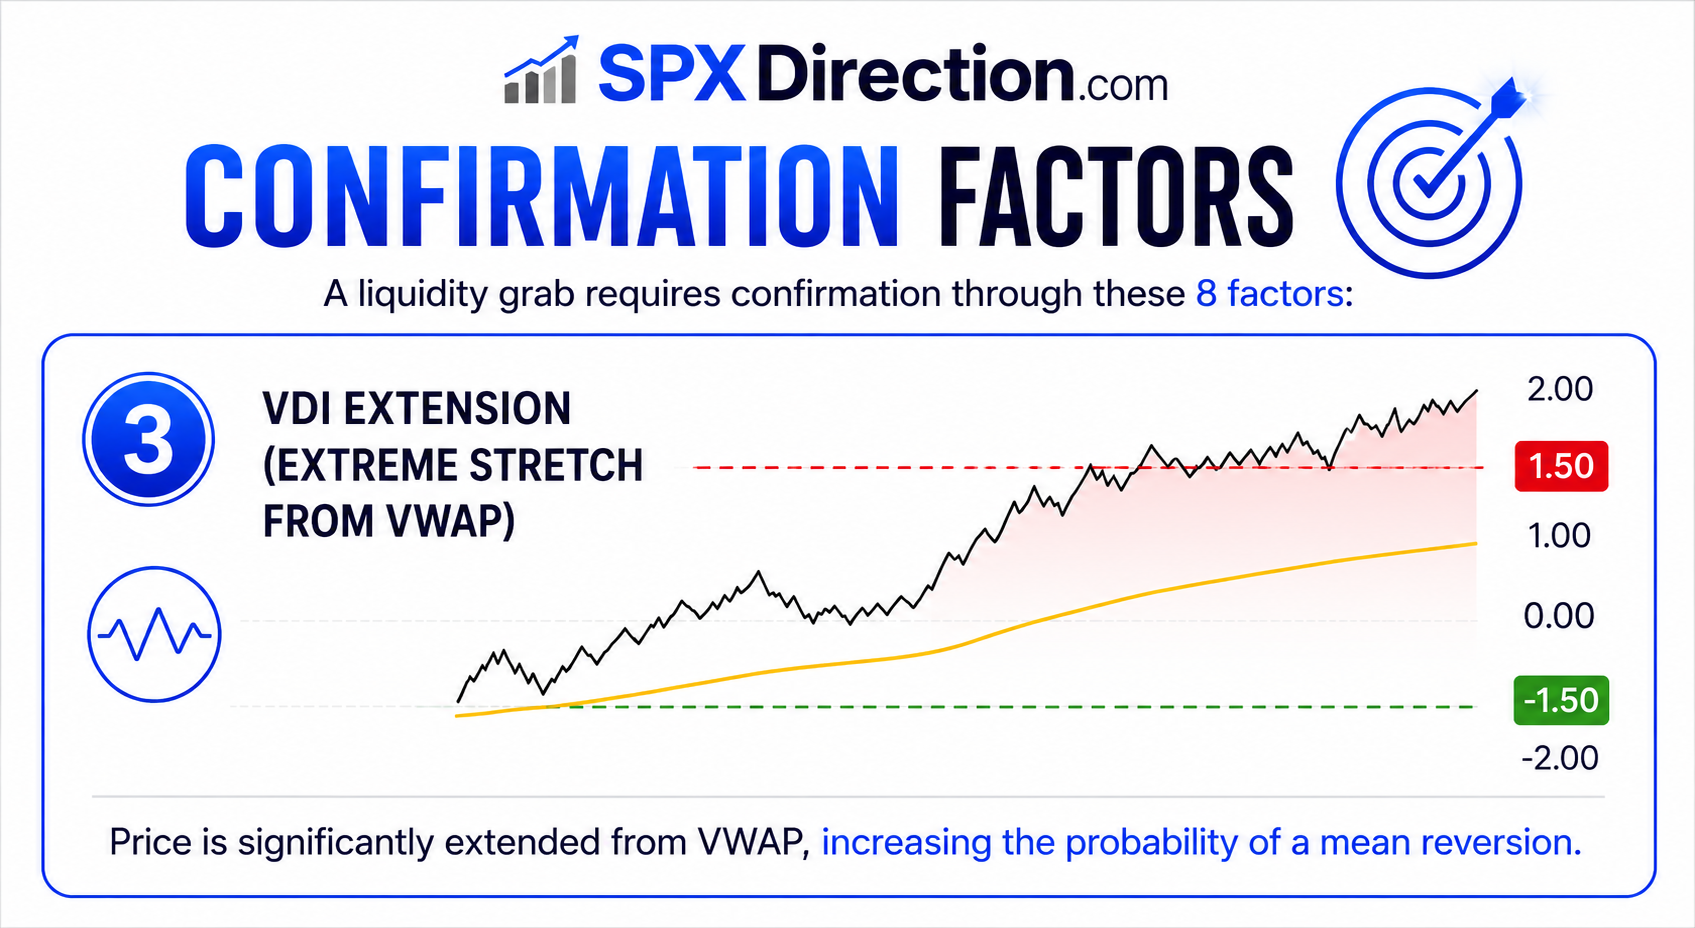
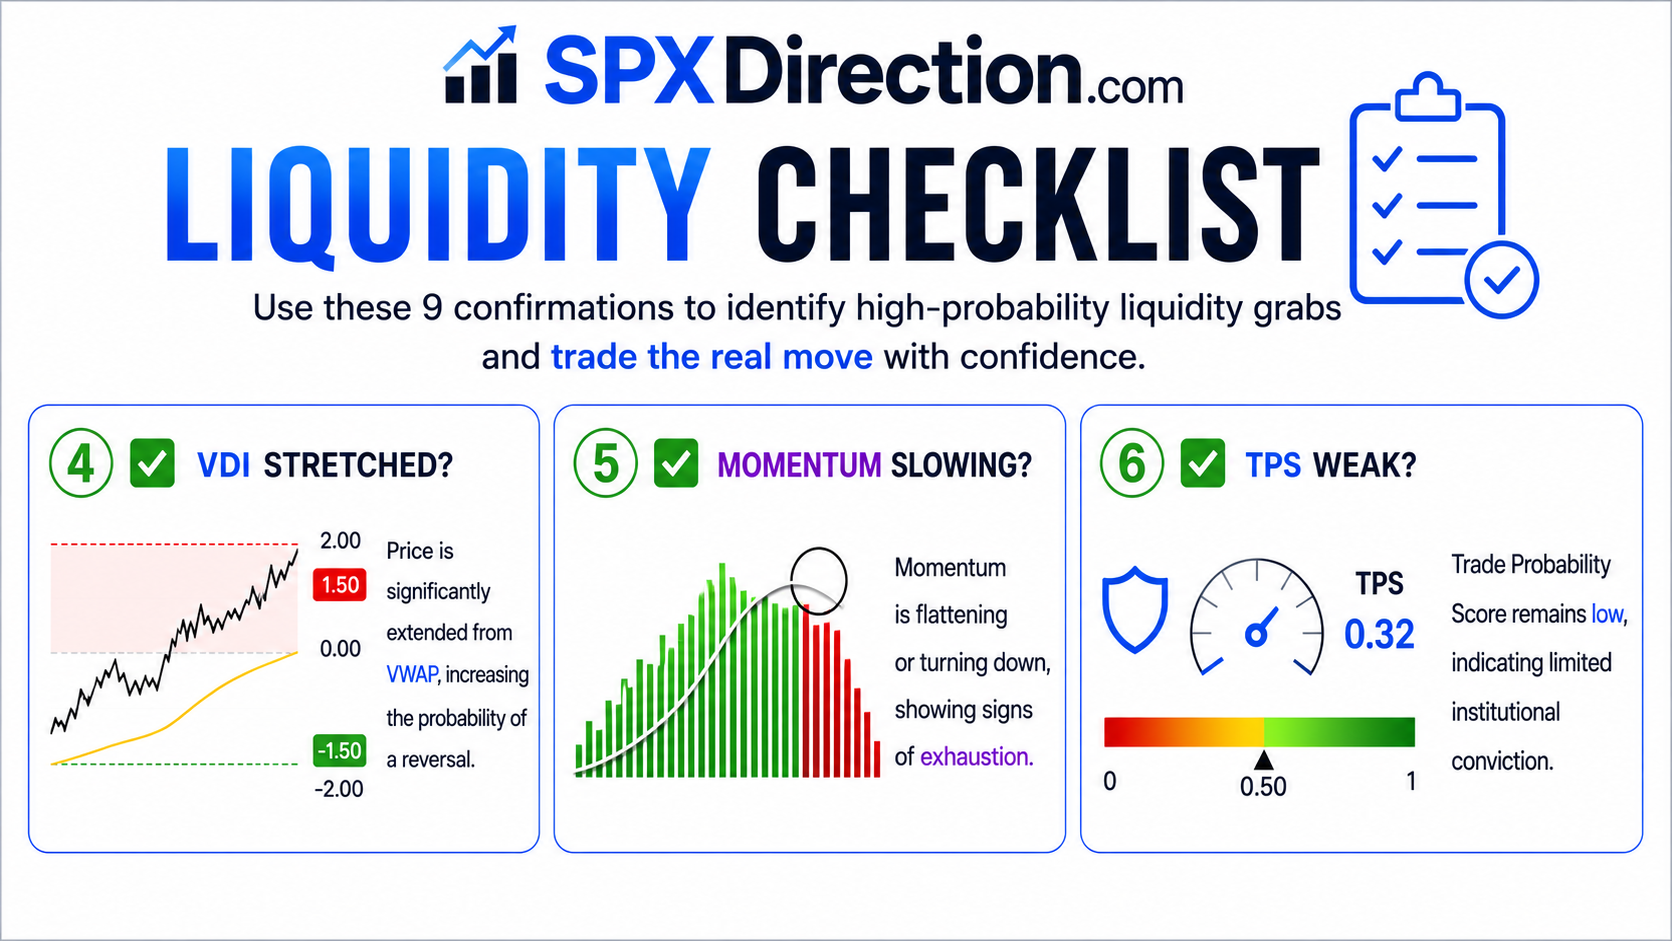
- VDI extension (extreme stretch from VWAP)
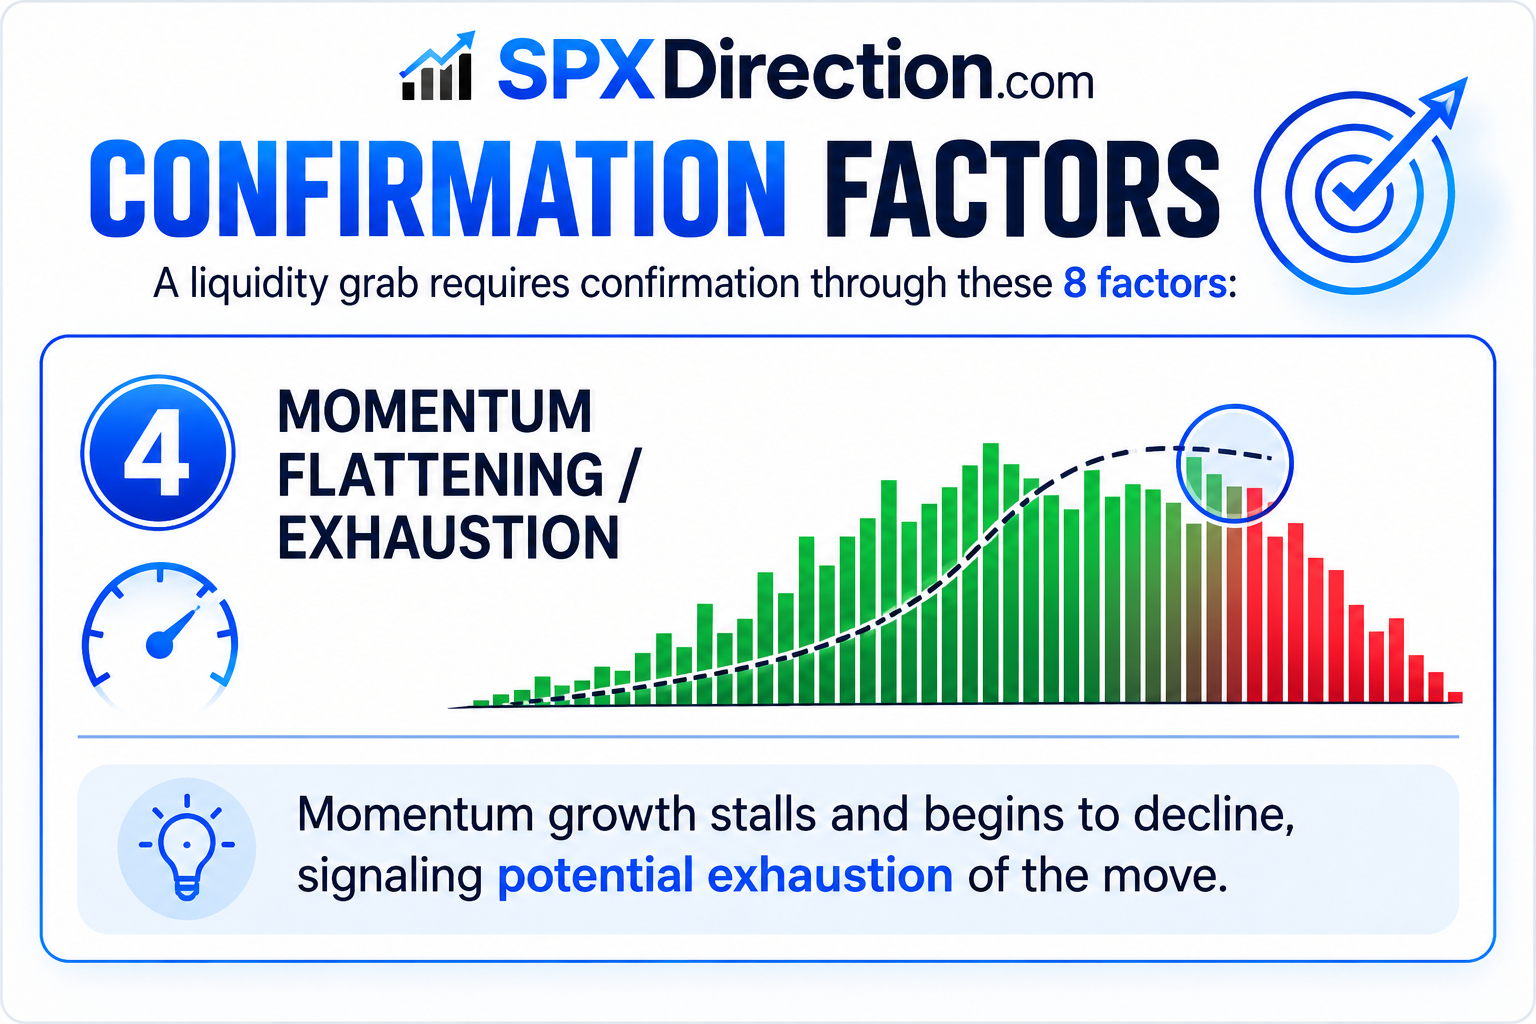
- Momentum flattening/exhaustion
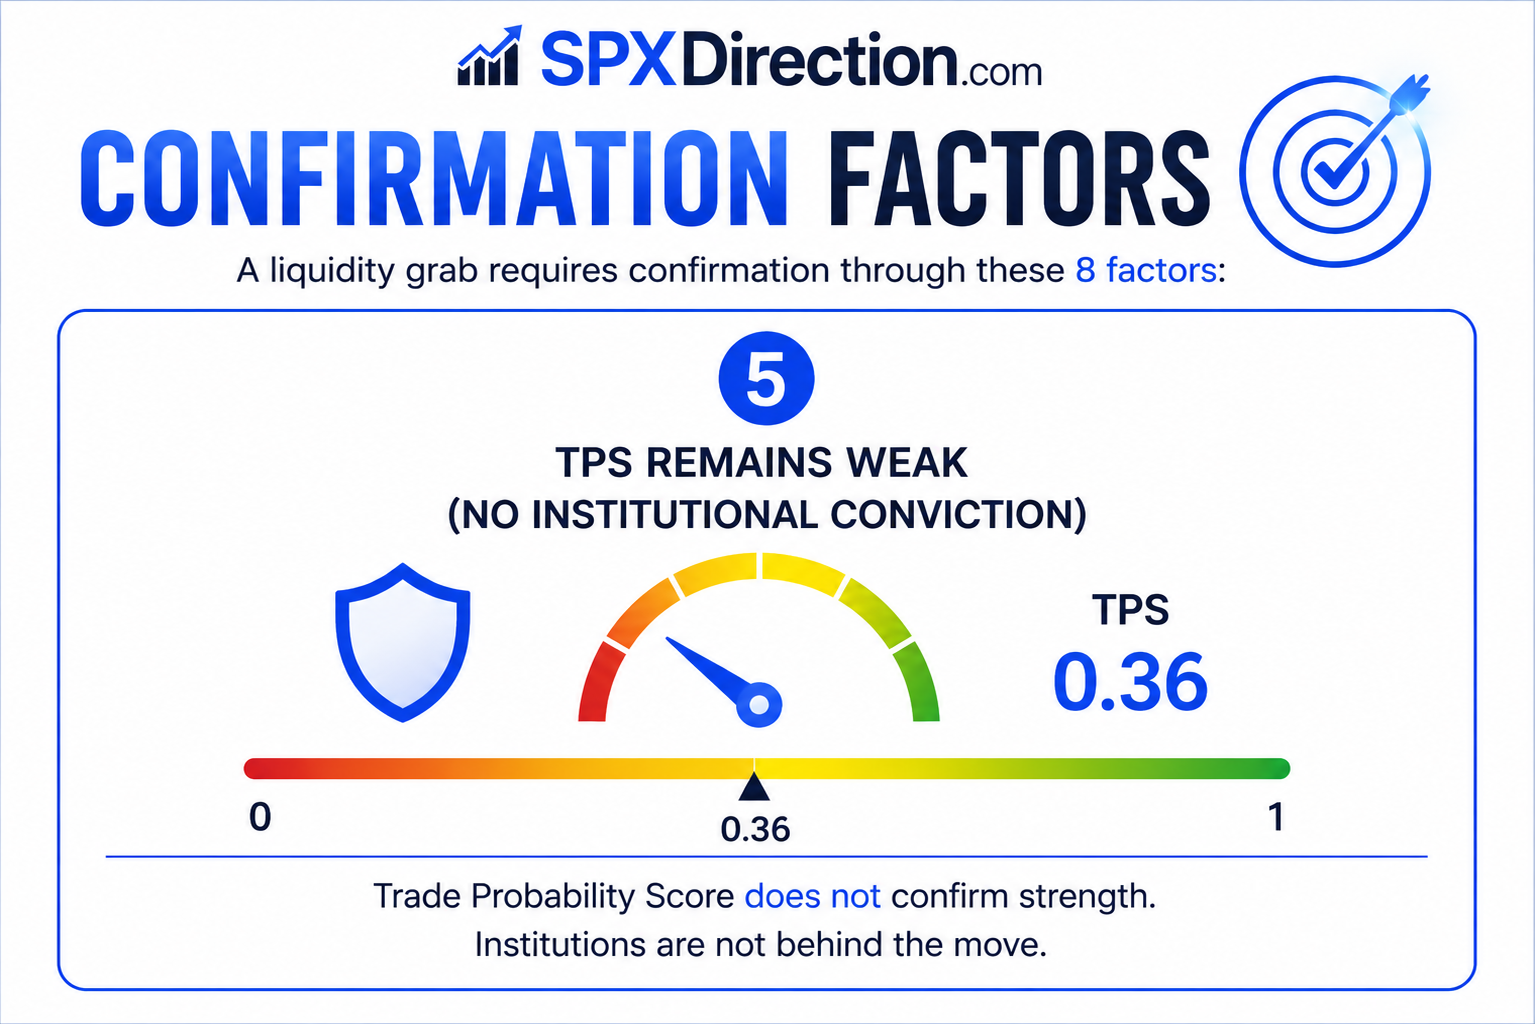
- TPS remains weak (no institutional conviction)
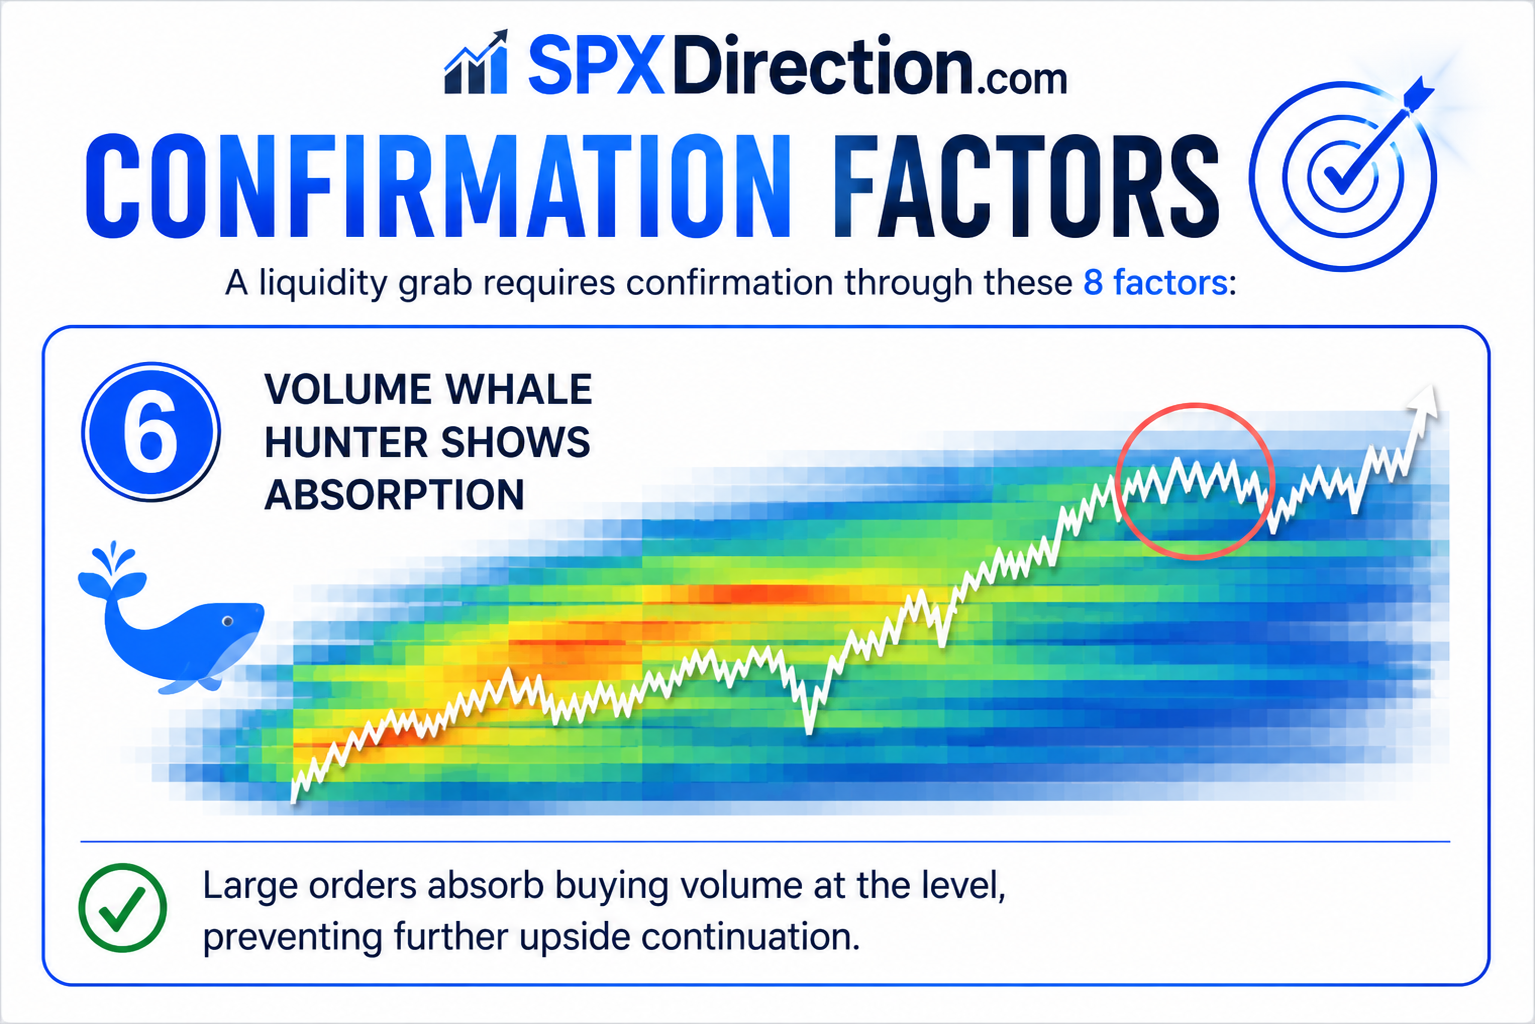
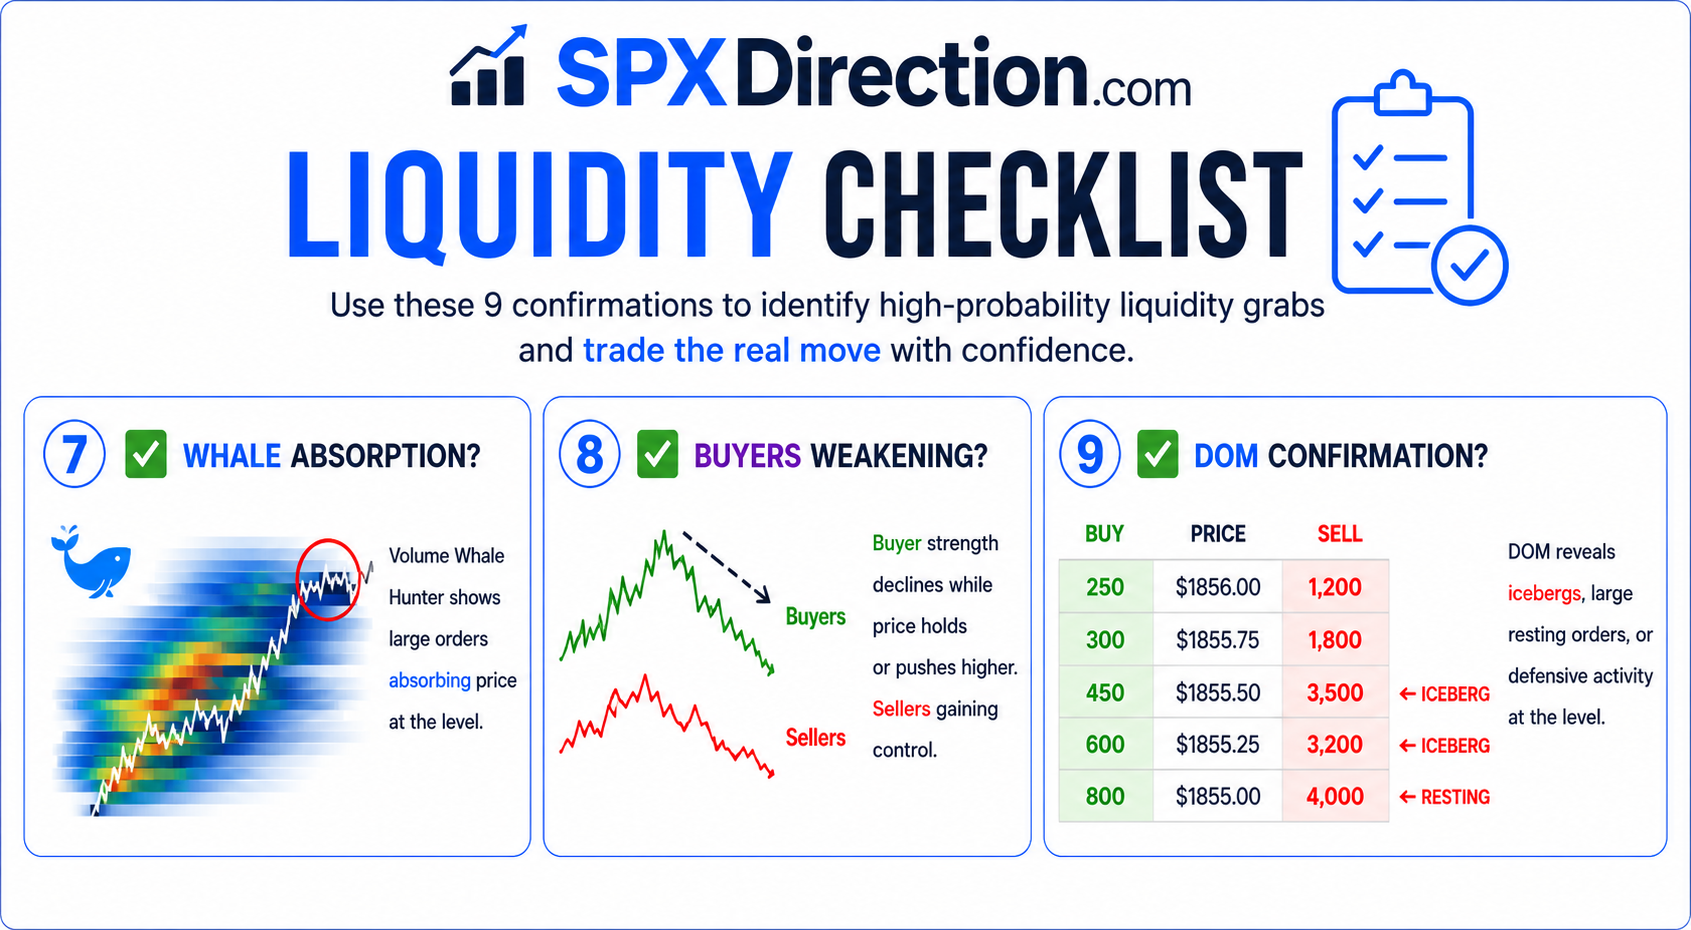
- Volume Whale Hunter shows absorption
- Buyer vs. Seller divergence
- DOM reveals defends (icebergs/resting orders)

Liquidity Checklist
✅ Level reached? | ✅ Liquidity present? | ✅ RVF expanded?
✅ VDI stretched? | ✅ Momentum slowing? | ✅ TPS weak?
✅ Whale absorption? | ✅ Buyers weakening? | ✅ DOM confirmation?
Trend vs. Reversal
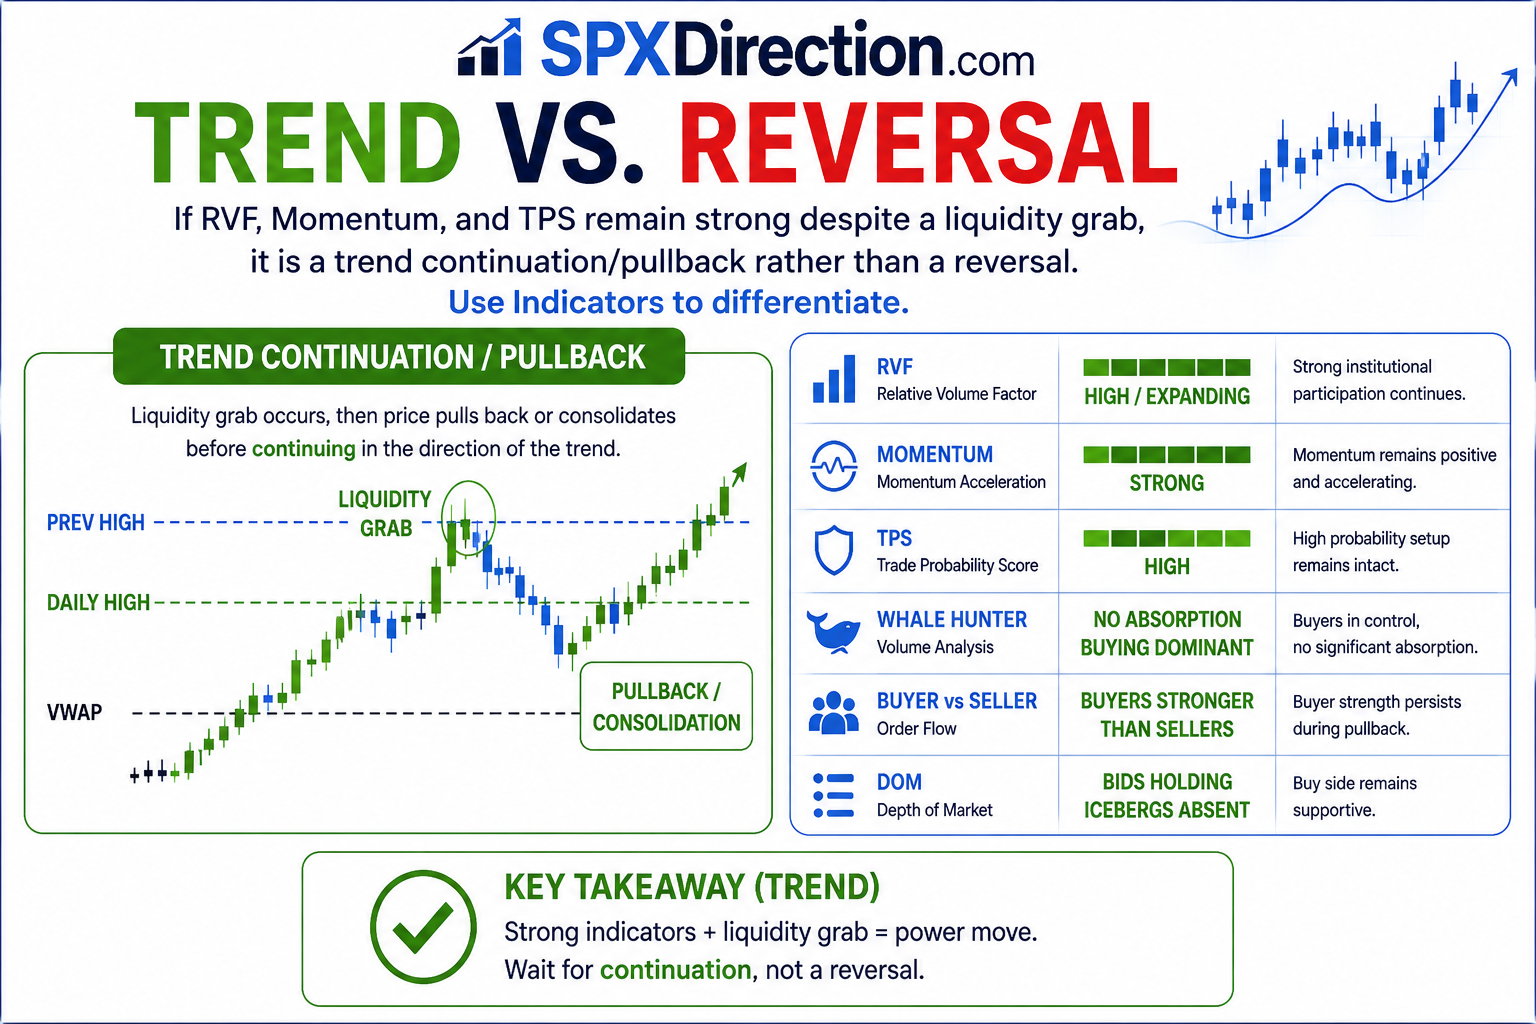
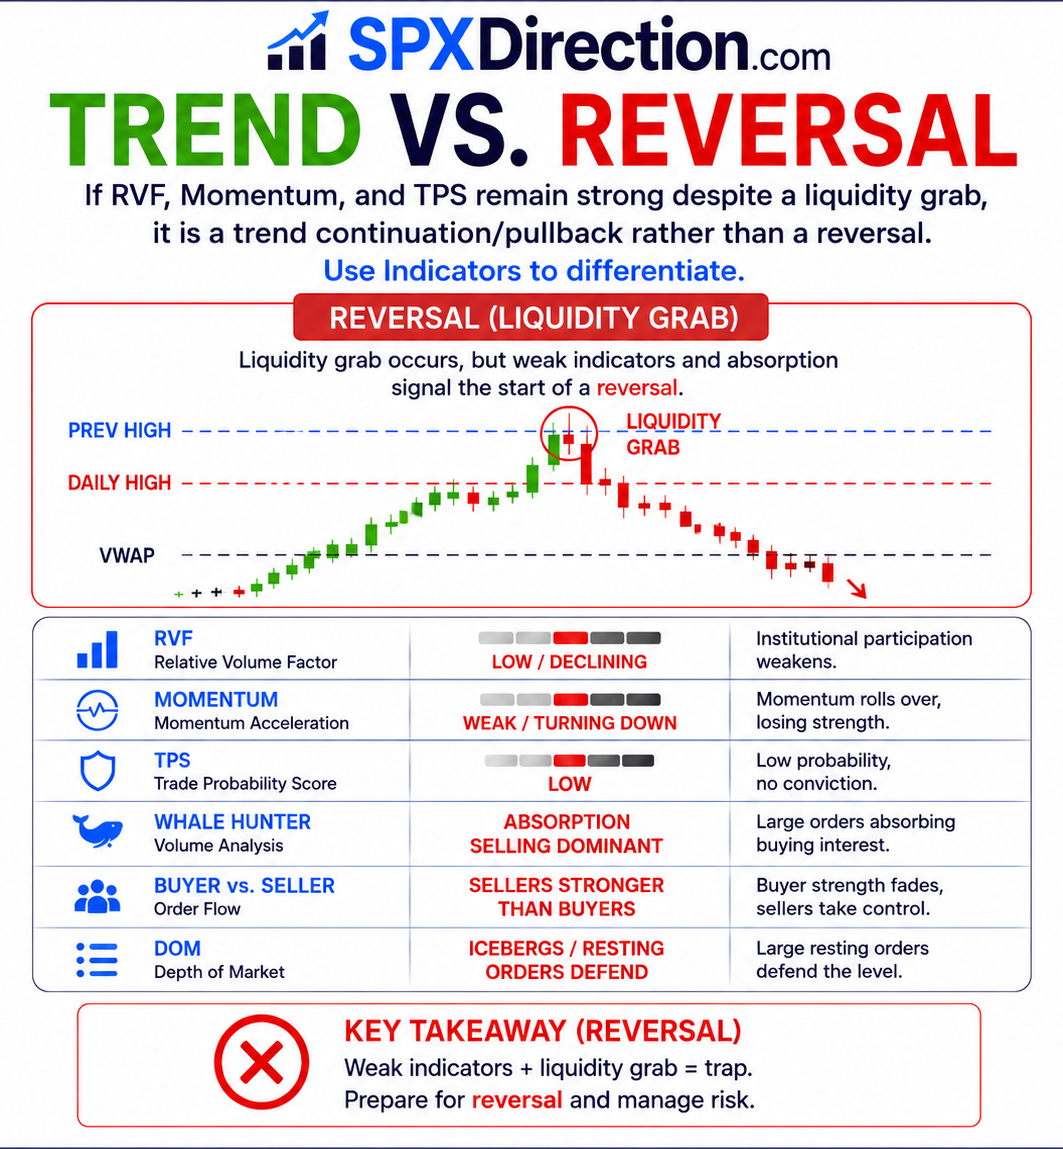
If RVF, Momentum, and TPS remain strong despite a liquidity grab, there is a higher probability of a trend continuation/pullback rather than a reversal.
Beginner vs. Professional
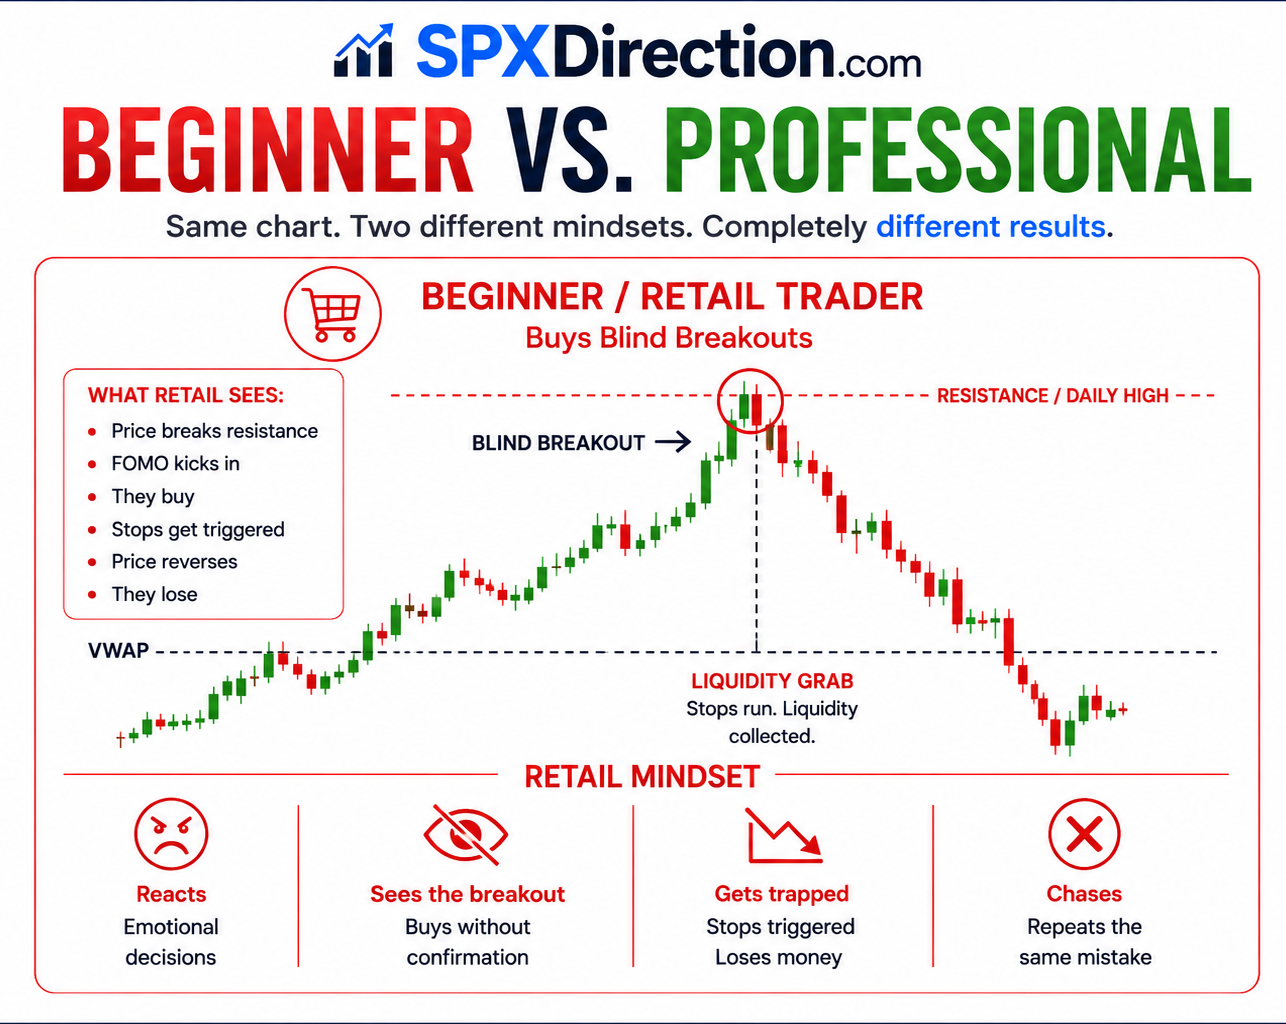
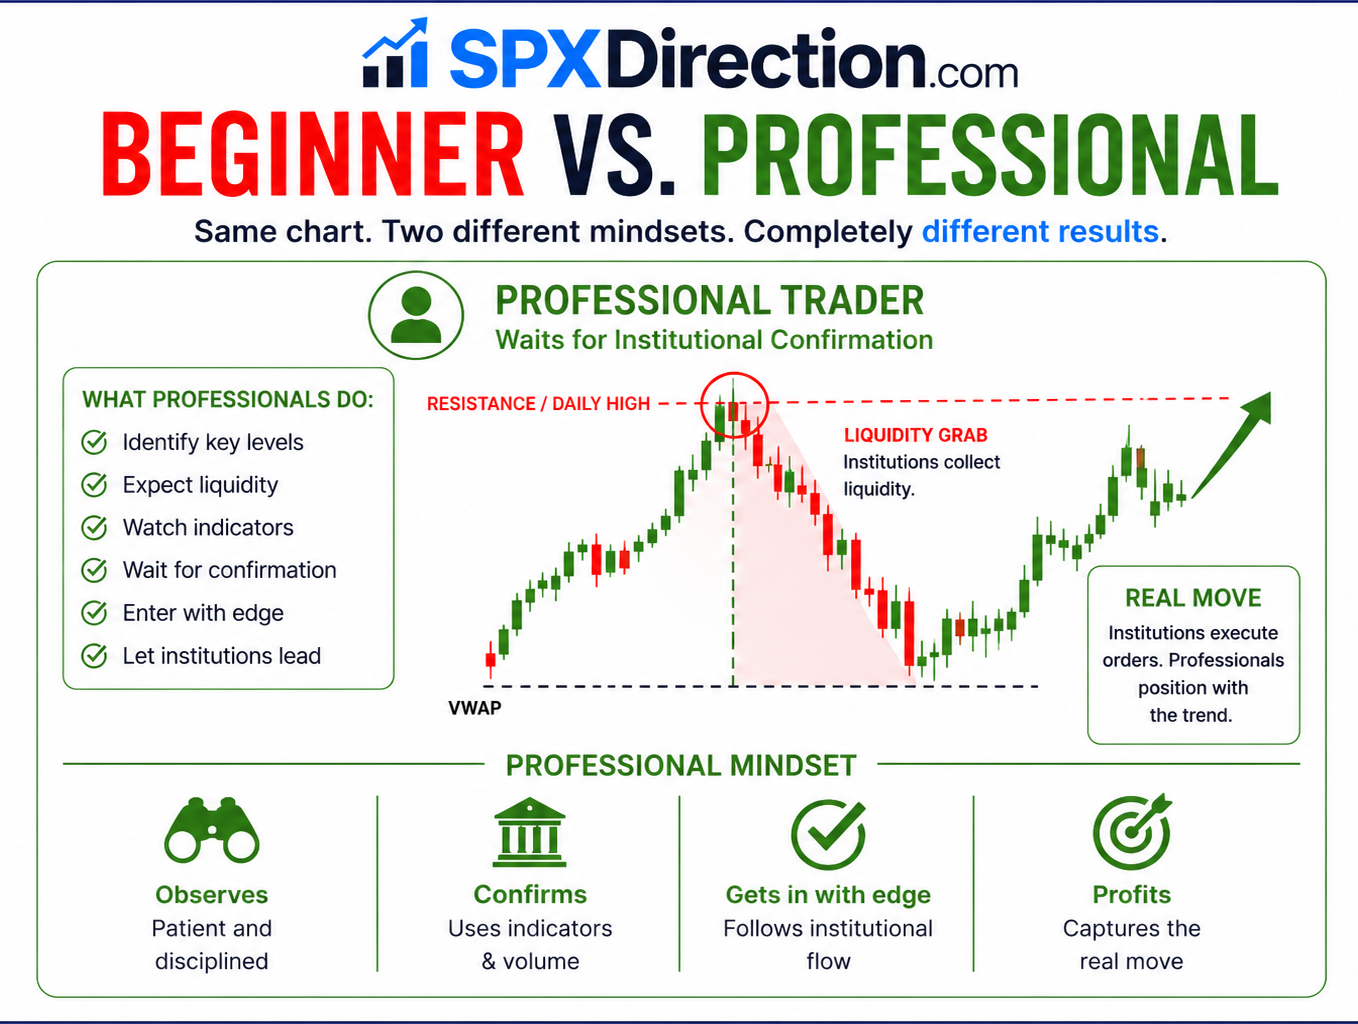
Retailers buy blind breakouts. Professionals wait to see if institutions accept those new prices or are merely hunting liquidity.
Key Takeaway
Daily Levels identify where decisions happen; your job is to observe institutional behavior at these levels and react to it, not predict it.