ES Directional Signals & Intraday Levels
Contact customer support at support@spxdirection.com
ES Directional Signals & Intraday Levels - Technical Framework for Intraday Execution
The ES Directional Signals module generates real-time buy-sell triggers and trend classification data based on algorithmic analysis of price action and momentum parameters.
Optimal Signal Confirmation Protocol:
For maximum statistical edge, directional signals require multi-factor confirmation through the complete SPX Direction parameter suite:
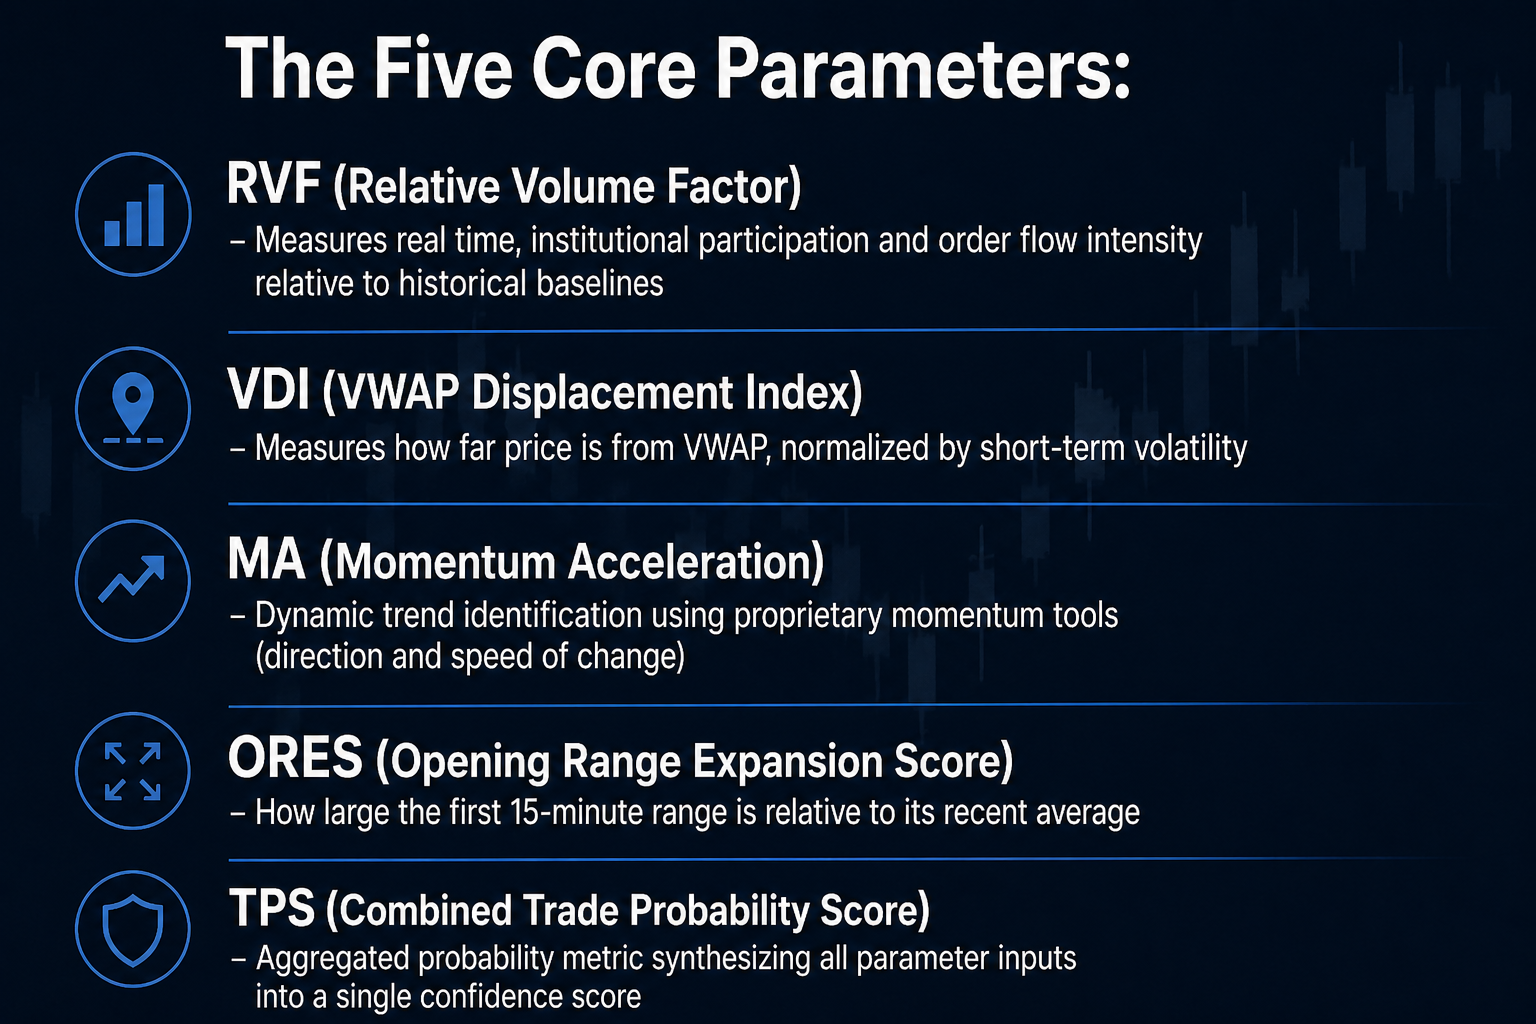
The Five Core Parameters:
RVF (Relative Volume Factor) - Measures real time, institutional participation and order flow intensity relative to historical baselines
VDI (VWAP Displacement Index) - Measures how far price is from VWAP, normalized by short-term volatility
MA (Momentum Acceleration) - Dynamic trend identification using proprietary momentum tools (direction and speed of change)
ORES (Opening Range Expansion Score) - How large the first 15-minute range is relative to its recent average
TPS (Combined Trade Probability Score) - Aggregated probability metric synthesizing all parameter inputs into a single confidence score
Strategic Application Framework:
Intraday Levels = Market Structure
These are your objective reference points - support/resistance zones, pivot levels, and liquidity areas that define the technical architecture of the trading session. Think of these as your map.
SPX Direction Parameters + Real-Time Volume Analysis = Execution Tools
This is your tactical layer. While intraday levels tell you WHERE the market may react, the five parameters plus volume analysis tell you WHEN to execute and in WHICH direction.
Our most successful members watch these parameters as price approaches key results while remaining within your risk parameters (2R).
Trade Construction Methodology:
1. Identify key intraday structural levels displayed on our charts
2. Monitor momentum and RVF slope for direction of the market and "strength of that direction"
3. Confirm signal validity through parameter convergence (RVF, VDI, MA, ORES)
4. Further validate with TPS probability score
5. Analyze volume behavior at critical price levels
6. Execute when multiple parameters align with directional signal near structural levels
This multi-layered confirmation process filters low-probability setups and isolates high-conviction trade opportunities with a quantifiable edge.
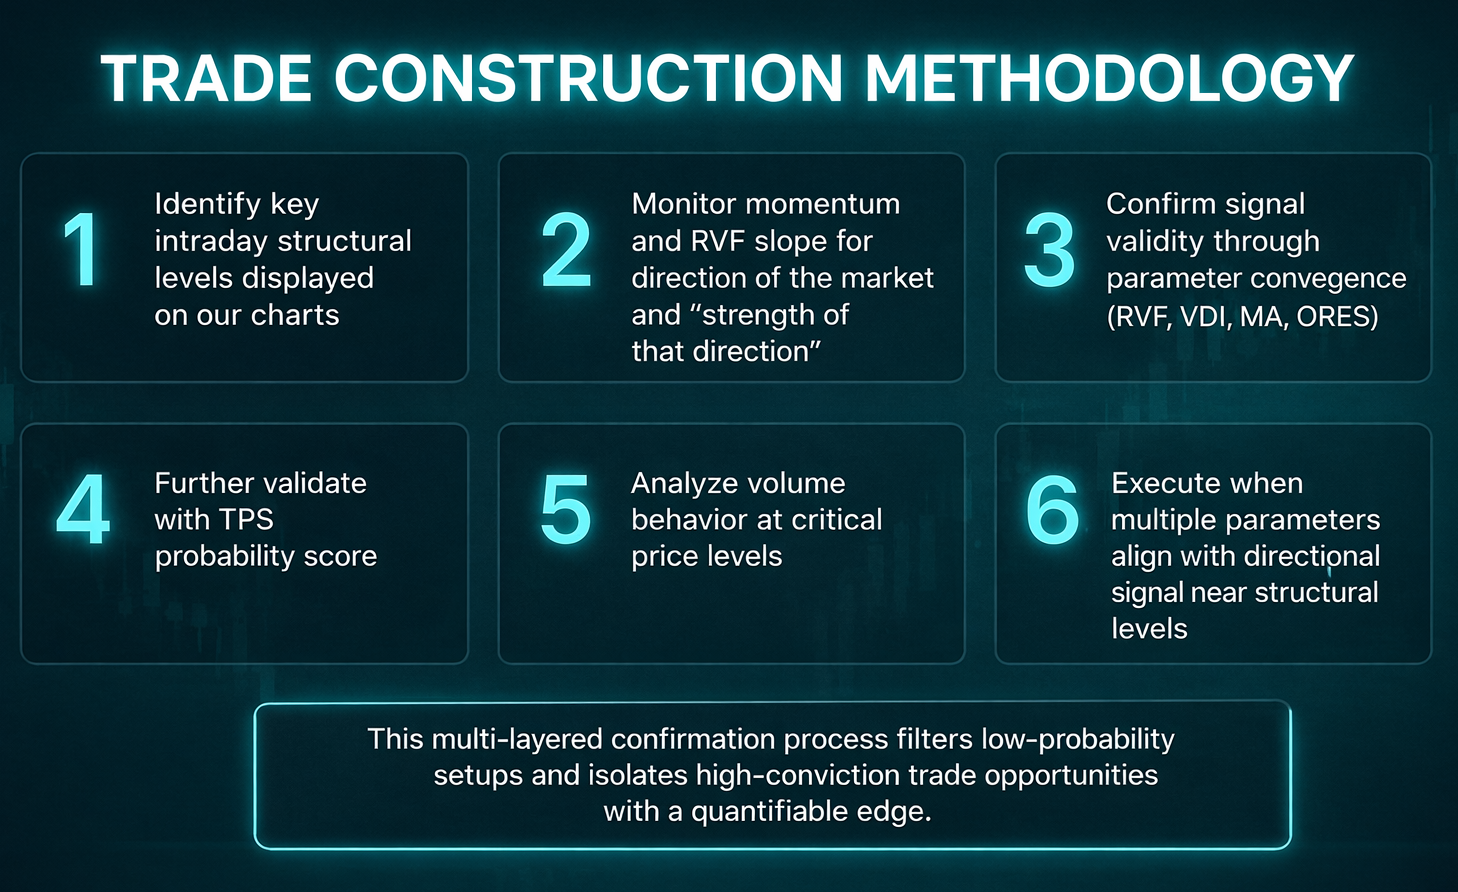
Chart 1 - Institutional Intraday Levels
The first chart displays 15-minute candles of the ES with important underlying institutional levels. These levels include, but are not limited to:
- VWAP - Volume Weighted Average Profile
- Daily High/Low (DH/DL)
- Yesterday's levels: YH / YL / YC / YM (yesterday high/low/close/mid)
- Weekly range: WH / WL (calculated from the last 5 daily candle highest highs/lowest lows)
- Initial Open Range (IOR): IOH / IOL (high/low of the 30 minutes of NYC open)
- Opening Range (OR): OH / OL / OM (high/low/mid of the first hour of NYC open)
Actionable insight :
Use our indicators (SPX Direction Momentum, SPX Super DMI Strength) and parameter suite (RVF, VDI, ORES, MA and TPS) to analyze how price reacts around these important institutional levels to make trading decisions.
On trend days, the price moves quickly through important levels. On choppy consolidation days, the price bounces back and forth between levels.
Trades in the direction of the 30-minute momentum and supported by our MA and VDI reading > 0.65 have a 70% or higher probability of success.
Chart 2 - 30-minute Momentum Analysis
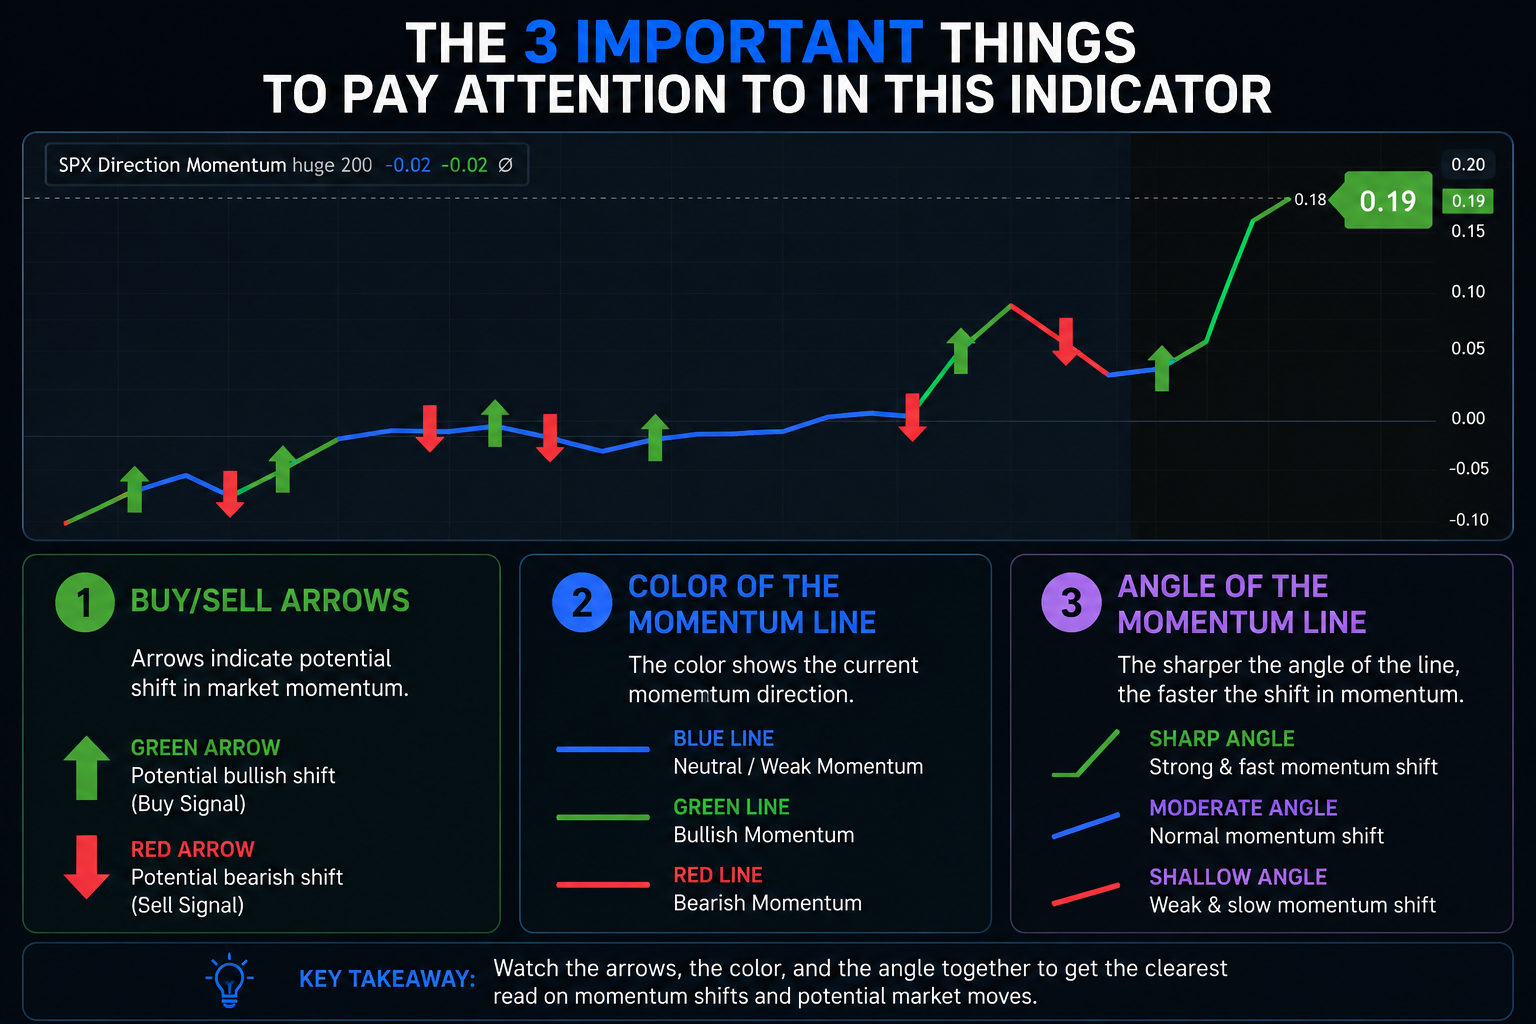
The second chart displays the 30 minute momentum trend of the underlying market with buy/sell signals using the 30-minute time frame. The green buy arrows and the red sell arrows are significant predictors of strength in the next 30-60 minutes.
This chart is powered by the proprietary SPX direction momentum indicator, an invite-only indicator available to our members for TradingView.
Please contact customer support to unlock access to these indicators.
SPX direction uses a proprietary algorithm that analyzes the MAG7 stocks (Apple, Microsoft, Meta, Google, Amazon, Nvidia, Tesla) and consolidates all their price action in real time to analyze the underlying direction of the market.
The 3 important things to pay attention in this indicator are Buy/sell arrows, the color of the momentum line, and the angle of the momentum line. The sharper the angle of the line, the faster the shift in the momentum.
Actionable insight
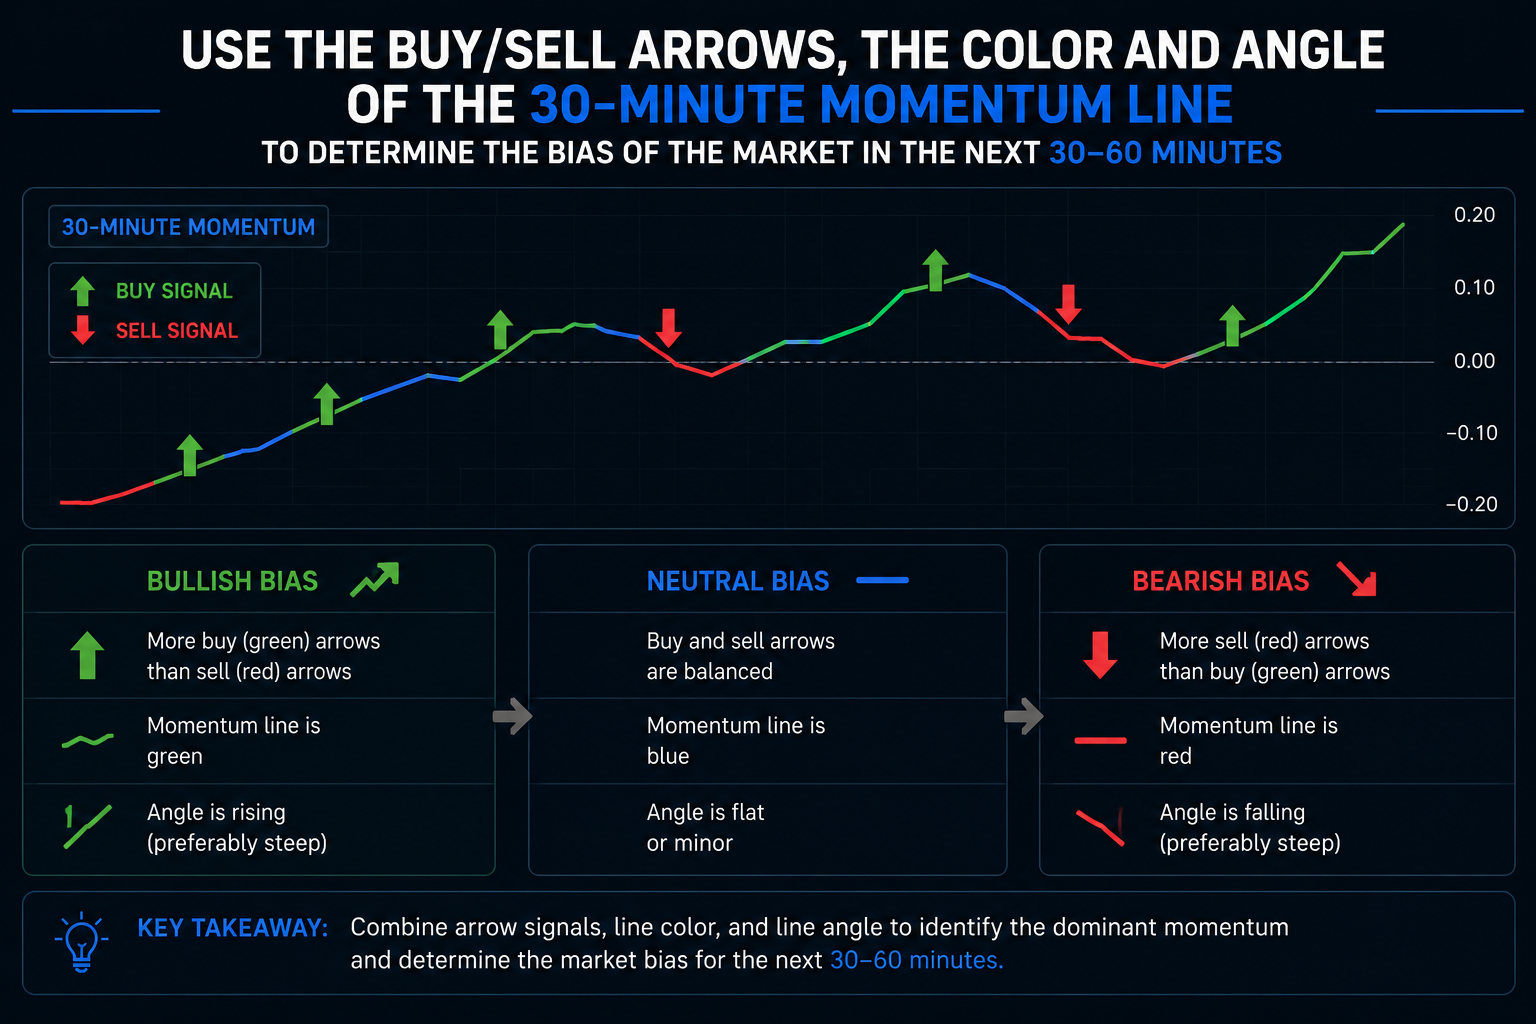
Use the buy/sell arrows, the color and angle of the 30-minute momentum line to determine the bias of the market in the next 30-60 minutes.
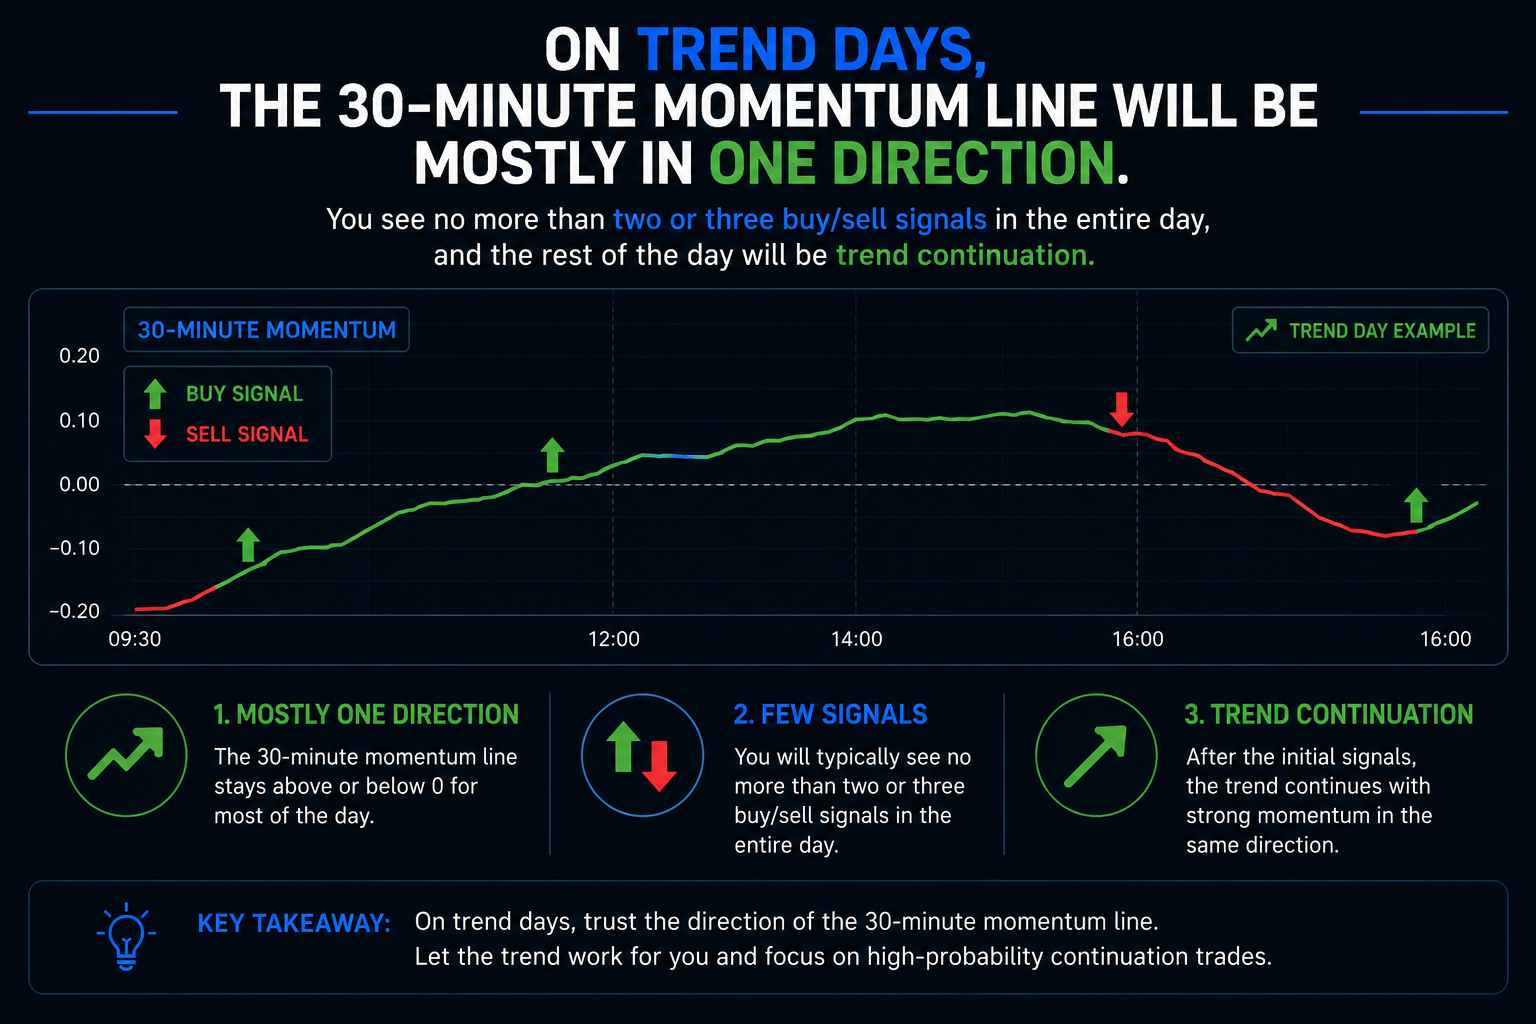
On trend days, the 30-minute momentum line will be mostly in one direction. You see no more than two or three buy sell signals in the entire day, and the rest of the day will be trend continuation.
On choppy consolidation days, the 30-minute momentum line will go up and down. This is also significant because it indicates the market tightening before the next trend move.
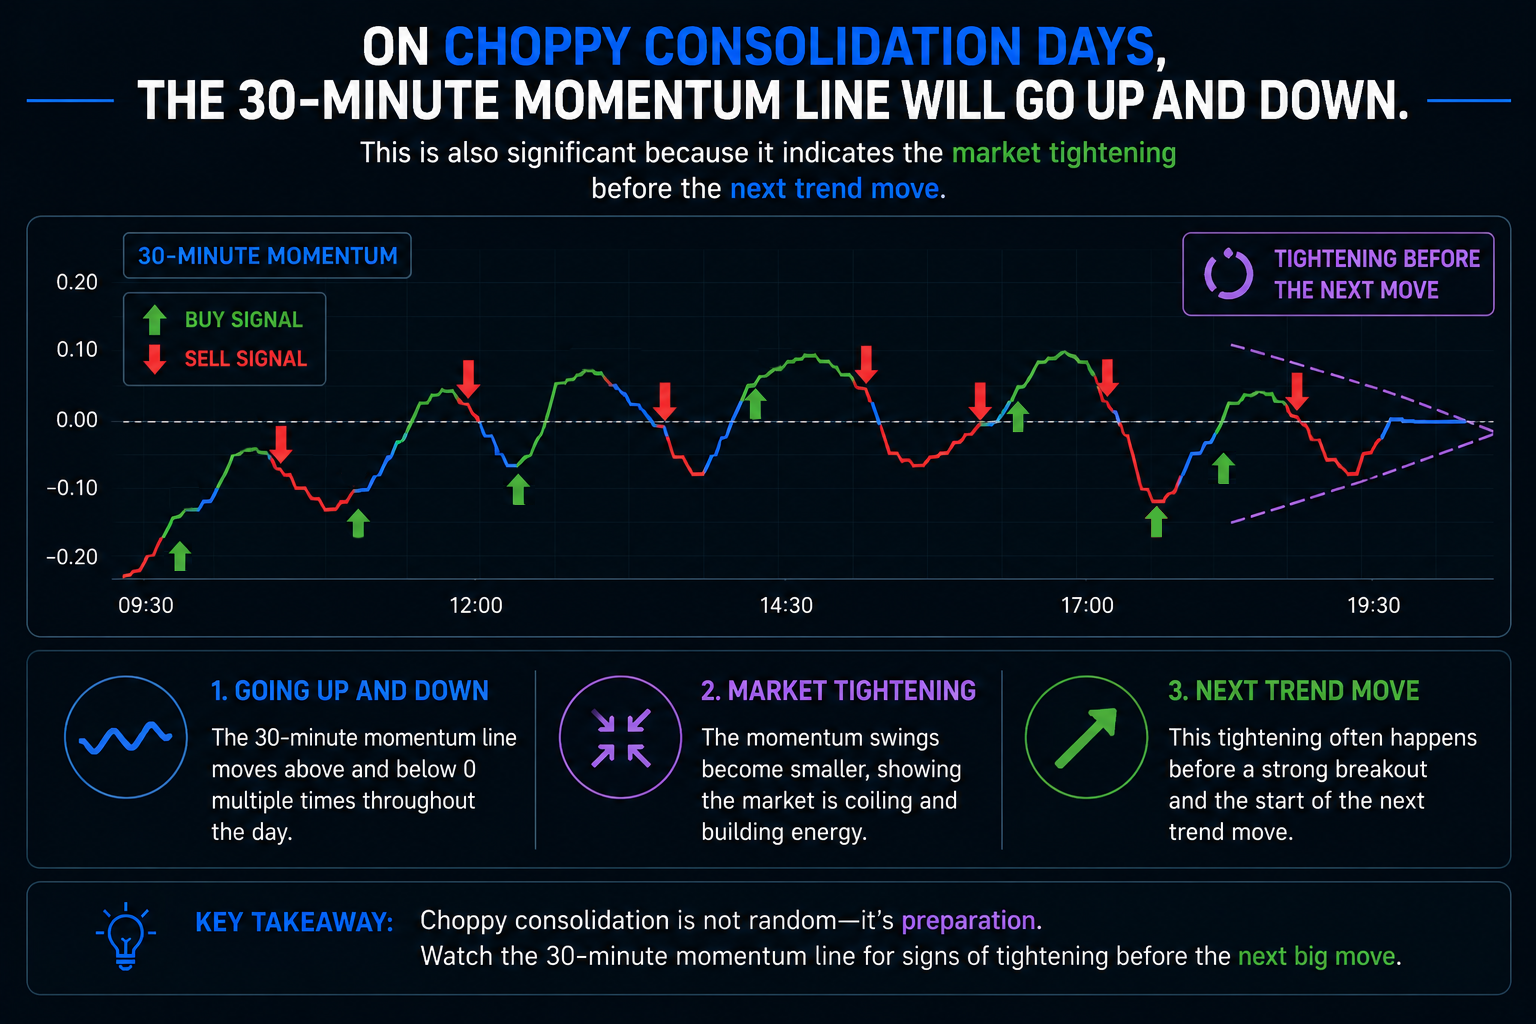
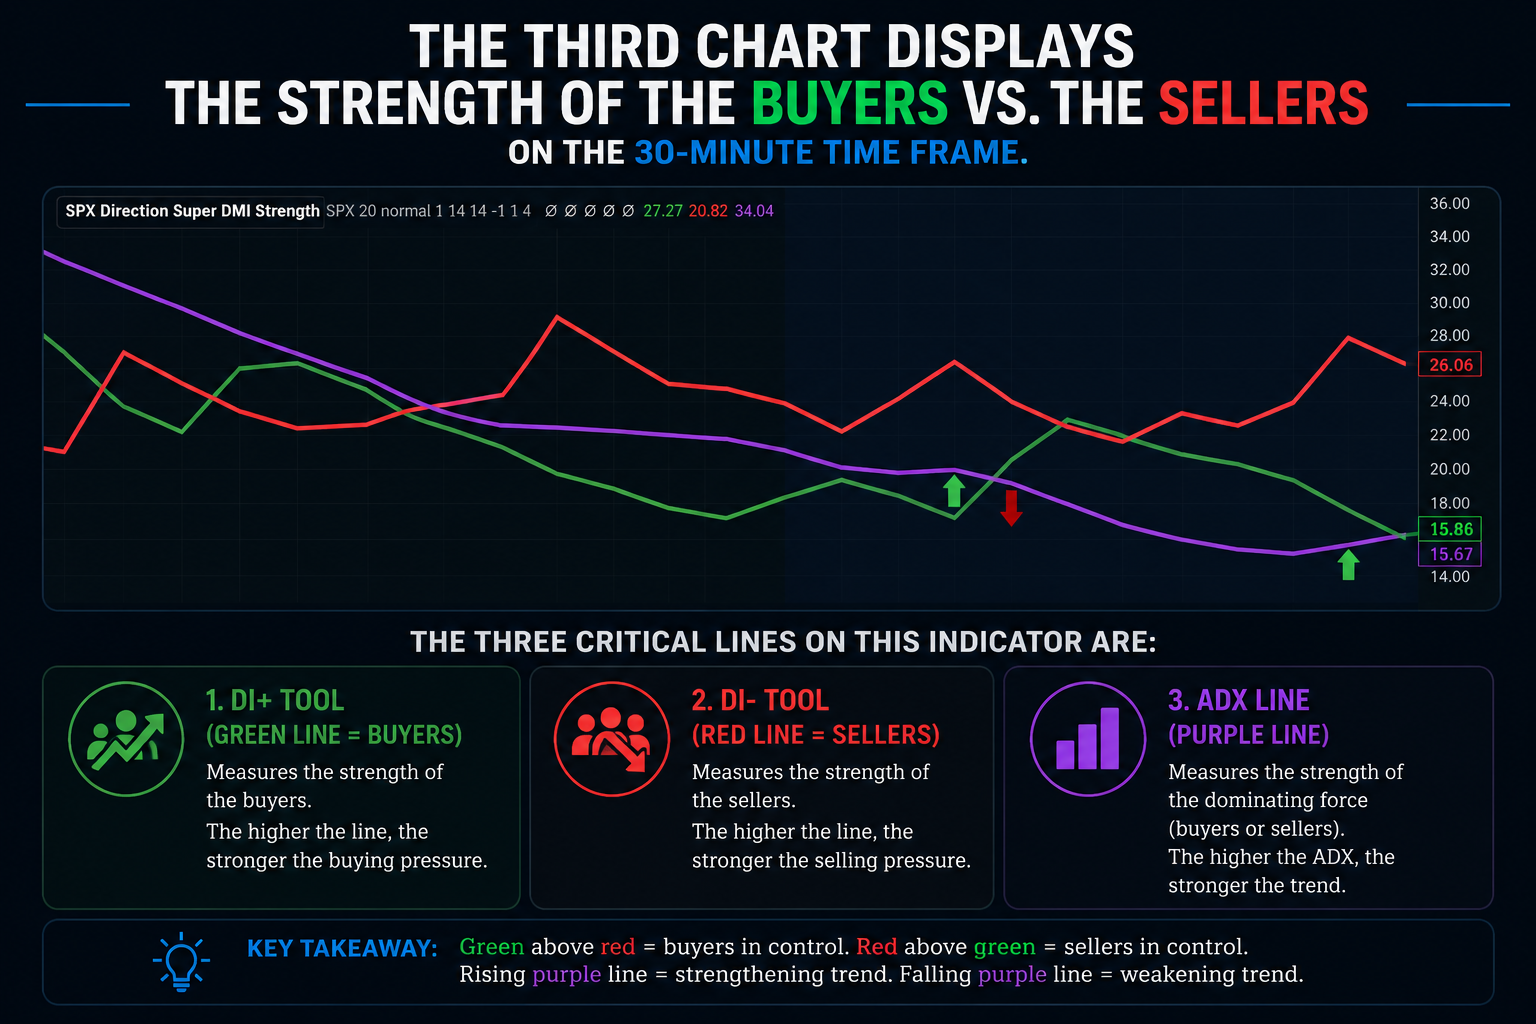
Chart 3 - 30-minute Super DMI Analysis

The third chart displays the strength of the buyers versus the sellers on the 30-minute time frame. The three critical lines on this indicator are:
- the DI+ tool (green line = buyers)
- the DI- tool (red line = sellers)
- the ADX line; strength of the dominating force (buyers or sellers)
This chart is powered by the proprietary SPX direction Super DMI indicator, an invite-only indicator available to our members for TradingView. Please contact customer support to unlock access to these indicators.
SPX direction uses a proprietary algorithm that analyzes the MAG7 stocks (Apple, Microsoft, Meta, Google, Amazon, Nvidia, Tesla) and interprets not only who is dominating at a given moment in time but also whether the strength of that dominating force is increasing or decreasing. This is what sets apart the Super DMI tool from the Momentum tool.
The Momentum tool represents speed, and the Super DMI tool represents power.
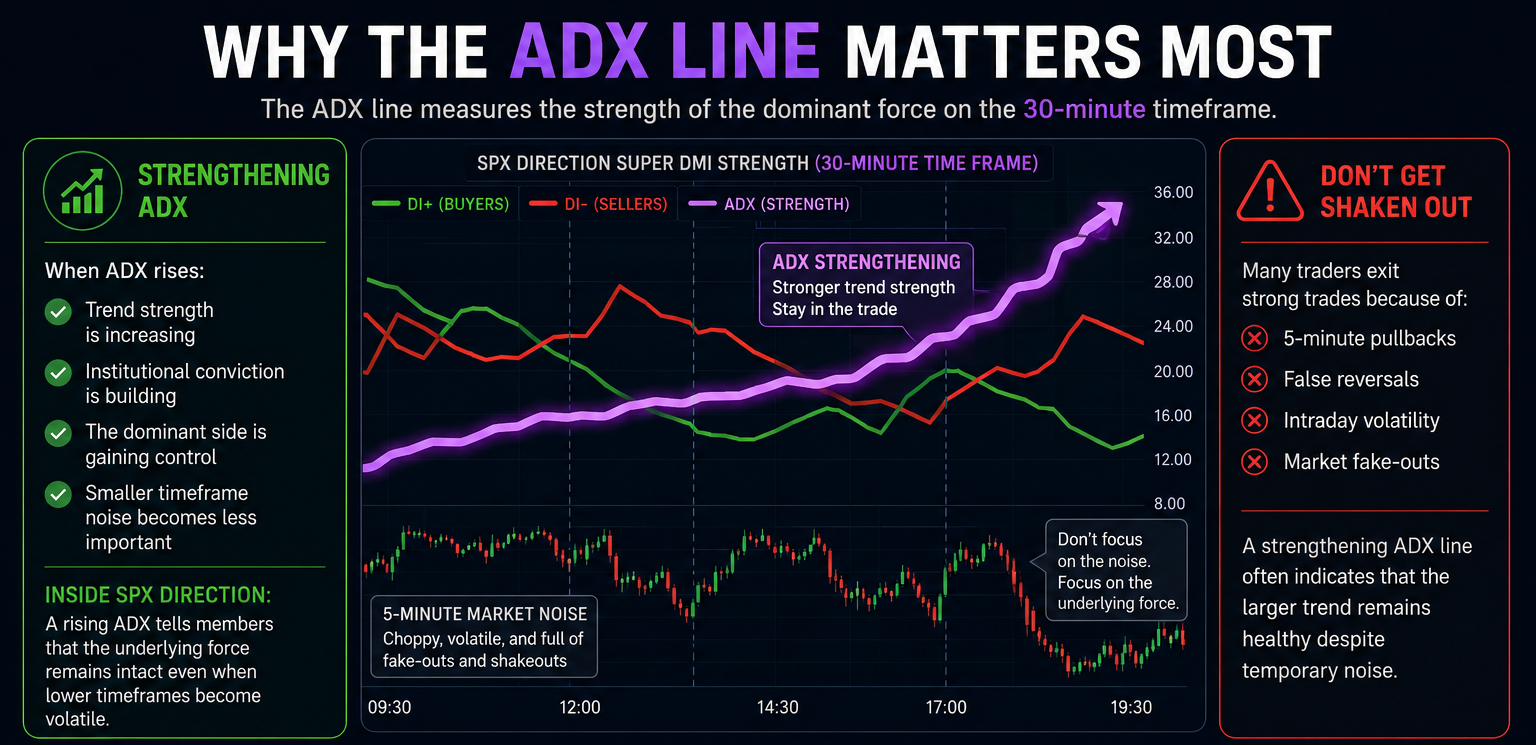
The most important thing to pay attention to in this indicator is the strength of the ADX line. As the ADX line becomes stronger (as its value increases) on the 30-minute time frame, it represents an increase in strength of the underlying force despite market gyrations and fake-outs on the smaller time frames like the 5-minute. A strengthening ADX line advises our members to stay in the trade and not get ‘shaken out’.
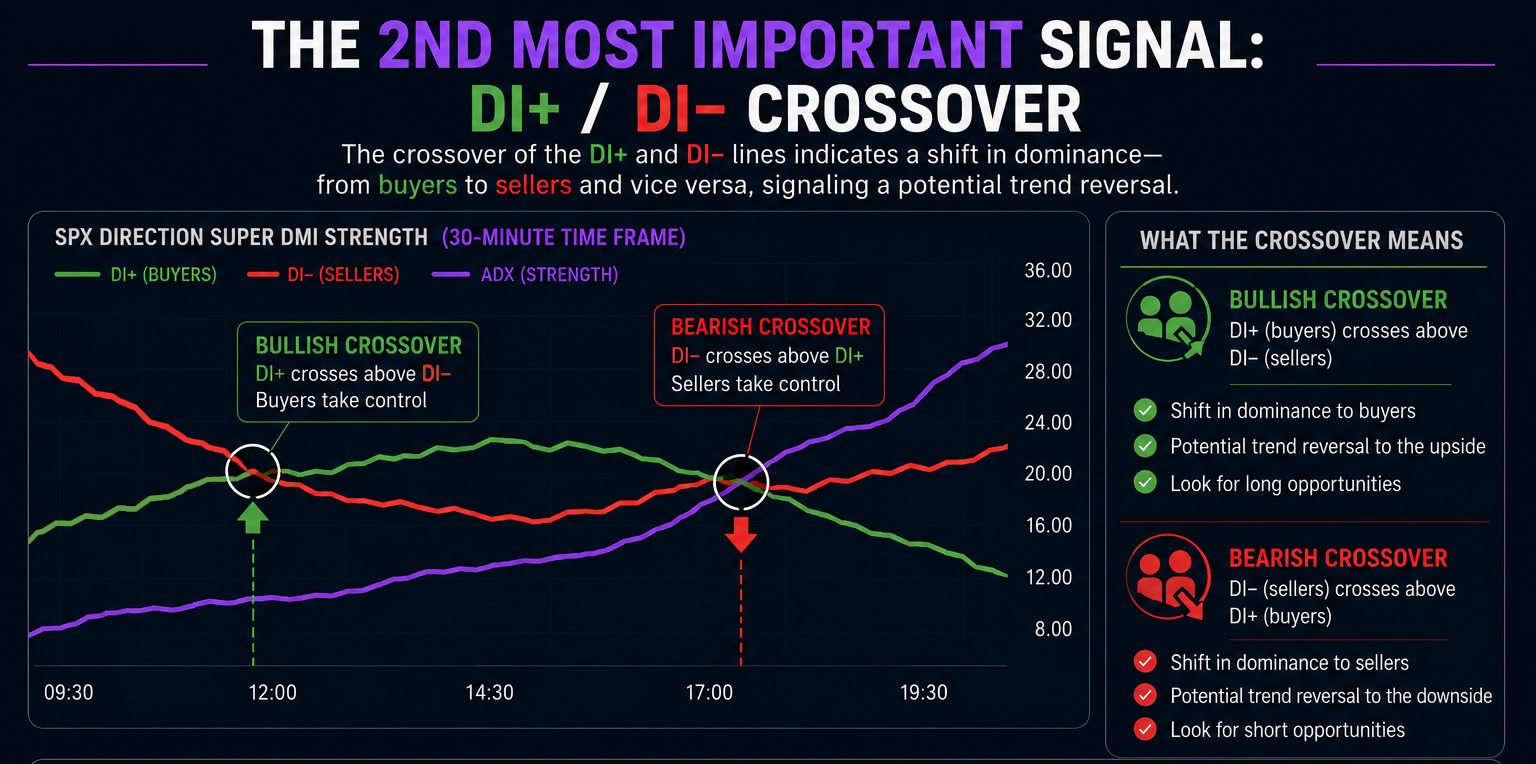
The second most important thing to pay attention to in this chart is the crossover of the DI+ and the DI- tool, indicating a shift in dominance from buyers to sellers and vice versa. In other words, the reversal of a trend.
Please note that the Super DMI tool lags behind slightly compared to the Momentum tool, but it is best to use both in conjunction with each other. Although the Momentum tool is more sensitive, the DMI tool is a better indicator of the “strength of the underlying move”. If you have to pick just one tool (Momentum or Super DMI), it should be the momentum tool because it is hypersensitive to the underlying market, but the ADX tool should always be used to confirm the strength of the underlying force.
Actionable insight
Use the ADX line as a measure of strength of the underlying, dominant force. Use the crossover of the DI+ and the DI- lines as a trend reversal indicator.
Chart 4 - 15-minute Momentum Analysis
Same as chart 2, but based on the 15-minute time frame. The buy green arrows and the sell red arrows on the 15-minute momentum are extremely significant and must be interpreted in conjunction with the SPX Direction momentum and volume tools.
On trend days, the best entries are in the direction of the 30-minute trend, but with a quick pullback and then a sharp resumption of the 30-minute trend (on trend days)
If the trend is bullish, the indicator will provide a green arrow signalling the beginning of an upward trend. The greater the momentum of the underlying trend, the sharper the angle of the momentum line. If the momentum line is at an 80° angle, the trend is stronger compared to a 45° angle.
It is critical for users to look for the angle of the momentum line after a buy / sell arrow is triggered. During strong trend days, there will be short-lived pullbacks followed by sharp resumption of trends with a 60 to 70° angle in the 15-minute momentum.
Actionable insight
Expect a green arrow > a green upward line > short-lived pullback (fakeout) > sharp resumption of green upward line during bullish trend days.
Expect a red arrow > a red downward line > short-lived bounce (fakeout) > sharp resumption of red downward line during bearish trend days.
On choppy days, the 15-minute momentum line is your best friend. This 15-minute momentum trend is the first to signal a trend reversal before the 30-minute momentum. SPX Direction members will be able to distinguish between a trend reversal and trend continuation by simultaneously analyzing the ES Volume Analysis and the ES Momentum Analysis tool. The “real moves” consist of momentum acceleration and volume explosion as price approaches key levels.
Combining this information with the 15-minute super DMI analysis (below) allows users to identify the difference between a ‘fakeout’ prior to the resumption of the trend and a true reversal.
Chart 5 - 15-minute Super DMI Analysis
Same as chart 3, but based on the 15-minute time frame.
Actionable insight
As a fakeout takes place on the 15-minute chart, the super DMI tool will continue to show strength of the underlying force. This is a clear indication of institutional players shaking out retail traders.
The probability of a trend reversal is highest when the 15-minute momentum and the 15-minute super DMI are in alignment. Look for a change in direction of the 15-minute momentum along with a weakening of the ADX of the underlying force on the 15-minute momentum to increase your conviction of a trend reversal.