Chart Example - Identifying Absorption and Reversals with SPX Direction Parameters
Contact customer support at support@spxdirection.com
We’ll walk you through a realistic, step-by-step chart scenario so you can see how the SPX direction parameters reveal intent as opposed to candles. SPX Direction parameters help members look under the hood at the underlying mechanics of the market. This allows members to understand and profit from the behavior that repeats every day on the NASDAQ 100 (NQ futures) and S&P 500 (ES futures).
📈 Scenario: Intraday Squeeze / Flush → Absorption → Reversal
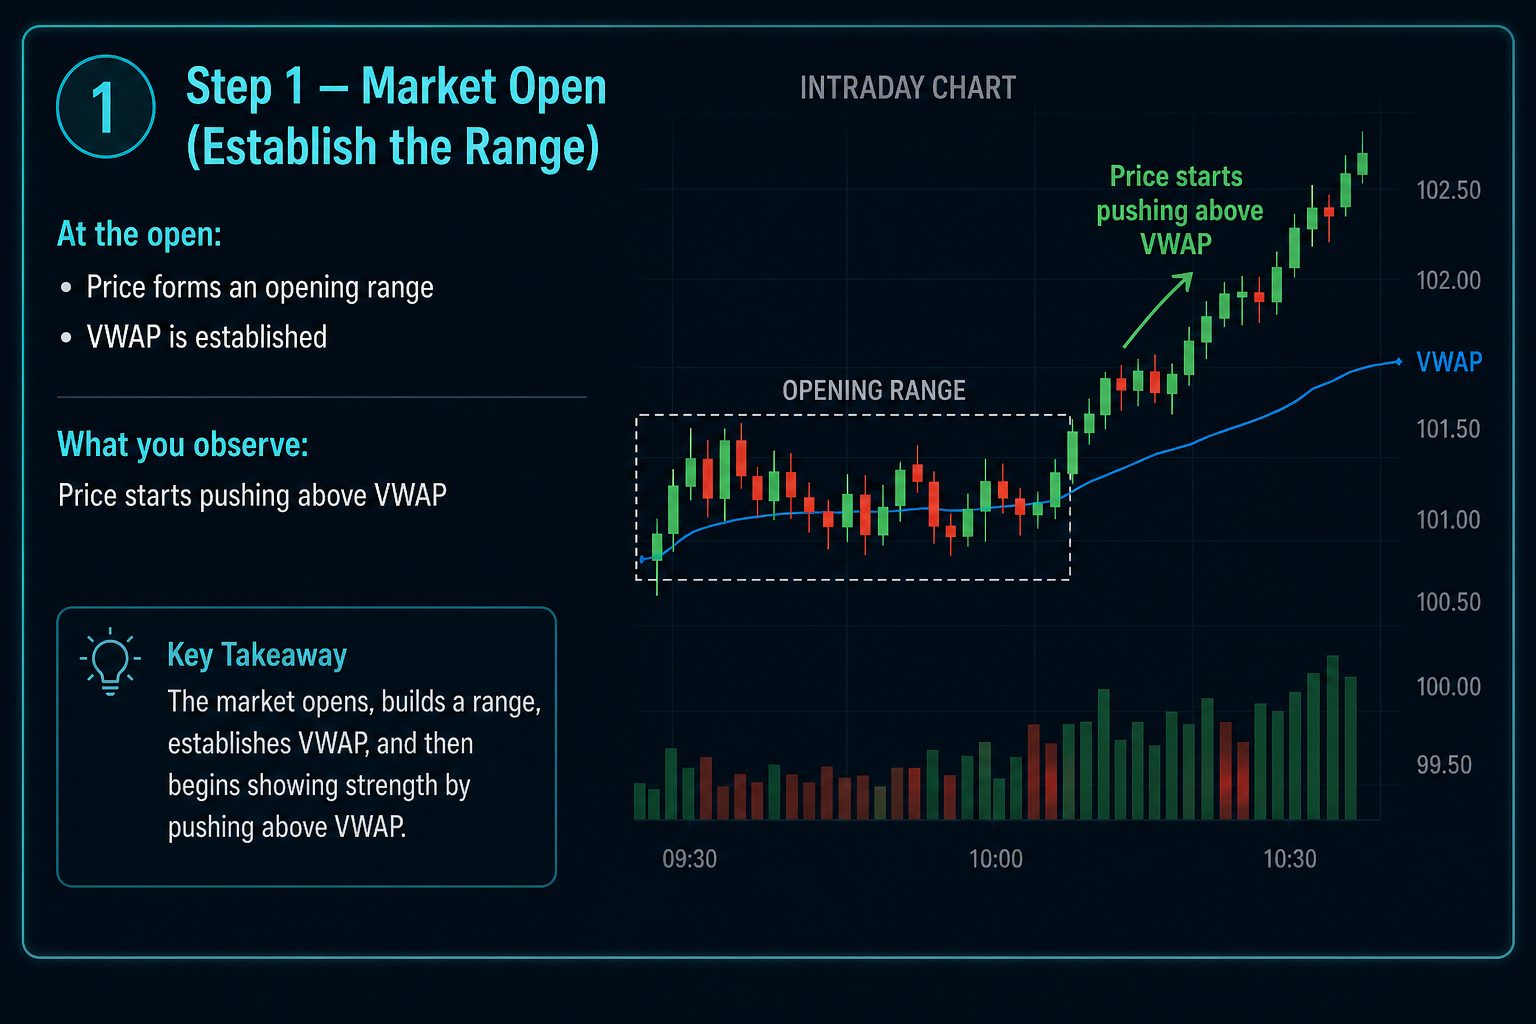
🕘 Step 1 — Market Open > Range Established
At the NYC open (9:30 am EST):
- Price forms an opening range
- VWAP is established
We recommend that SPX Direction members do not take any trade for the first 10 to 15 minutes after market open. Instead, just allow our algorithms to gather data and spend the first 15 minutes observing whether price starts pushing above (or below) VWAP.
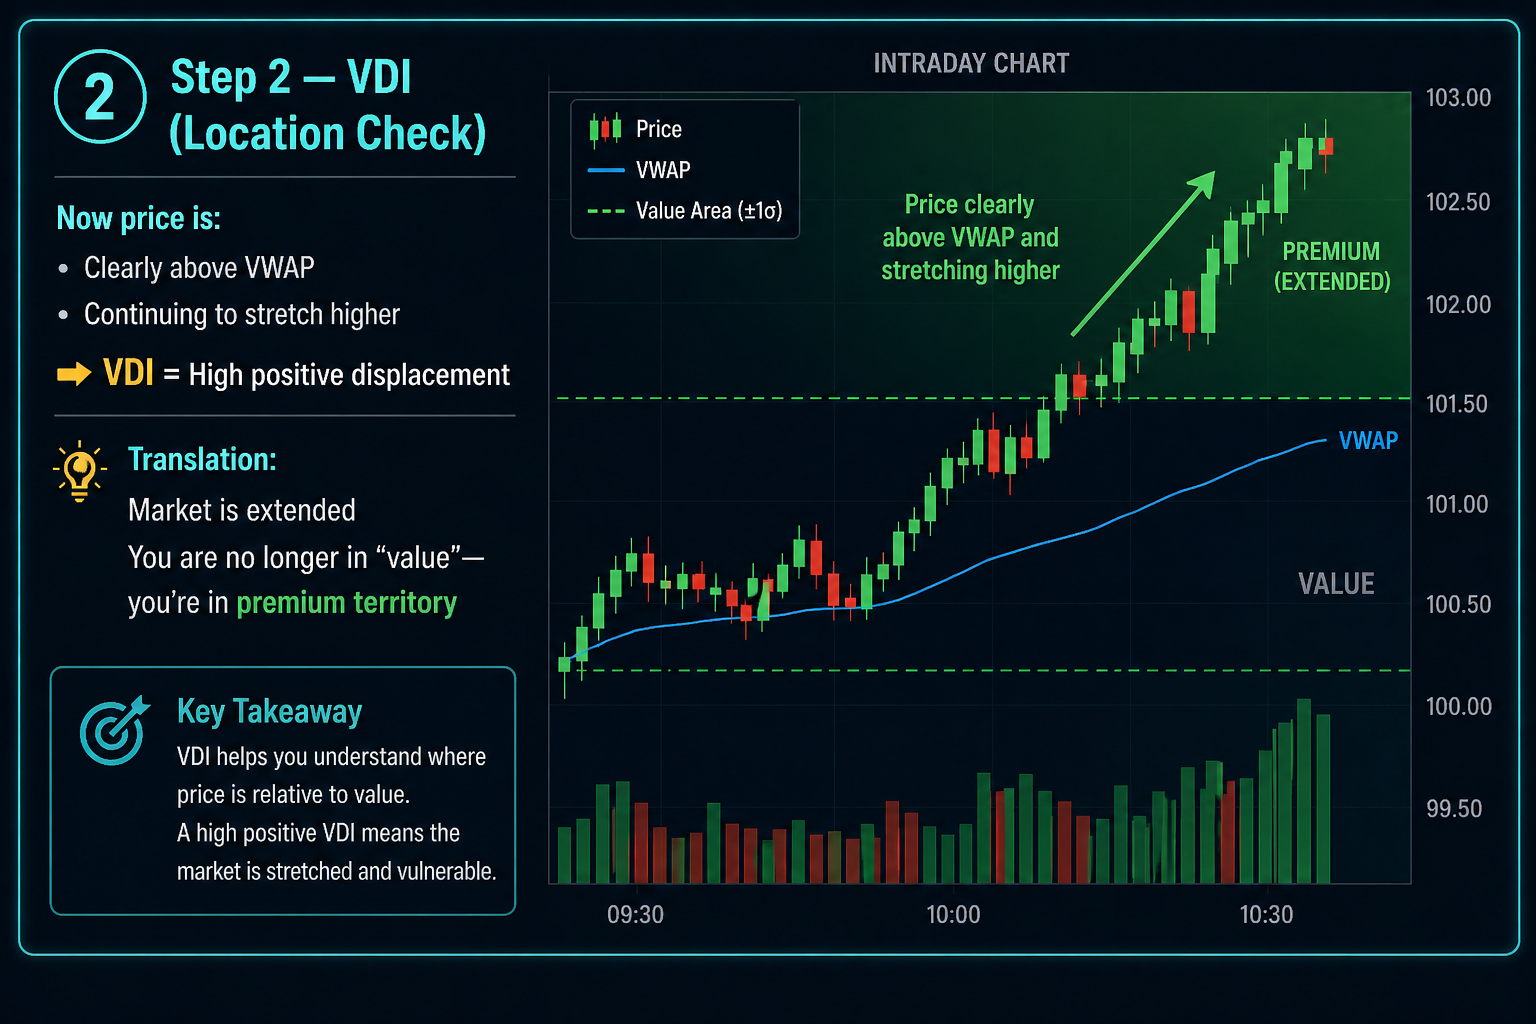
📍 Step 2 — VDI (Location Check)
In this example, price is:
- Clearly above VWAP
- Continuing to stretch higher
👉 VDI = High positive displacement
👉 Interpretation:
- Market is extended
- You are no longer in “value”, you’re in premium territory. This means the market is stretched and vulnerable.
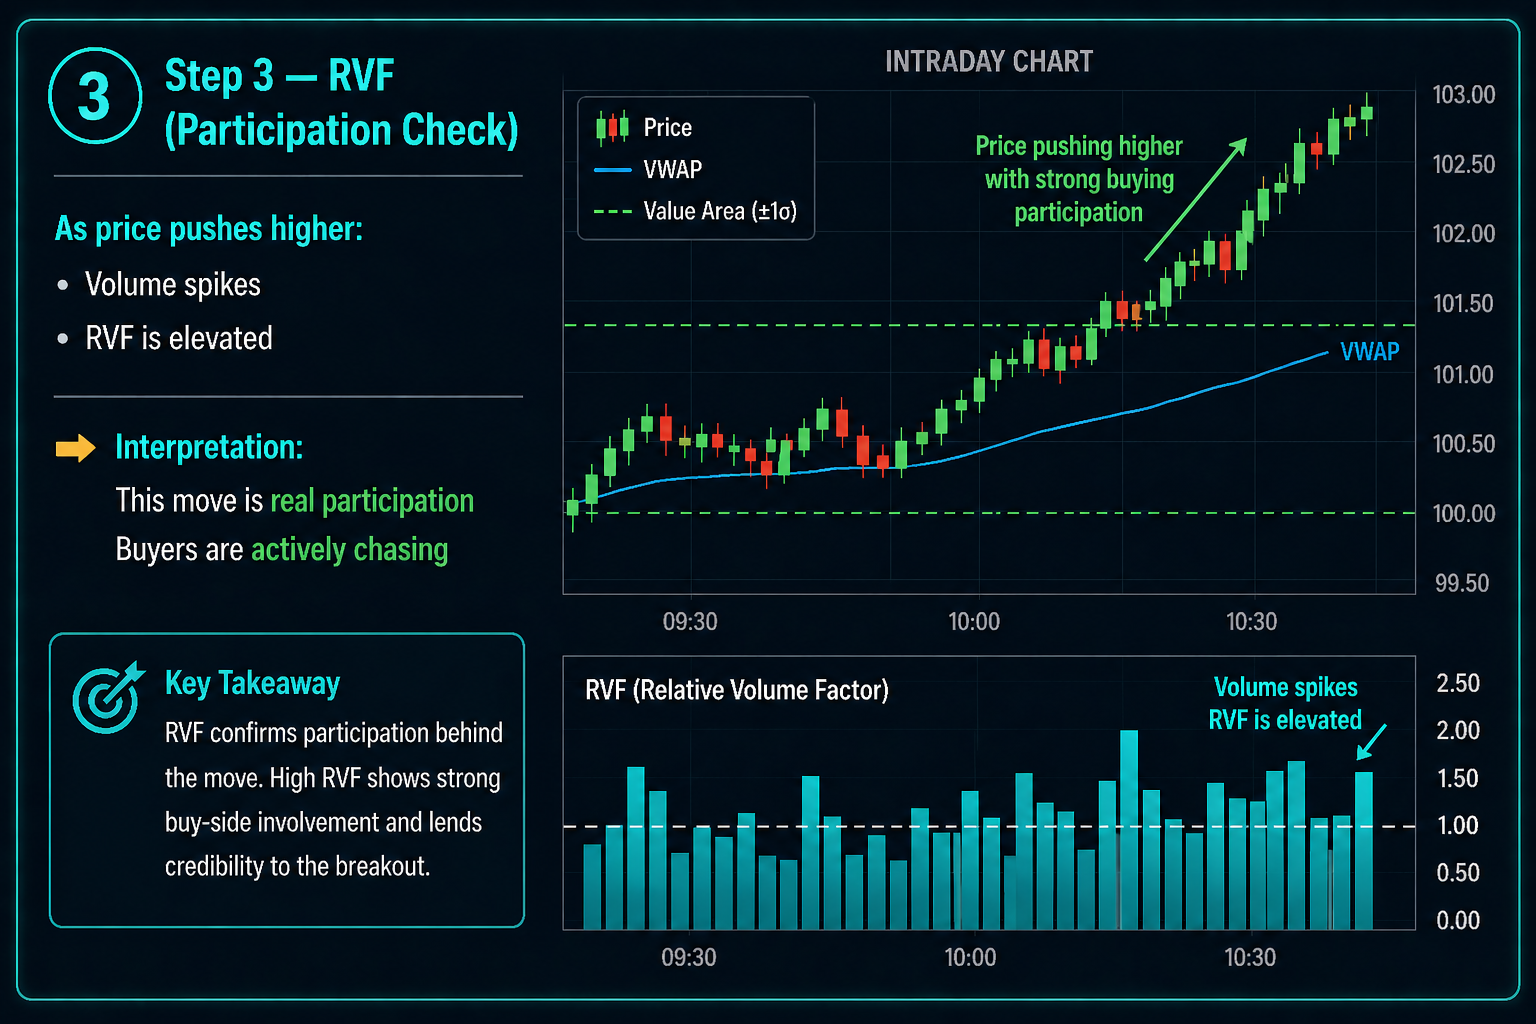
📊 Step 3 — RVF (Participation Check)
As price pushes higher:
- Volume spikes
- RVF is elevated
👉 Interpretation:
- This move is real participation
- Buyers are actively chasing
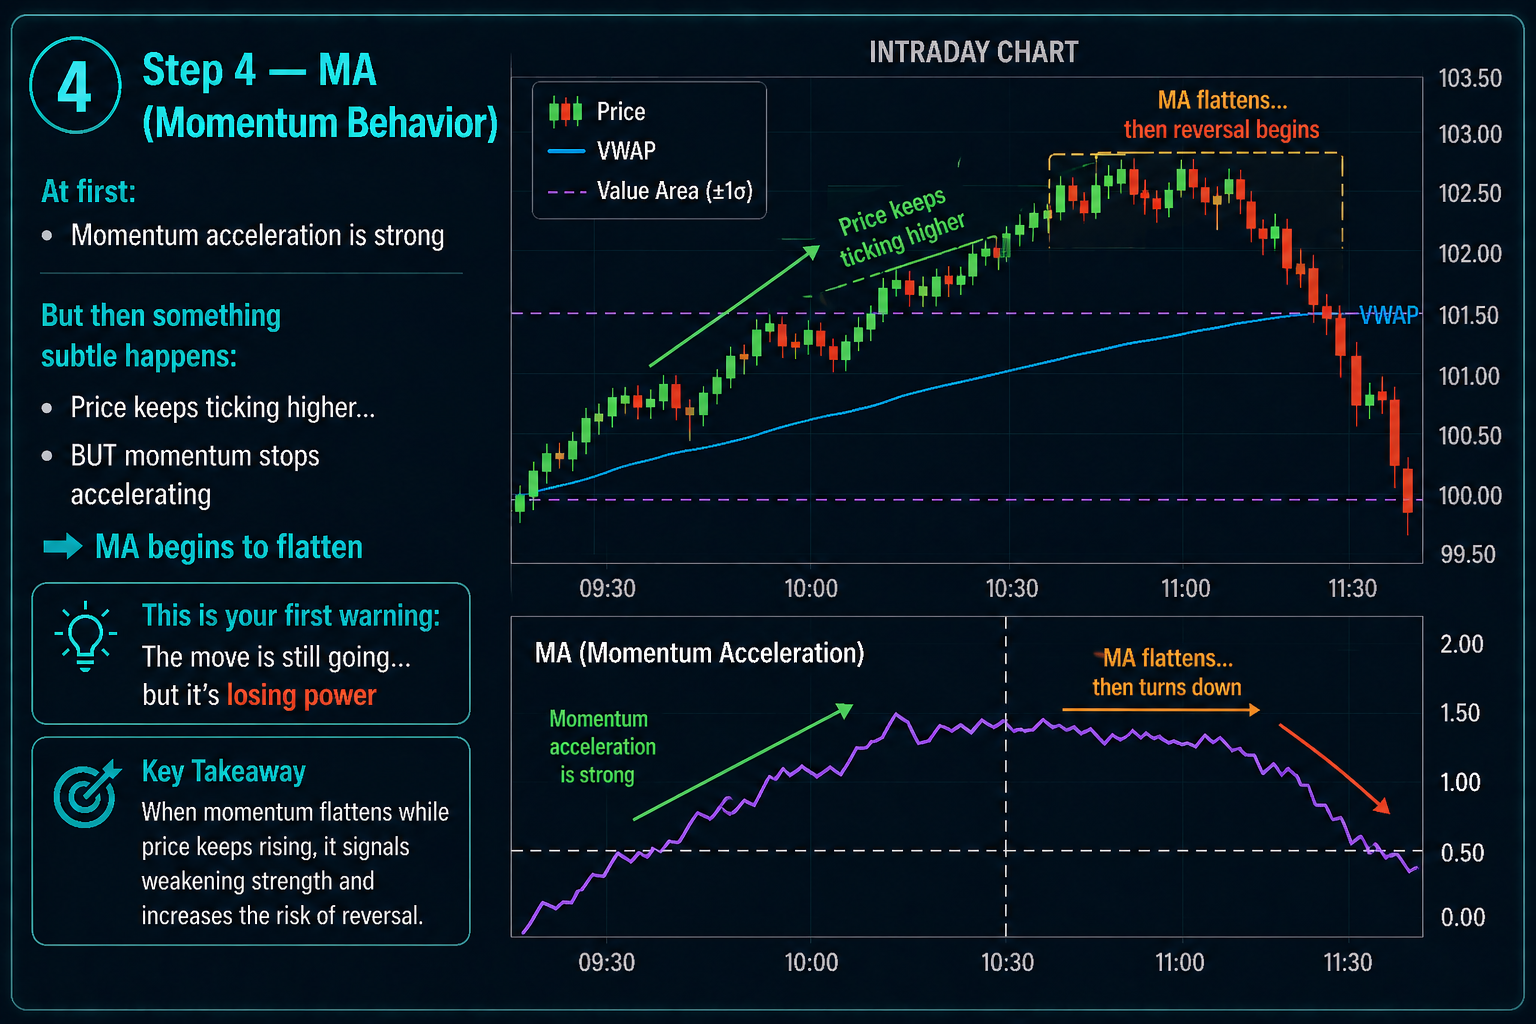
⚡ Step 4 — MA (Momentum Behavior)
At first:
- Momentum acceleration is strong
But then something subtle happens:
- Price keeps ticking higher…
- BUT momentum stops accelerating
👉 MA begins to flatten
💡 This is your first warning: The move is still going… but it’s losing power. It's like a truck that's about to reverse on the highway. It cannot reverse suddenly. It needs to slow down first before it turns around and heads the other way.
🚀 Step 5 — ORES (Expansion Check)
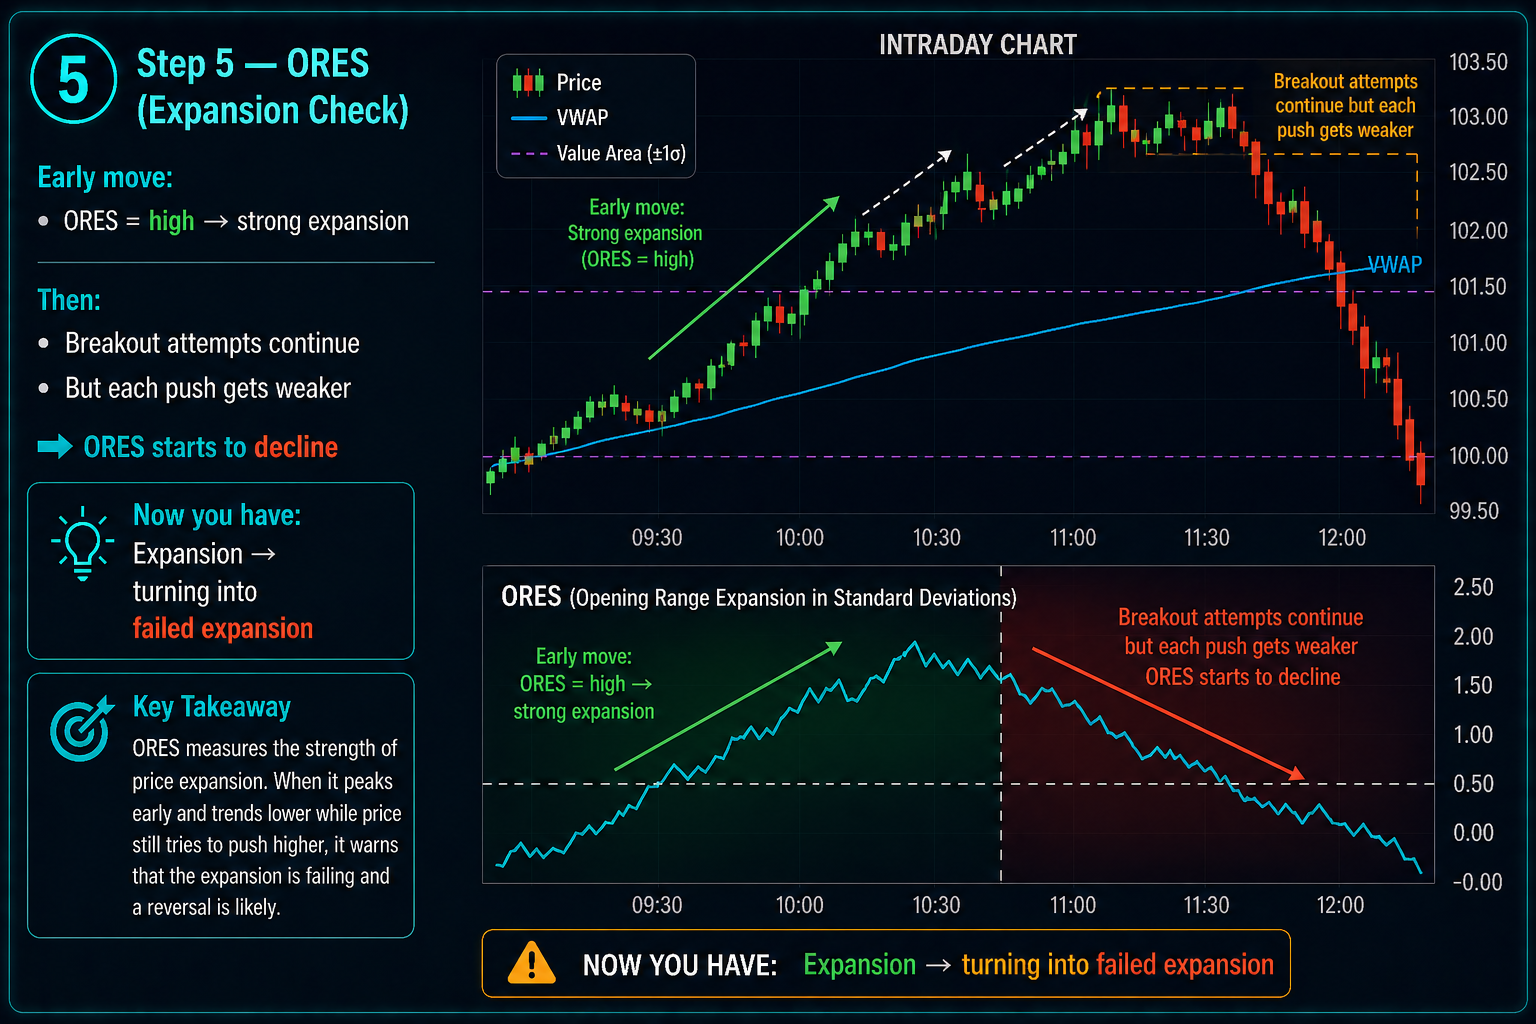
Early move:
- ORES = high → strong expansion
Then:
- Breakout attempts continue
- But each push gets weaker
👉 ORES starts to decline
Expansion → turning into failed expansion
🔥 Step 6 — Signs of Absorption
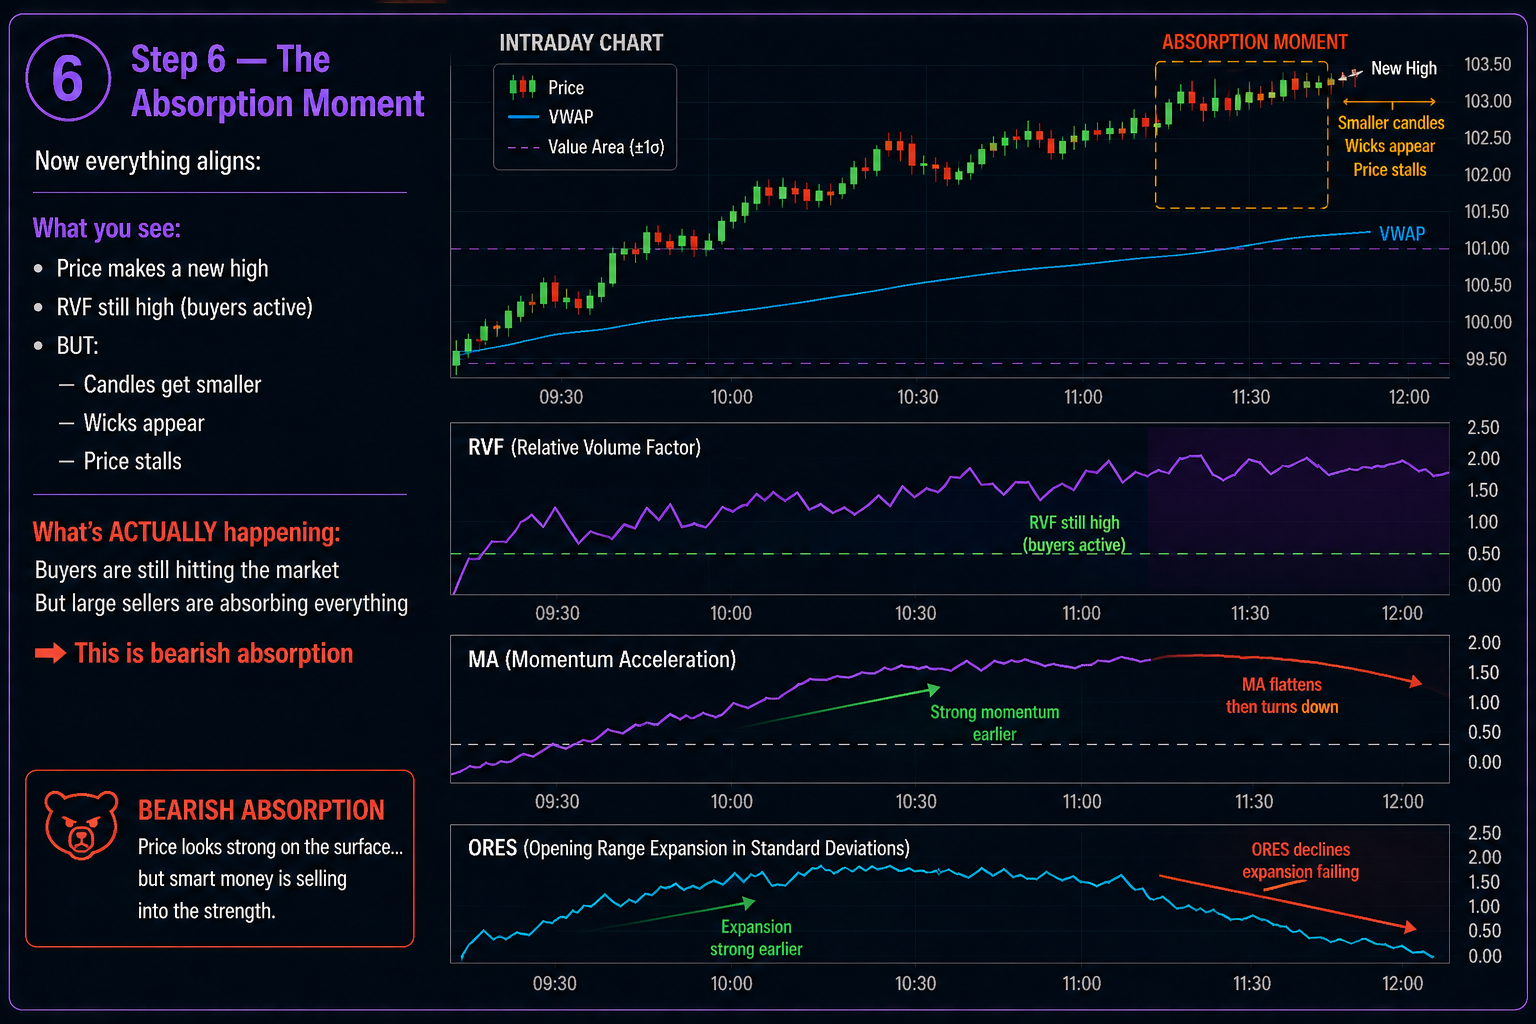
Now everything aligns:
What you see:
- Price makes a new high
- RVF still high (buyers active)
- BUT:
- Candles get smaller
- Wicks appear
- Price stalls
What’s ACTUALLY happening:
- Buyers are aggressively hitting the bid, trying to lift prices higher
- BUT large sellers are absorbing everything. Institutions are selling into strength.
👉 This is bearish absorption
🧠 Step 7 — Is it Consolidation (Prior to Trend Continuation) or an Actual Reversal?
This is where the SPX Direction algorithm shines and gives retail traders a real edge.
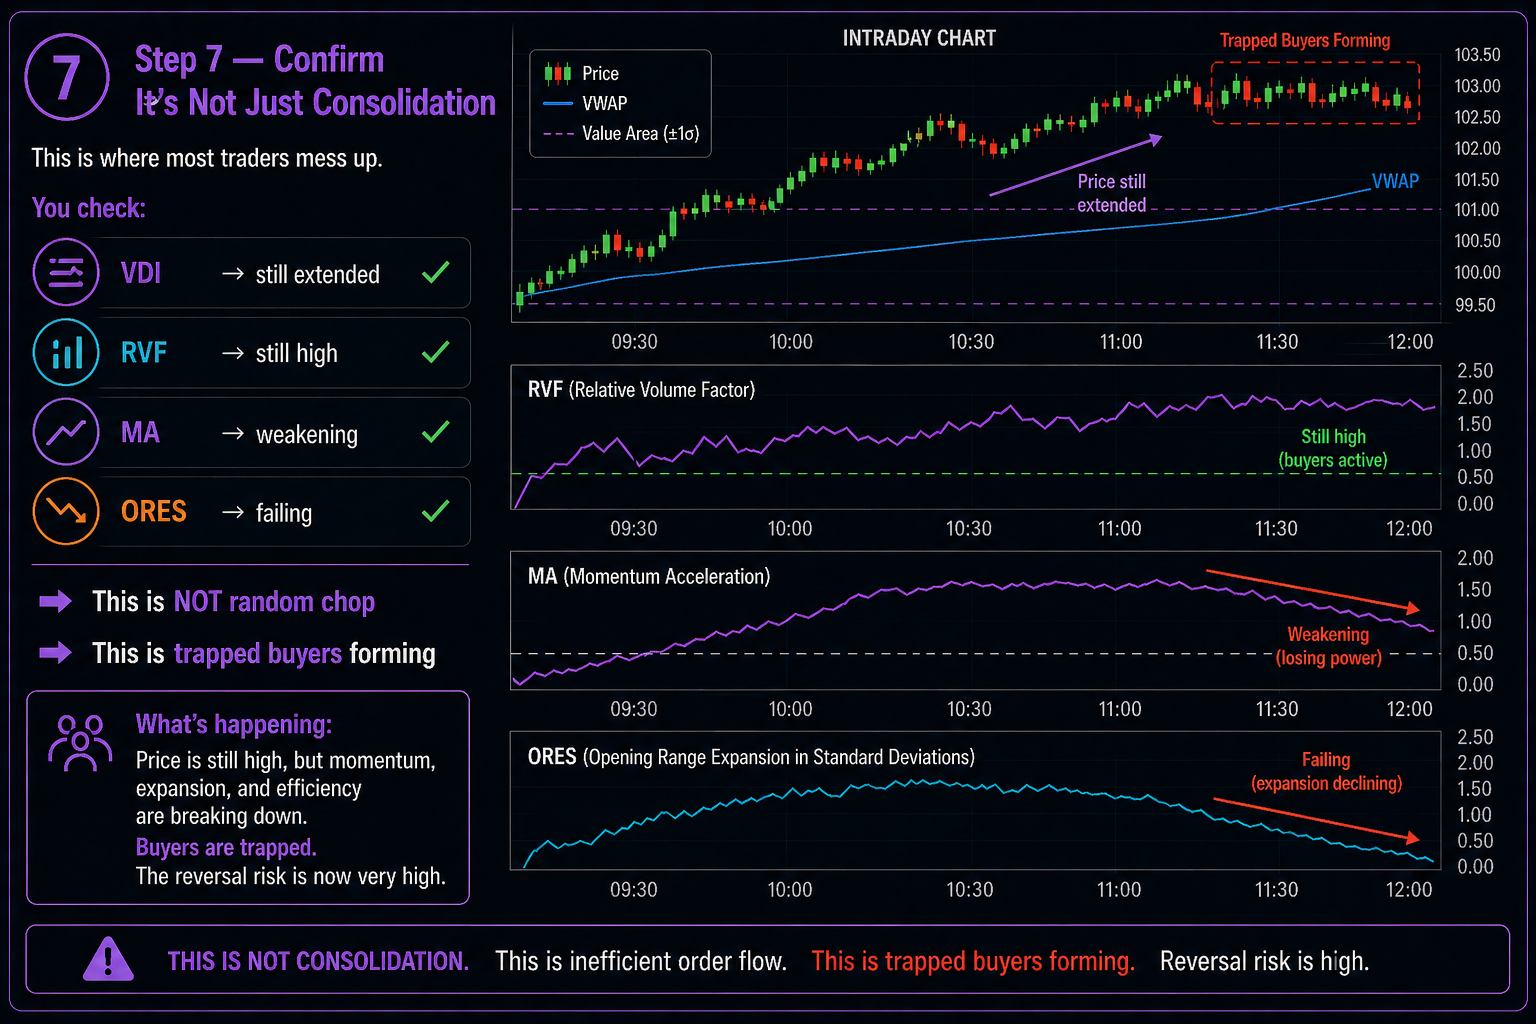
These are the signs to look for:
- VDI → still extended ✔
- RVF → still high ✔
- MA → weakening ✔
- ORES → failing ✔
👉 This is NOT random chop or consolidation
👉 This is Inefficient order flow and trapping of buyers. More and more buyers get lured in, but the price doesn't go up. The reversal risk is high.
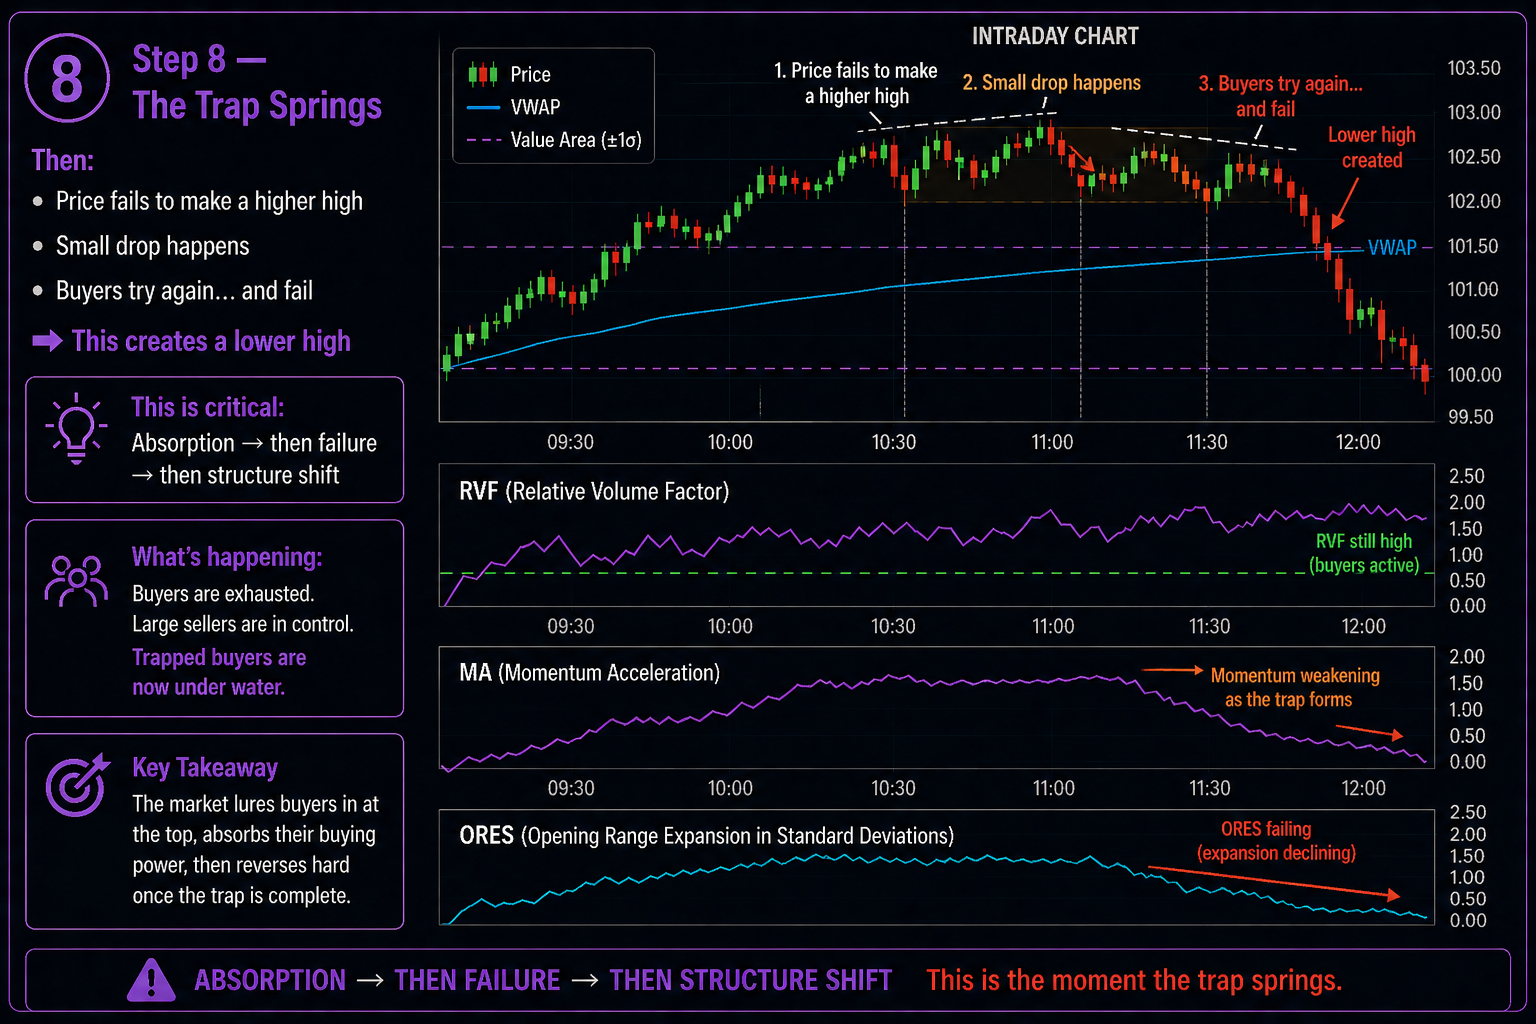
⚠️ Step 8 — One Side Gets Trapped as the Reversal Happens
- Price fails to make a higher high
- Small drop happens
- Buyers try again… and fail
👉 A lower high is created and momentum shifts. SPX Direction members will see the shift in momentum in real time with the SPX Direction Momentum Indicator.
💡 This sequence repeats time and again, daily
Absorption → failure → structure shift
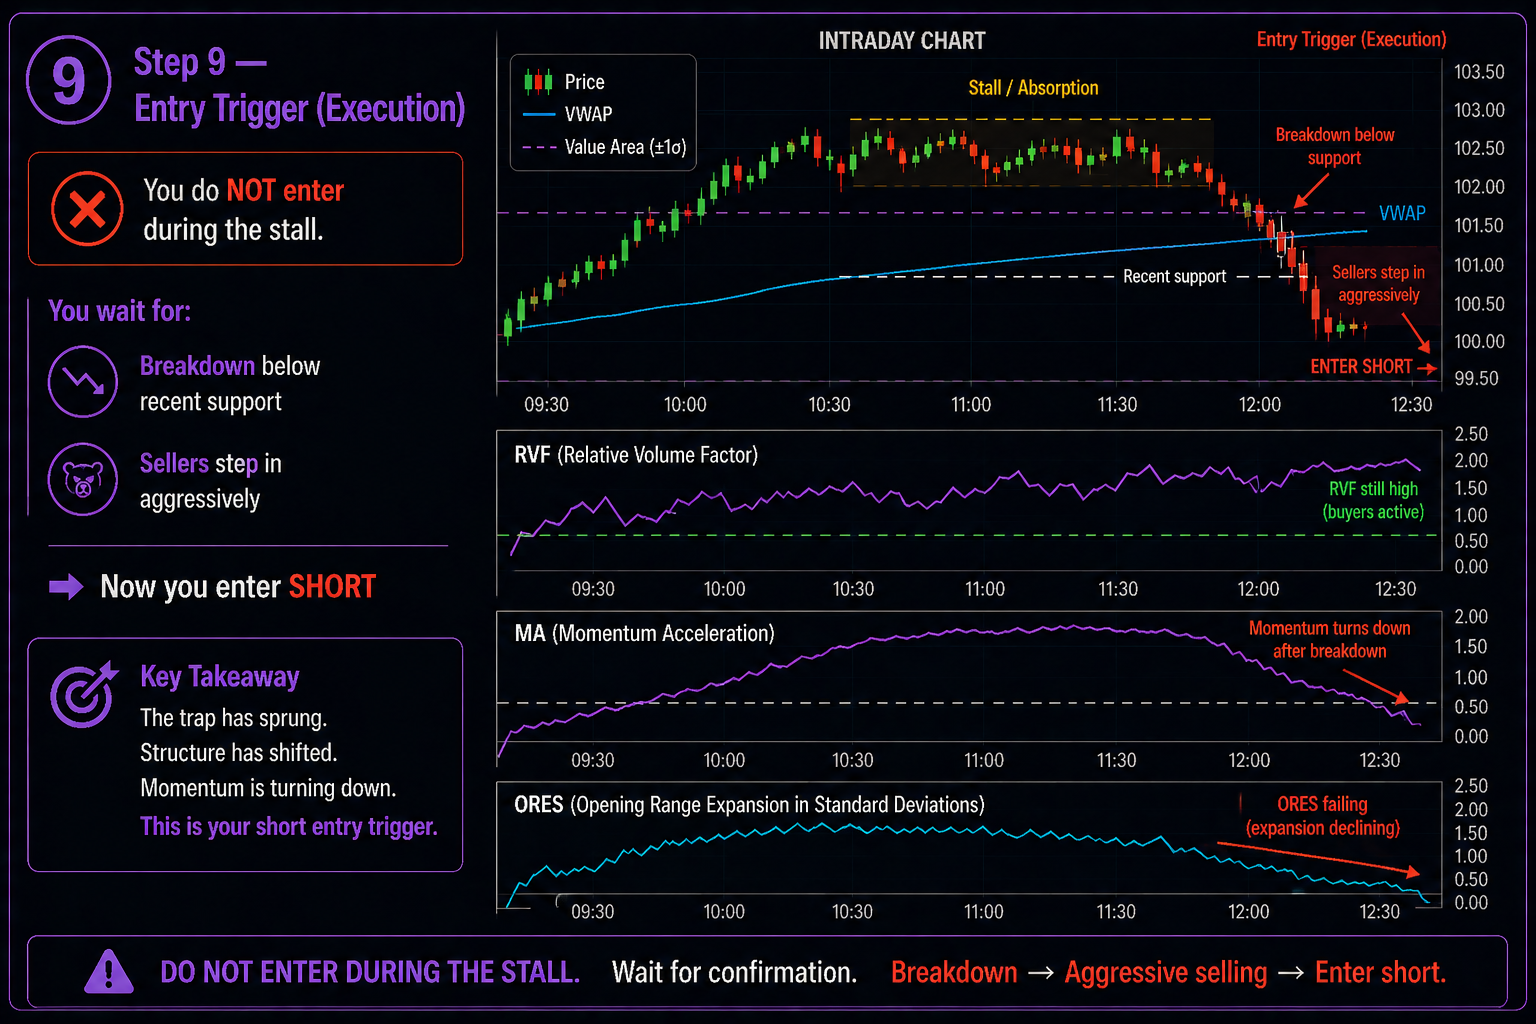
🎯 Step 9 — Entry Trigger (Execution)
You do NOT enter during the stall. SPX Direction members must wait for:
- Breakdown below recent support
- Sellers stepping in aggressively
👉 Now you enter SHORT
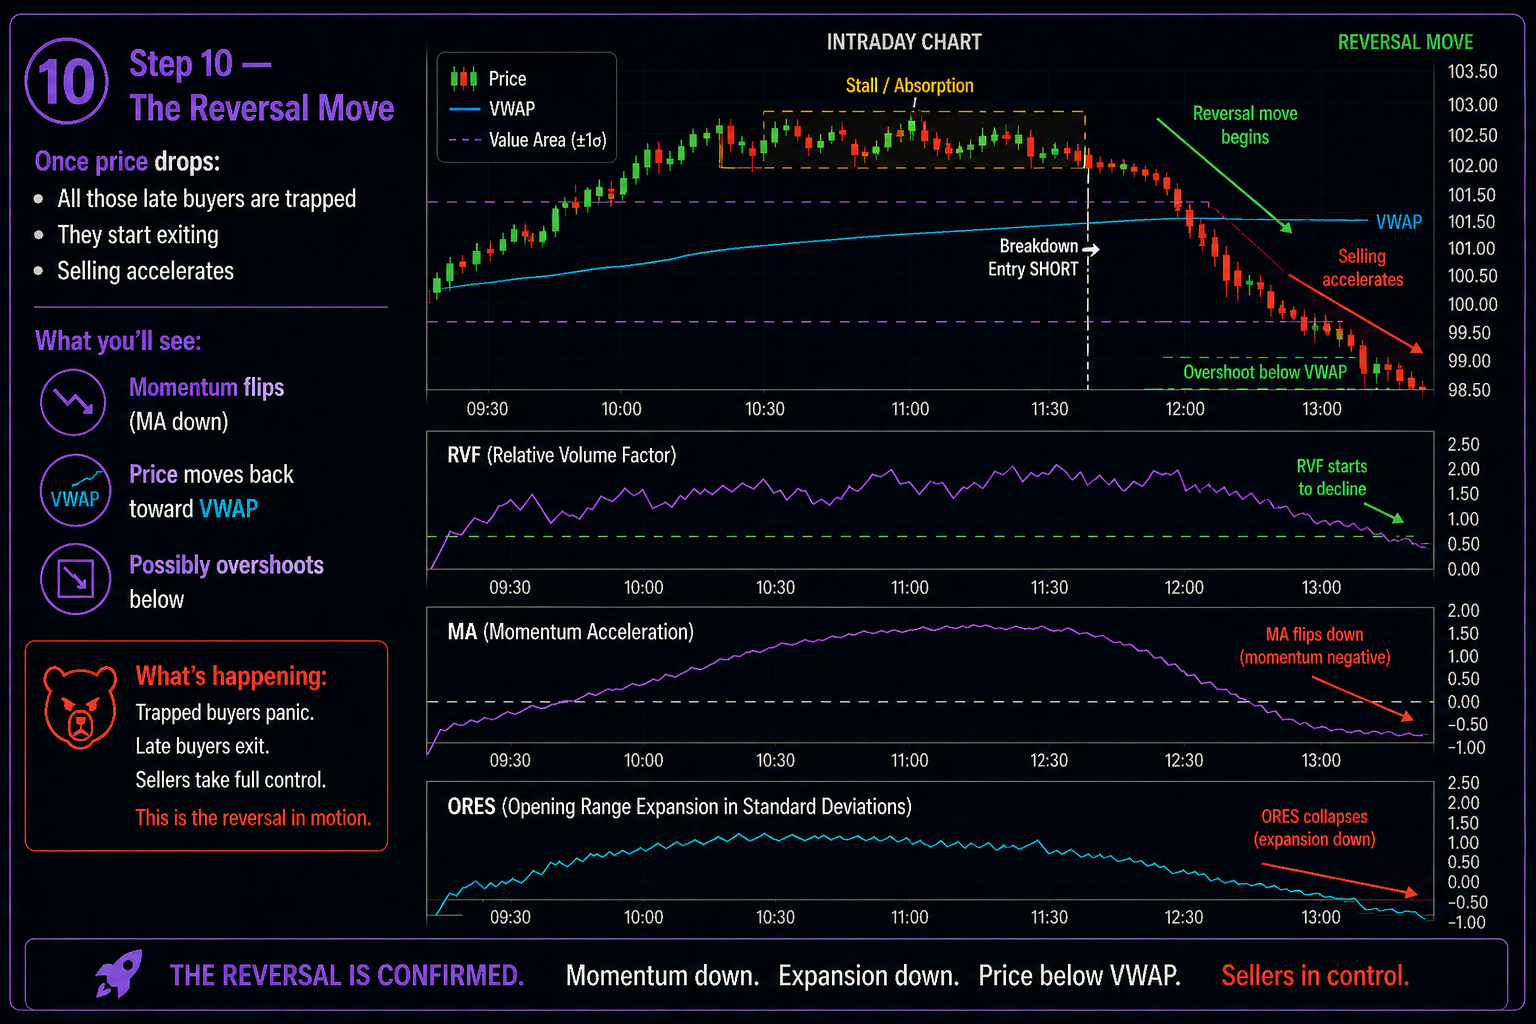
📉 Step 10 — Sharp Reversal
Once price drops:
- All late buyers are trapped
- They start exiting / their stop-loss orders get triggered
- Selling accelerates
What you’ll see:
- Momentum flips (MA down)
- Price moves back toward VWAP
- Possibly overshoots below
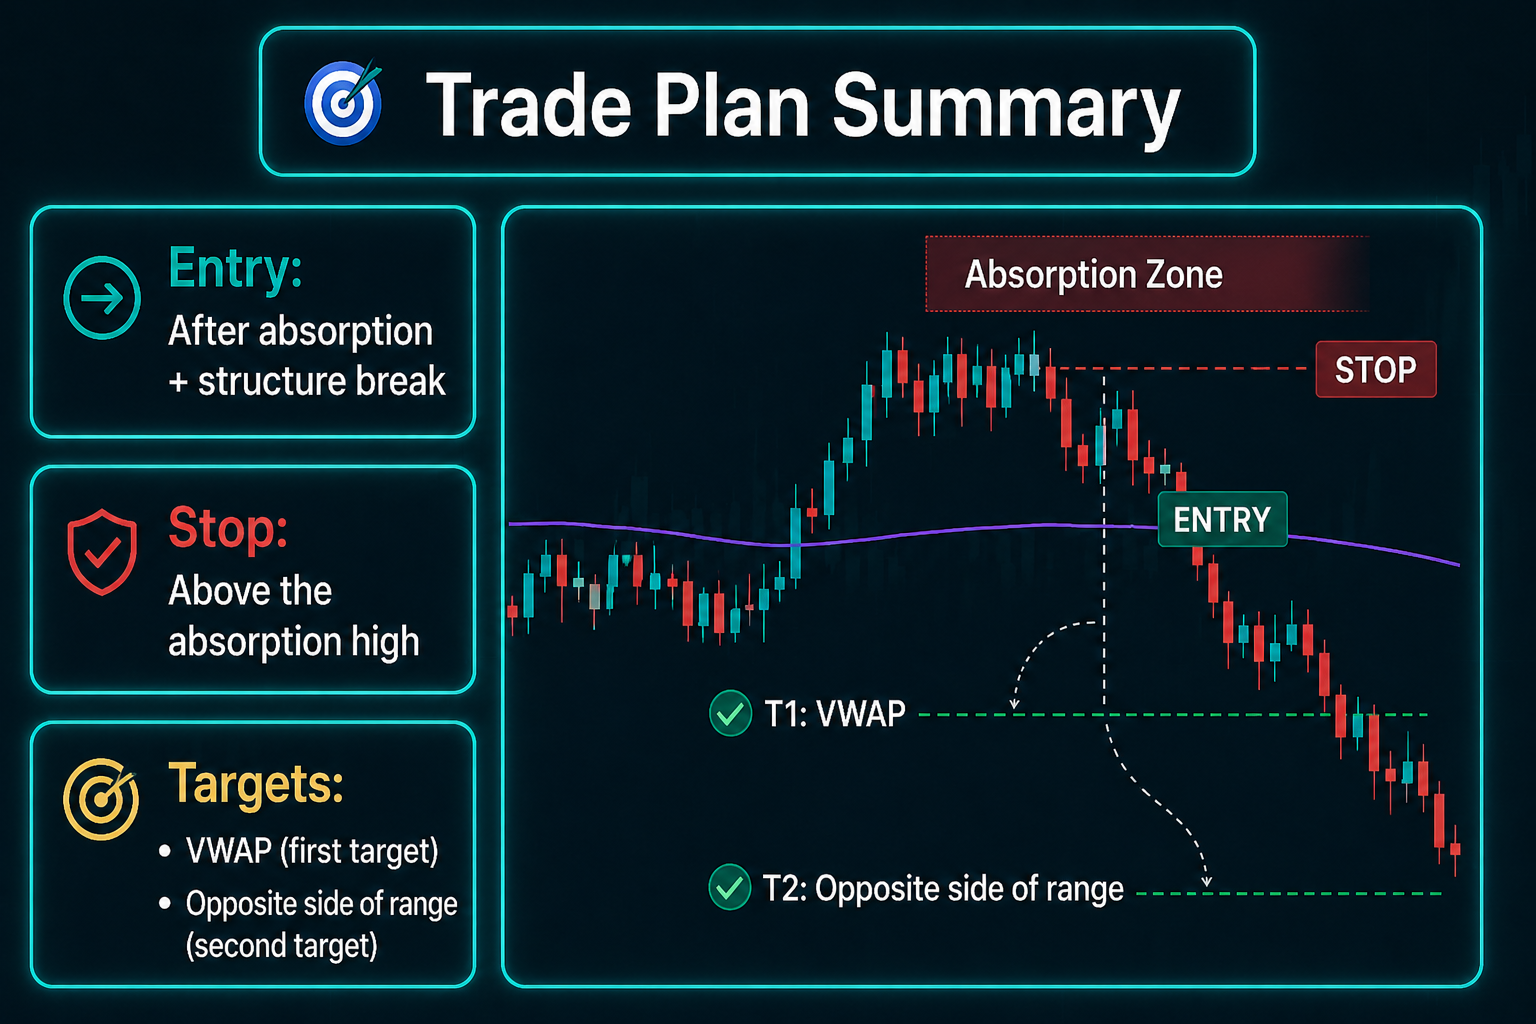
🎯 Trade Plan Summary
Entry:
- After absorption + structure break
Stop:
- Above the absorption high
Targets:
- VWAP is the primary target. Secondary targets on the opposite side of range include:
- Opening high (OH)
- Opening middle (OM)
- Opening low (OL)
- Initial opening high (IOH)
- Initial opening low (IOL)
- Daily low (DL)
- Weekly low (WL)
- All these intraday levels are dynamically displayed with the SPX Direction Intraday Levels Indicator.
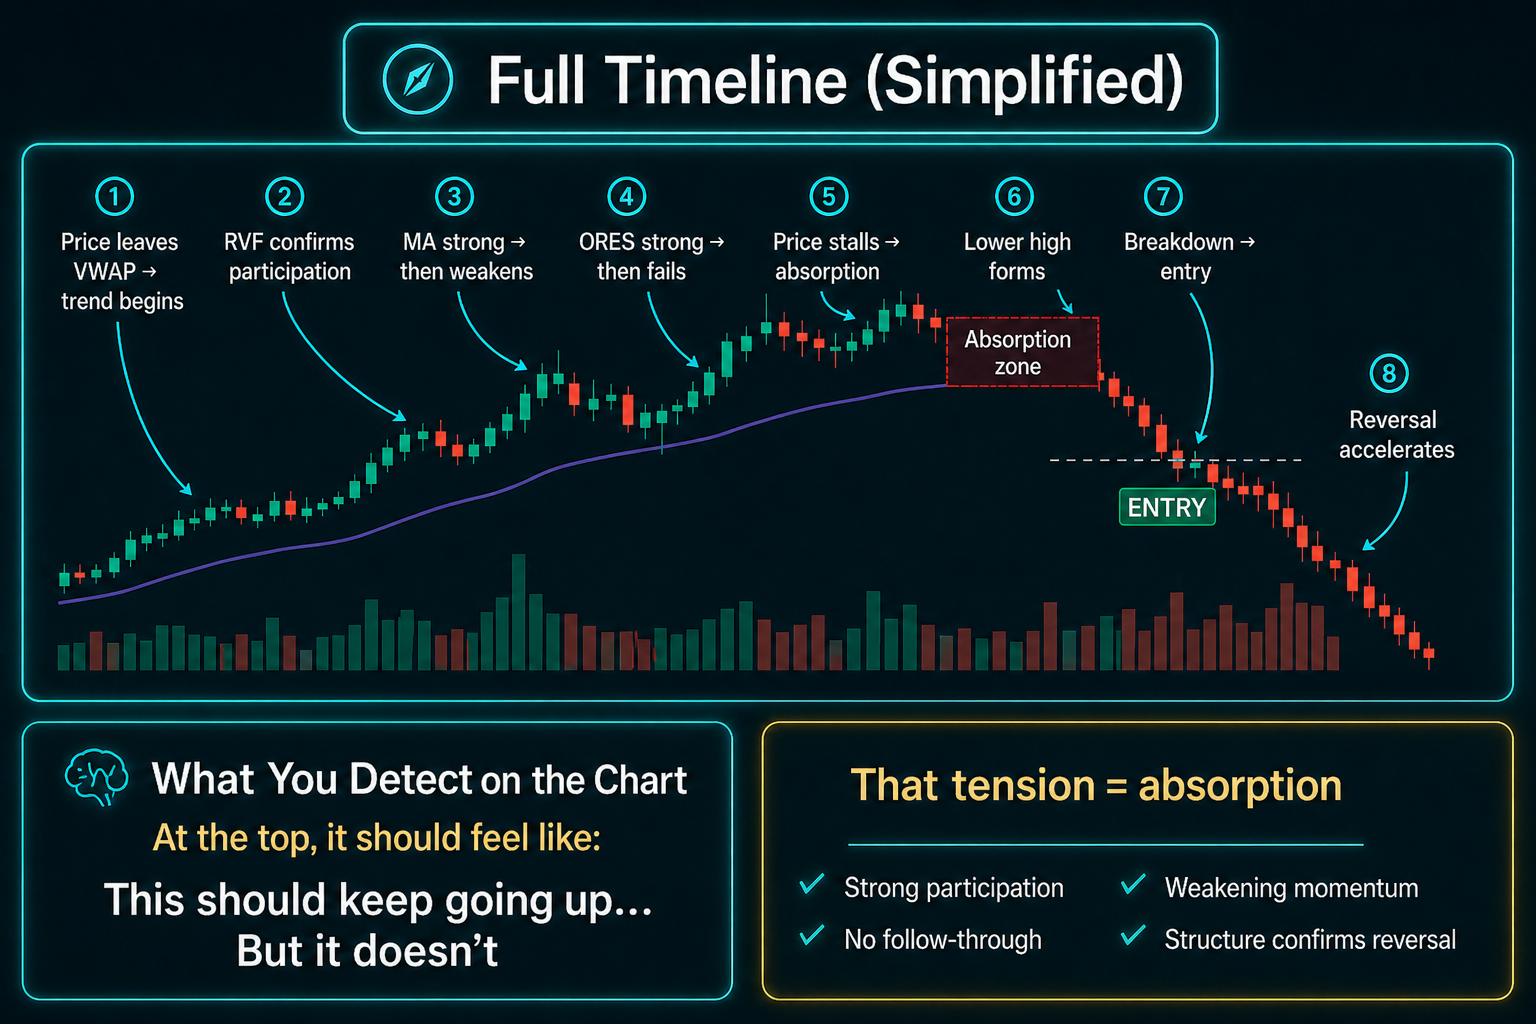
🧭 Full Timeline (Simplified)
- Price leaves VWAP → trend begins
- RVF confirms participation
- MA strong → then weakens
- ORES strong → then fails
- Price stalls → absorption
- Lower high forms
- Breakdown → entry
- Reversal accelerates
🧠 What You Detect on the Chart
As price rises, price action stalls.
- “This should keep going up…But it doesn’t"
That tension = absorption
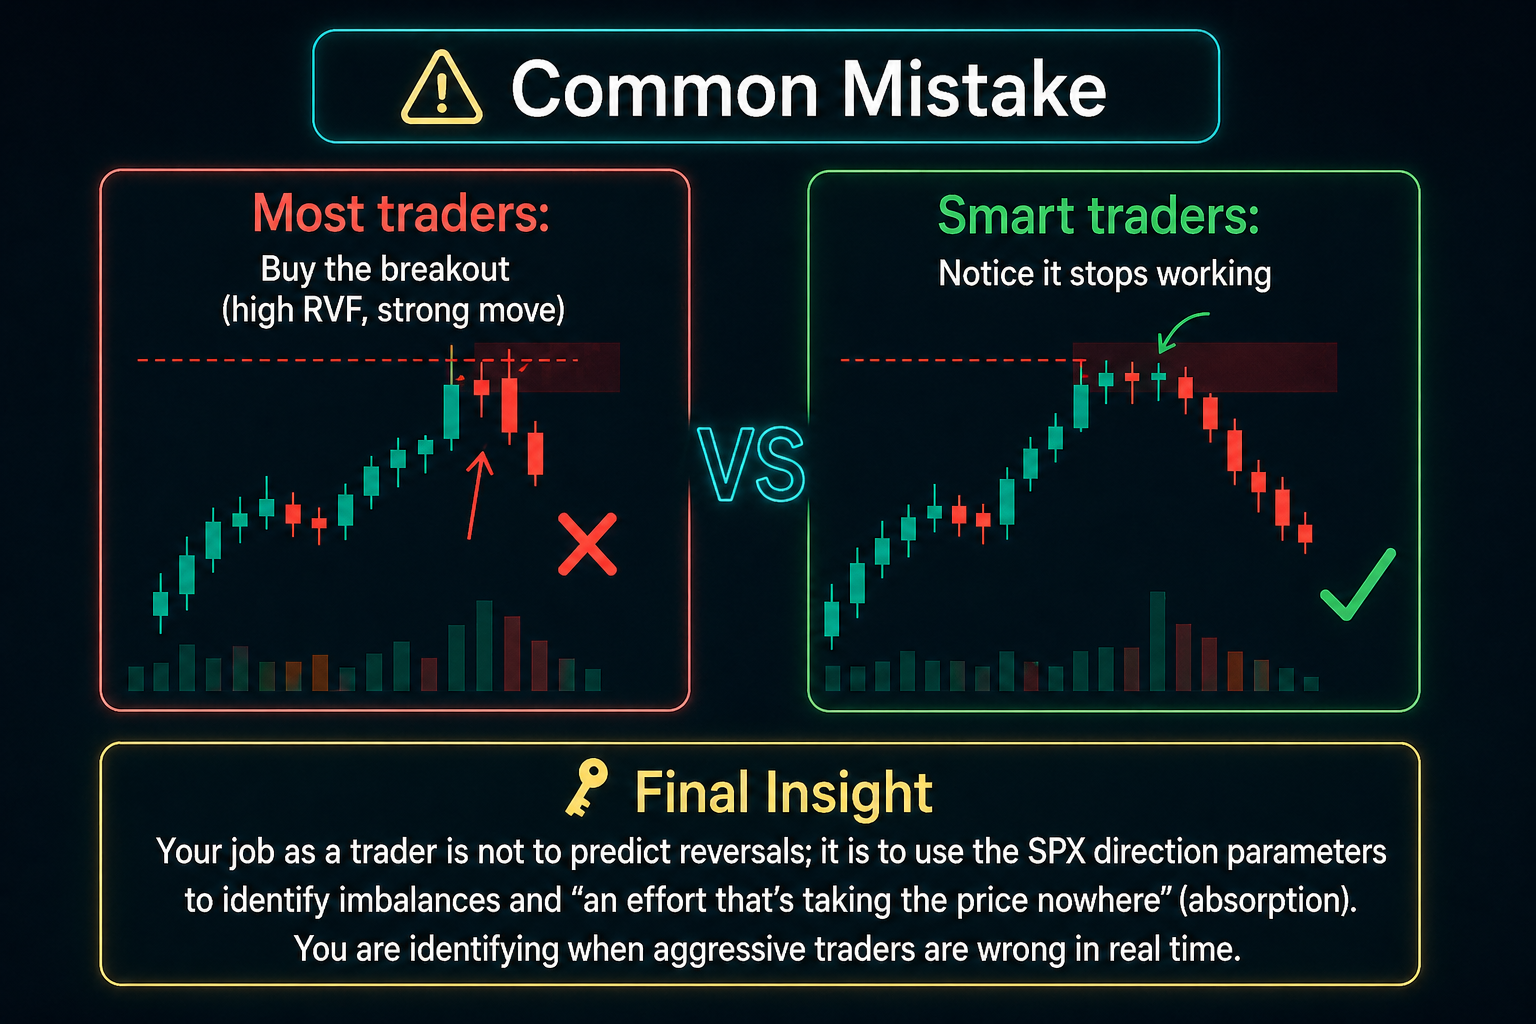
⚠️ Common Mistake
Most traders:
- Buy the breakout (high RVF, strong move)
SPX Direction traders notice something other traders don't, because they have access to our algorithm, which looks at the underlying mechanics and the plumbing of the market. In other words, they notice that things have stopped working
🔑 Final Insight
Your job as a trader is not to predict reversals; it is to use the SPX direction parameters to identify imbalances and “an effort that's taking the price nowhere” (absorption). SPX Direction helps members identify when aggressive traders are wrong in real time.
🔑 What This Looks Like on the Charts
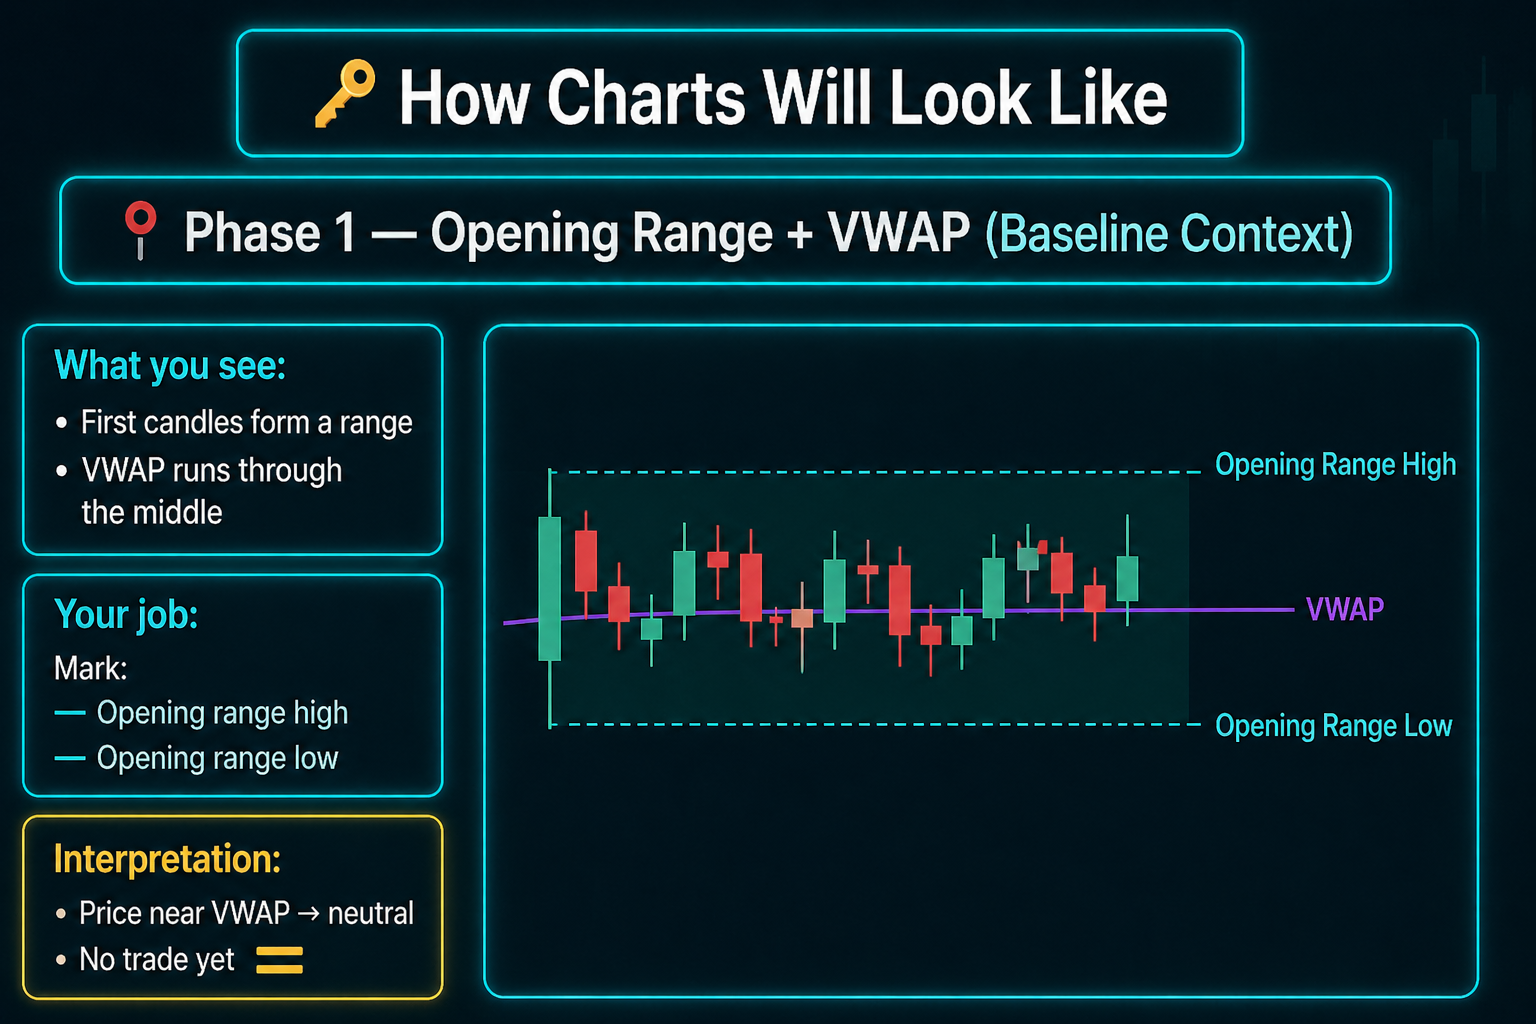
📍 Phase 1 — Opening Range + VWAP (Baseline Context)
Do not take a trade in the first 10 to 15 minutes. Simply observe as the initial candles form a range.
- The range in the first hour of the NYC open is called the opening range, and the range in the first 30 minutes of market open is called the initial opening range. This is calculated dynamically by the SPX direction intraday levels indicator. These levels are also displayed on the SPX Direction dashboard.
- Observe the relationship between price and VWAP
Interpretation:
- Price near VWAP → neutral
- No trade yet
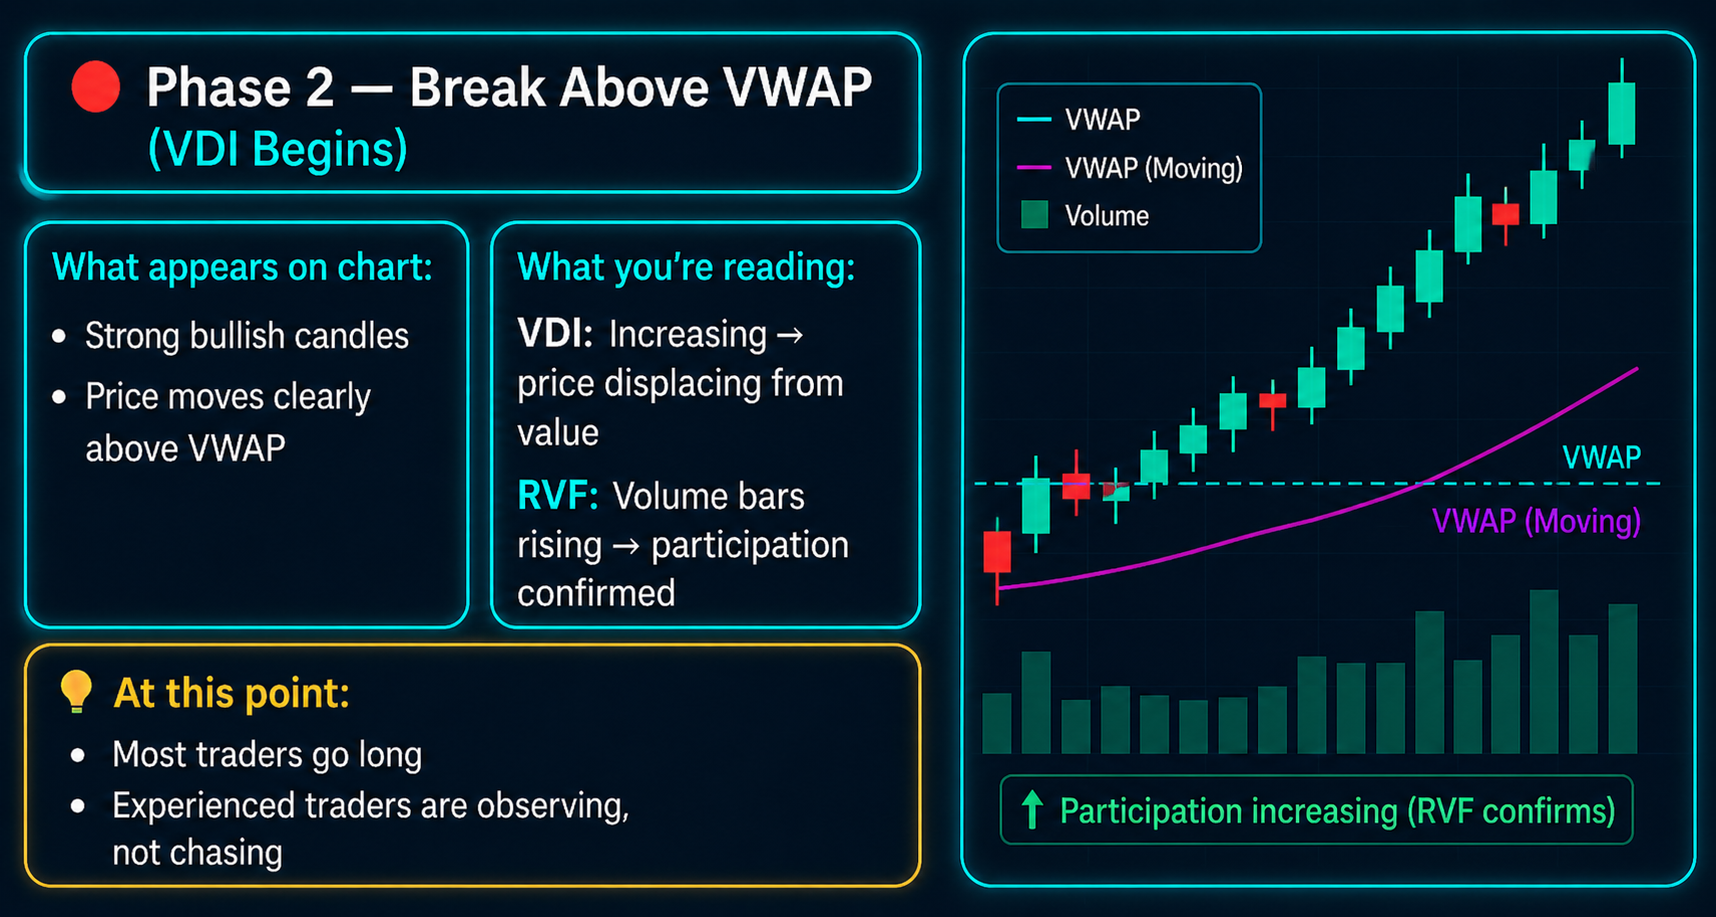
📈 Phase 2 — Break Above / Below VWAP (VDI Begins)
What appears on chart with a bullish displacement:
- Strong bullish candles
- Price moves clearly above VWAP
What to look for with the SPX direction parameters:
VDI:
- Increasing → price displacing from value (VWAP)
RVF:
- Volume rising → participation confirmed.
💡 At this point:
- Most traders go long
- Experienced traders are observing, not chasing
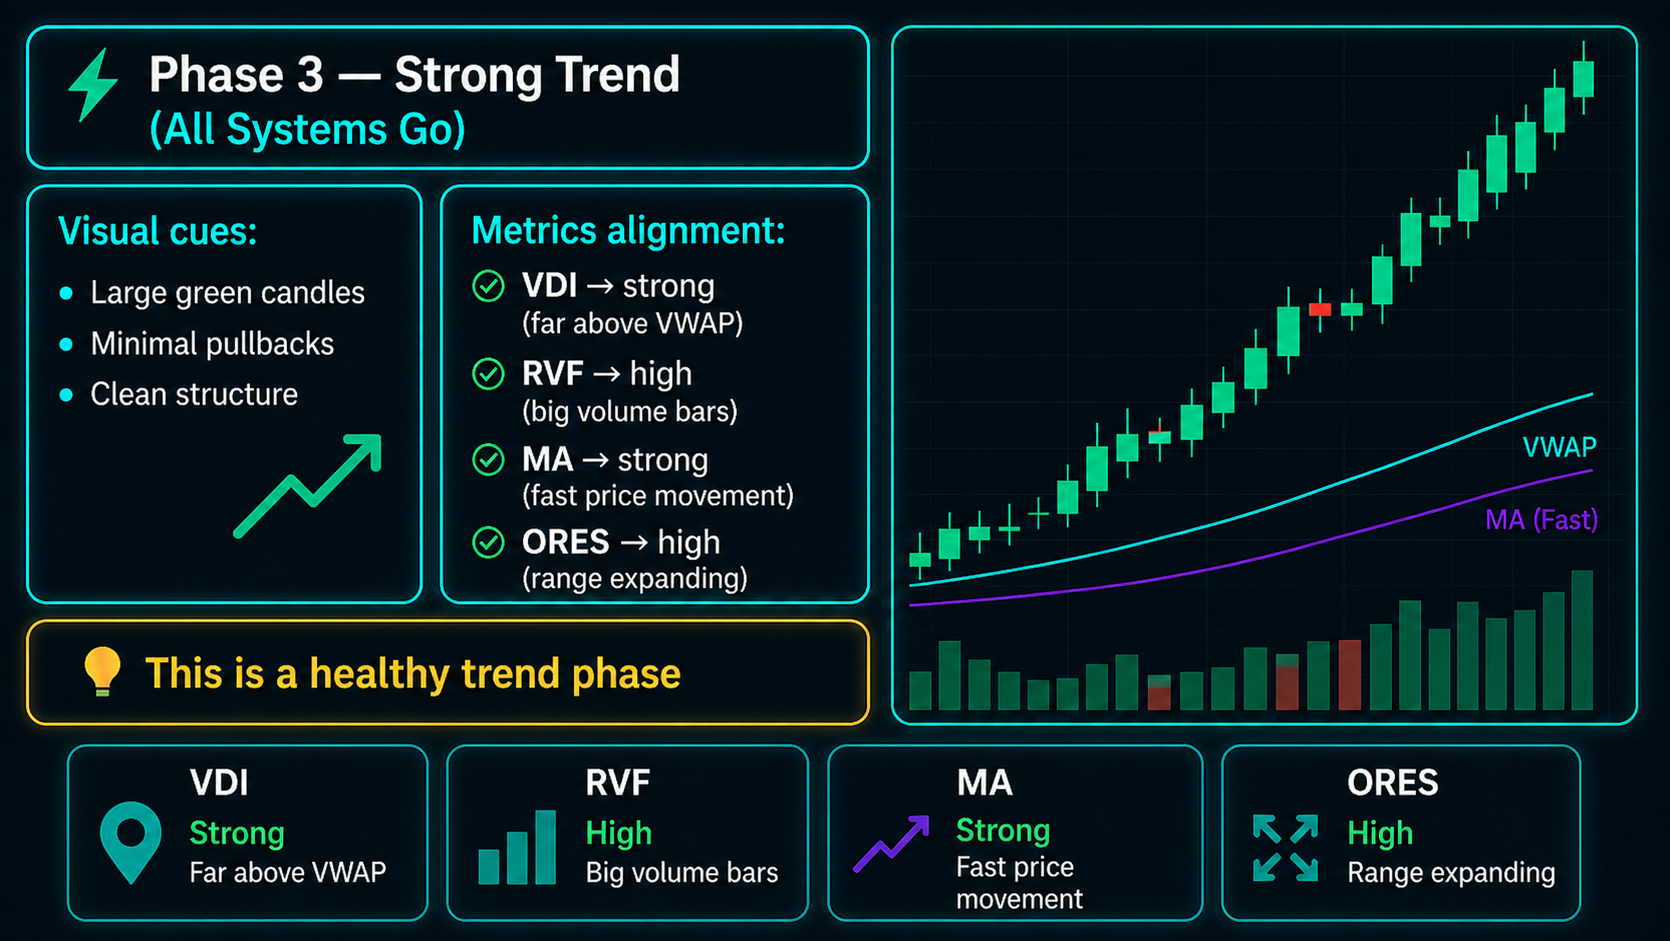
⚡ Phase 3 — Strong Trend (All Systems Go)
Visual cues:
- Large green candles
- Minimal pullbacks
- Clean structure
Metrics alignment:
- VDI → strong (far above VWAP)
- RVF → high (big volume bars)
- MA → strong (fast price movement)
- ORES → high (range expanding)
💡 This is a healthy trend phase
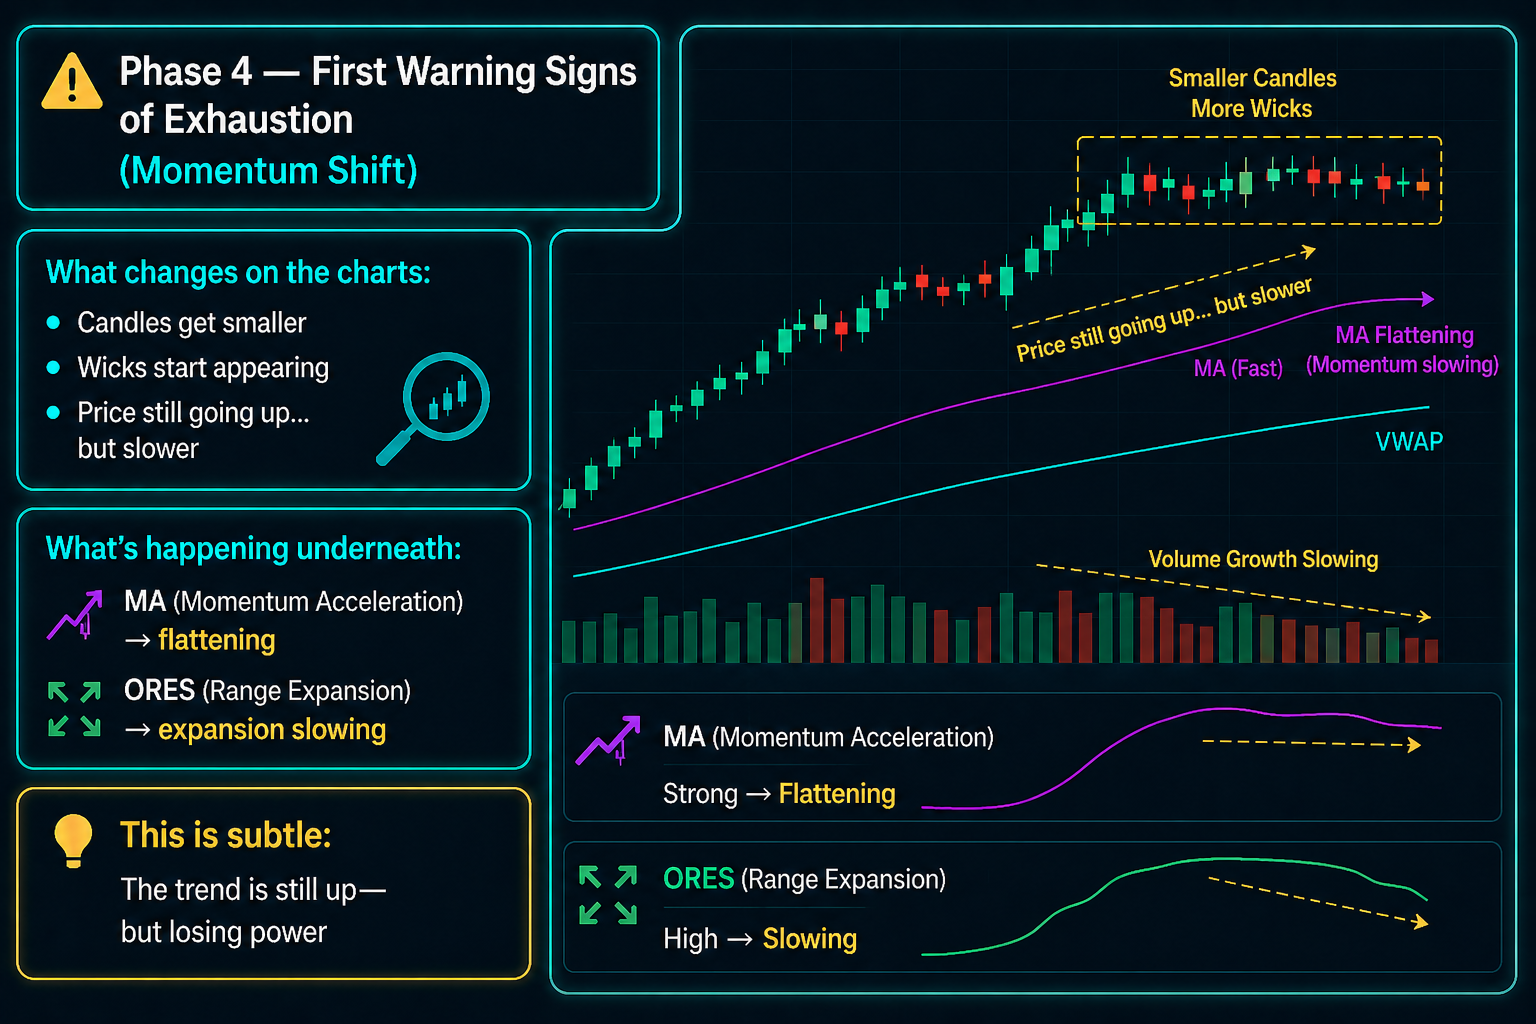
⚠️ Phase 4 — First Warning Signs of Exhaustion (Momentum Shift)
What changes on the charts:
- Candles get smaller
- Wicks start appearing
- Price still going up… but slower
What’s happening underneath:
- MA (Momentum Acceleration) → flattening
- ORES → expansion slowing
💡 This is subtle: The trend is still up—but losing power

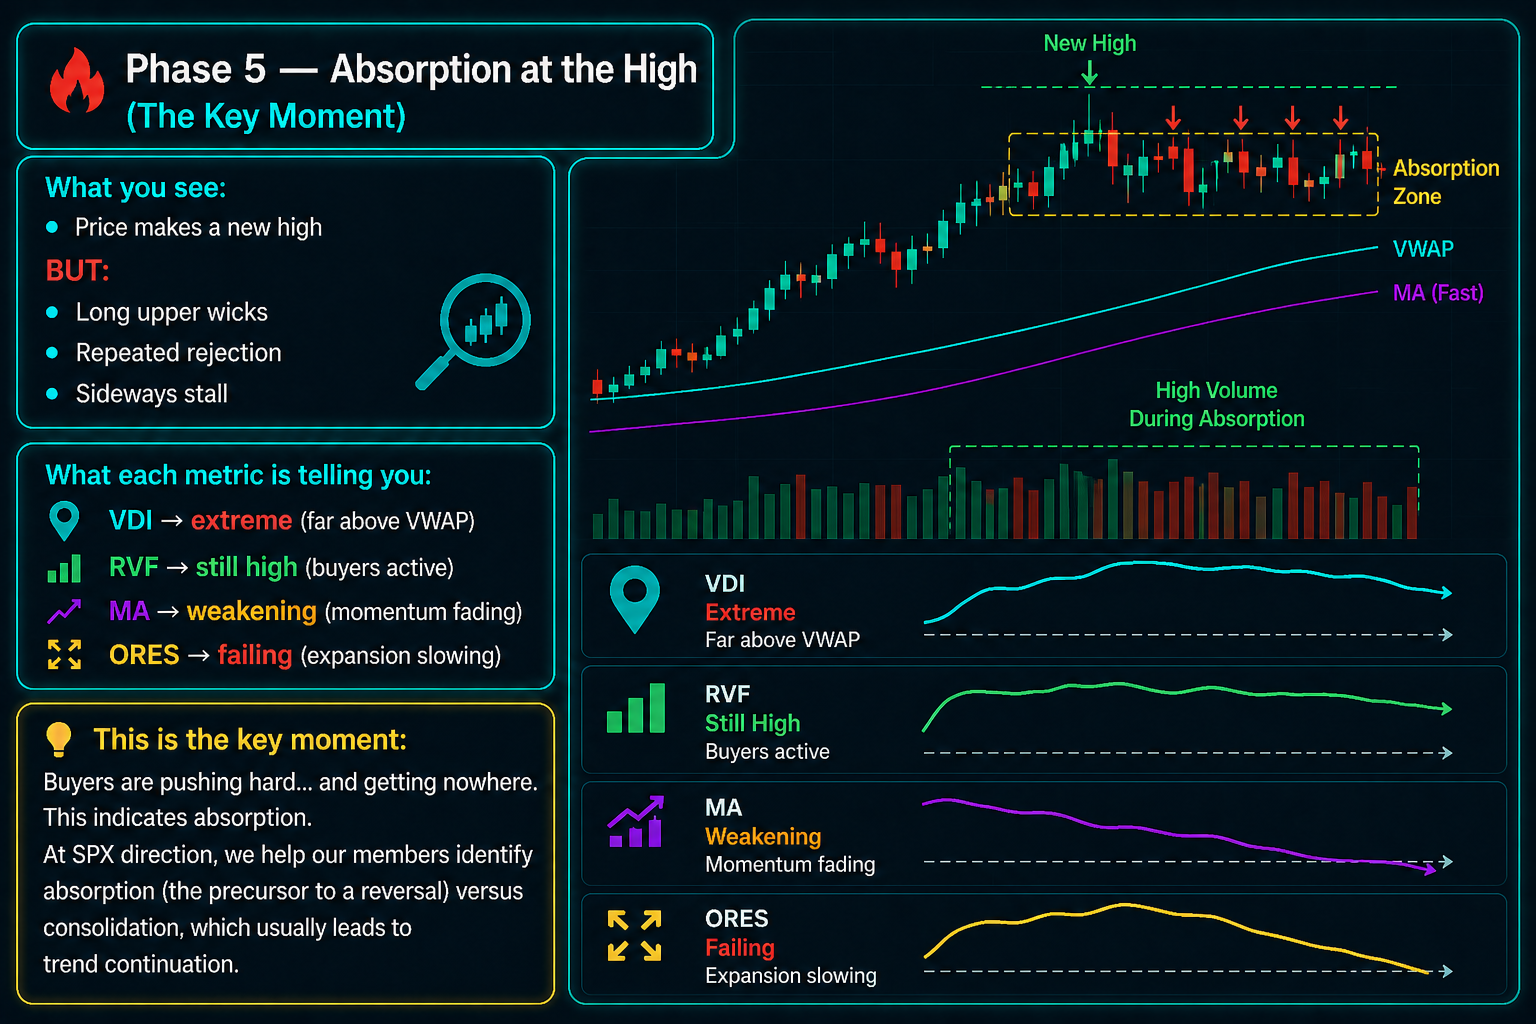
🔥 Phase 5 — Absorption at the High
What you see:
- Price makes a new high
- BUT:
- Long upper wicks
- Repeated rejection
- Sideways stall
What each metric is telling you:
- VDI → extreme (far above VWAP)
- RVF → still high (buyers active)
- MA → weakening
- ORES → failing
💡 This is the key moment: Buyers are pushing hard… and getting nowhere. This indicates absorption. At SPX direction, we help our members identify absorption (the precursor to a reversal) versus consolidation, which usually leads to trend continuation.

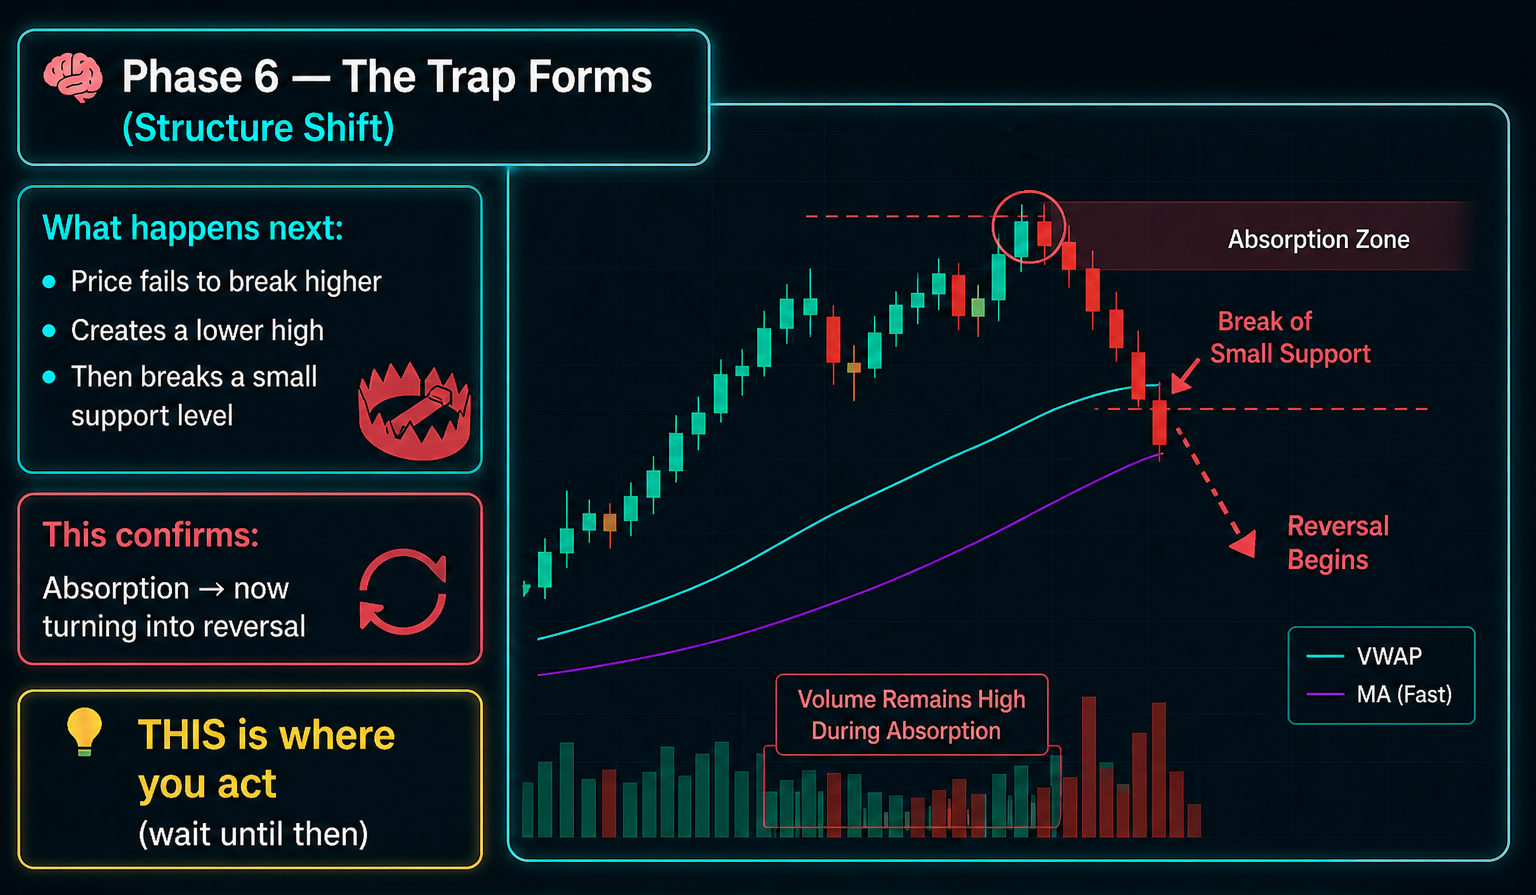
🧠 Phase 6 — The Trap Emerges (Structure Shift)
What happens next:
- Price fails to break higher
- Creates a lower high
- Reverses and plunges through the nearest support level
This confirms:
- Absorption → now turning into reversal. Wait for the SPX direction parameters to confirm the reversal.
💡 THIS is where you act (wait until then)
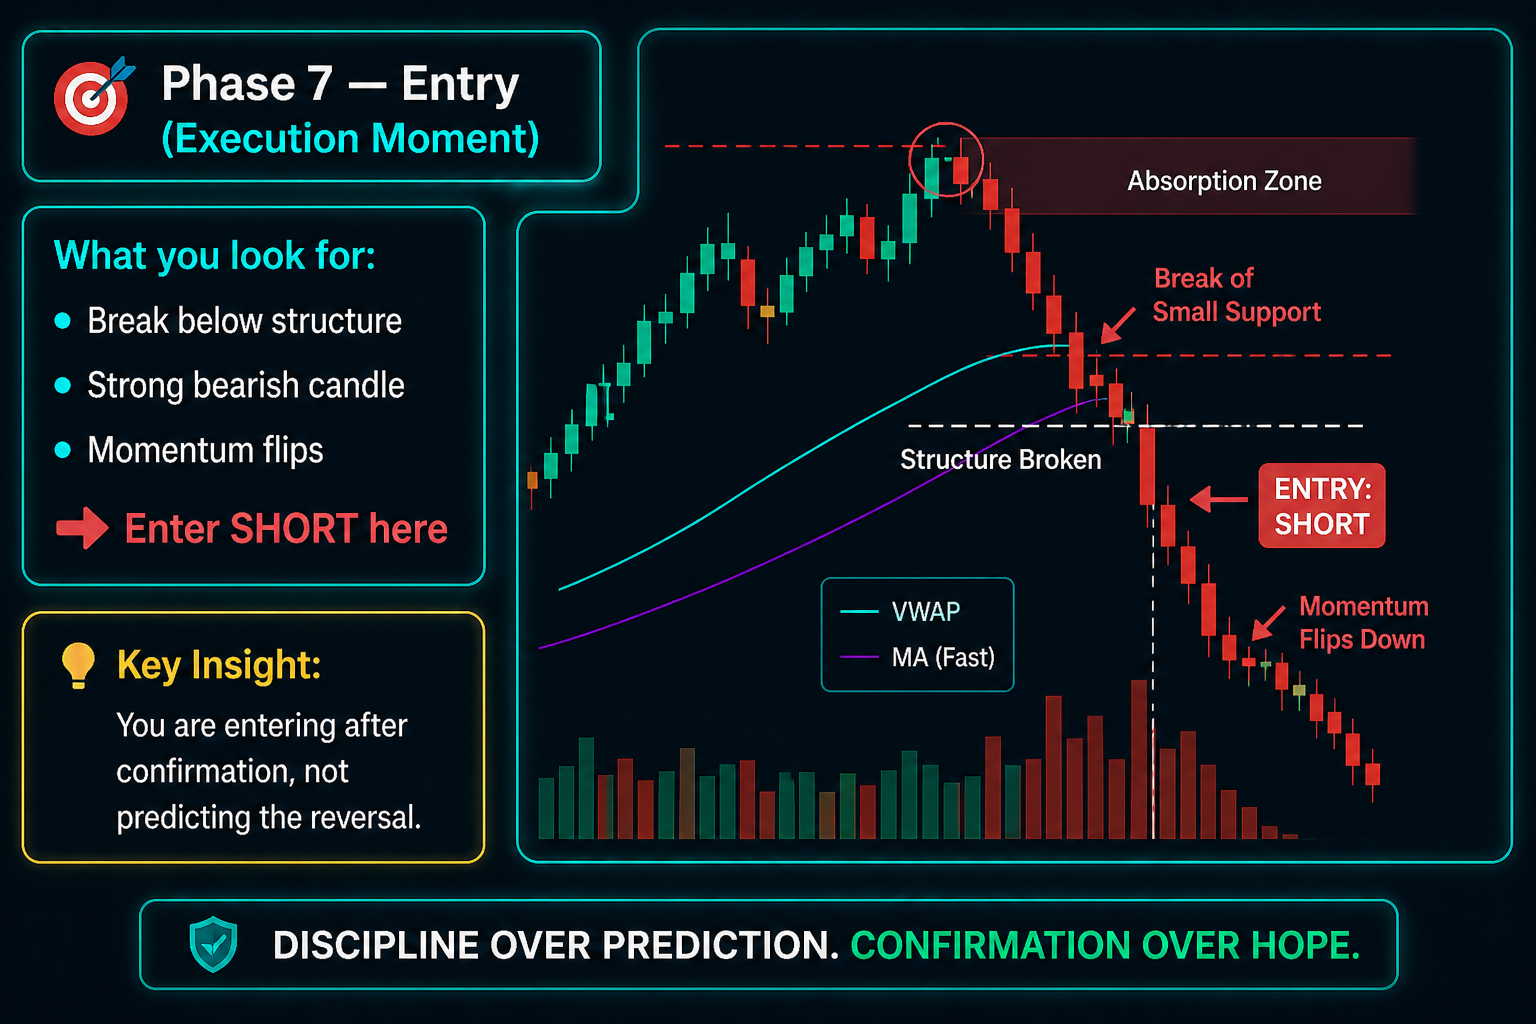
🎯 Phase 7 — Entry (Execution Moment)
What you look for:
- Break below structure
- Strong bearish candle
- Momentum flip
👉 Enter SHORT here
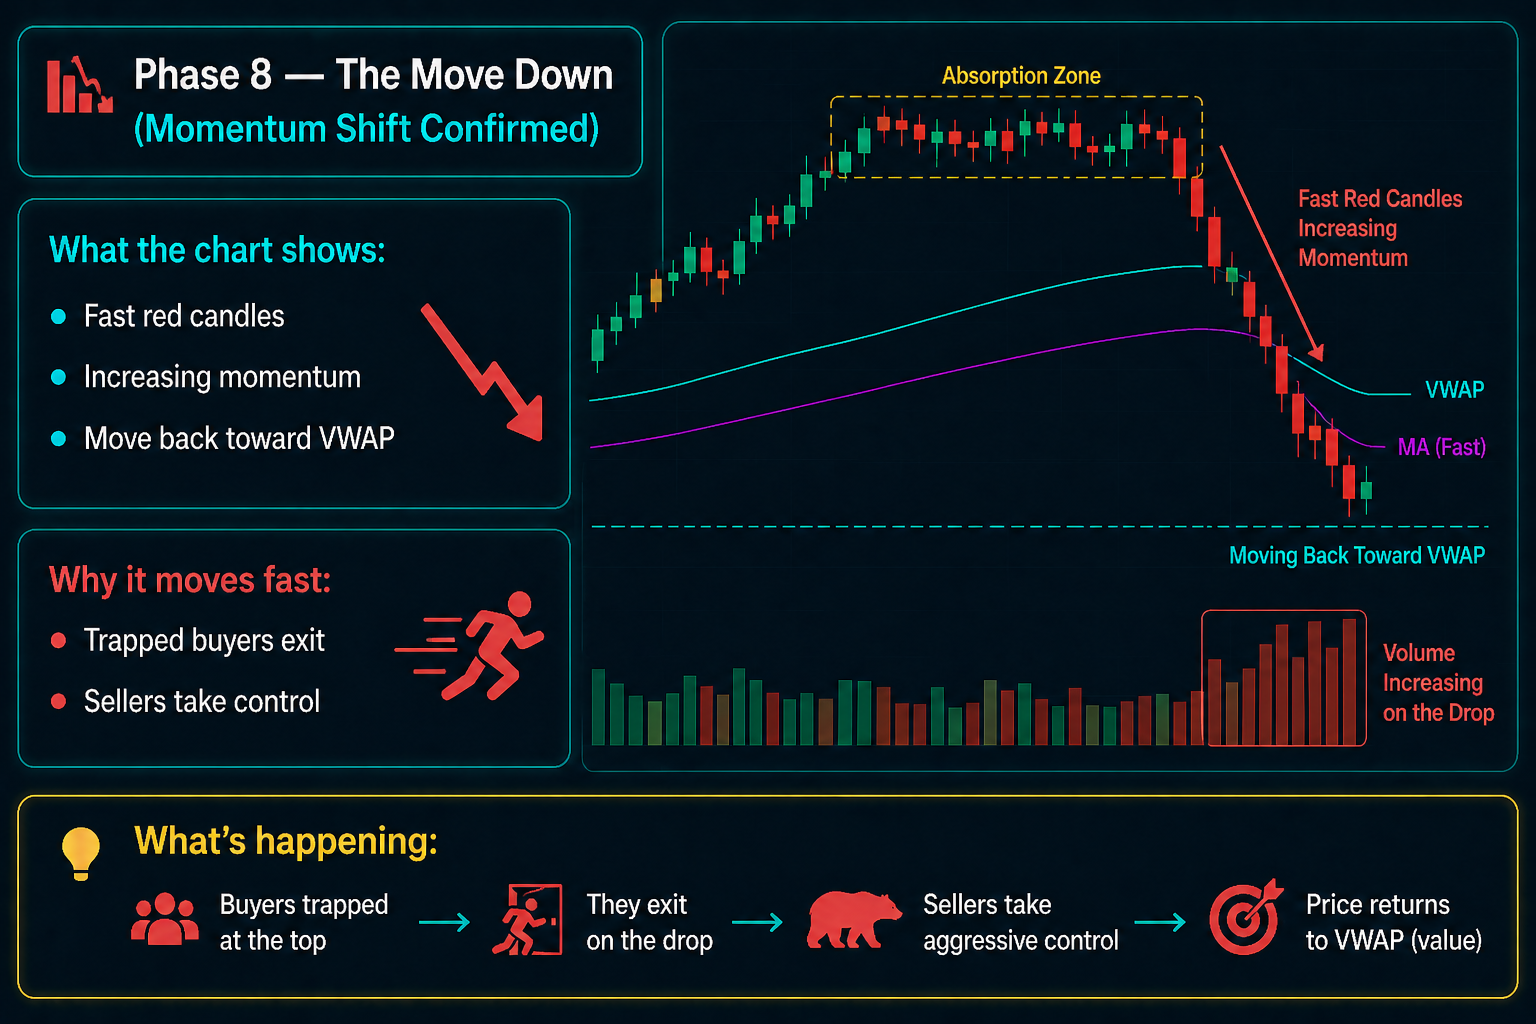
📉 Phase 8 — The Move Down
What the chart shows:
- Fast red candles
- Increasing momentum
- Move back toward VWAP
Why it moves fast:
- Trapped buyers exit
- Sellers take control

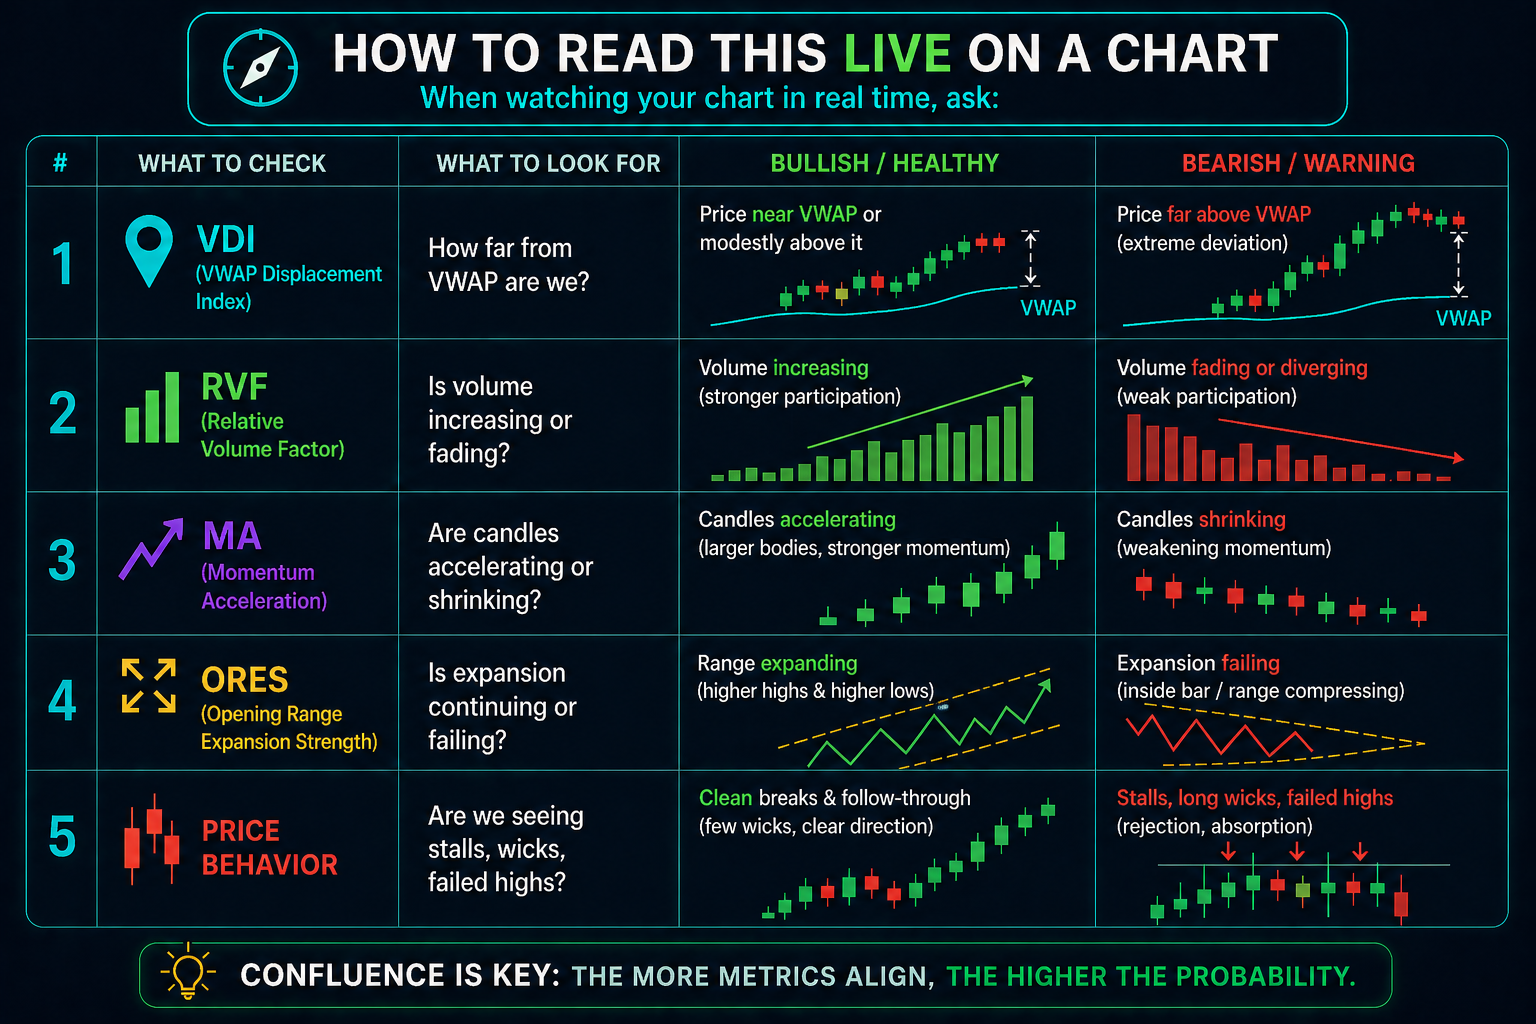
🧭 How to Read This LIVE on a Chart
When watching your chart in real time, ask:
1. VDI
- How far from VWAP are we?
2. RVF
- Is volume increasing or fading?
3. MA
- Are candles accelerating or shrinking?
4. ORES
- Is expansion continuing or failing?
5. Price Behavior
- Are we seeing stalls, wicks, failed highs?
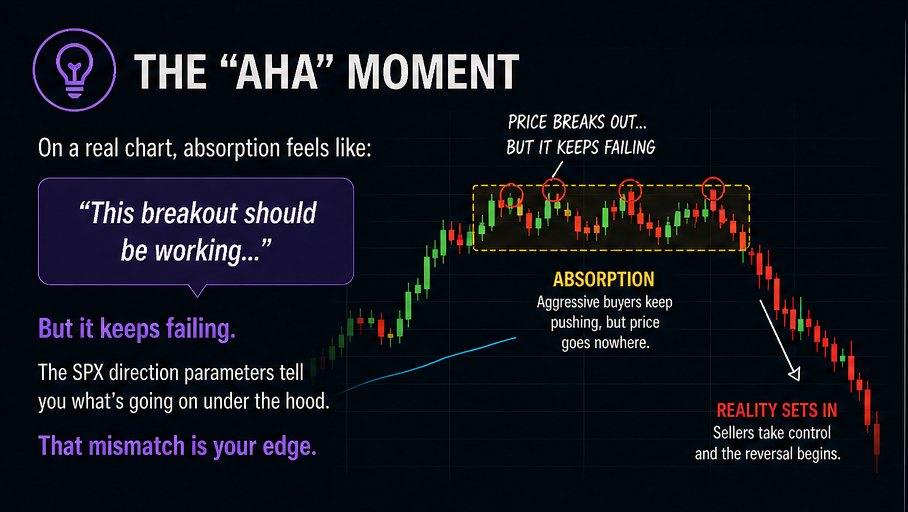
🔑 The “Aha” Moment
On a real chart, absorption looks like this:
- “This breakout should be working, but it keeps failing"
- Price is stalling. There is an evident mismatch between what should be happening and what is actually happening.
The SPX direction parameters tell you what's going on under the hood. This mismatch is your edge.
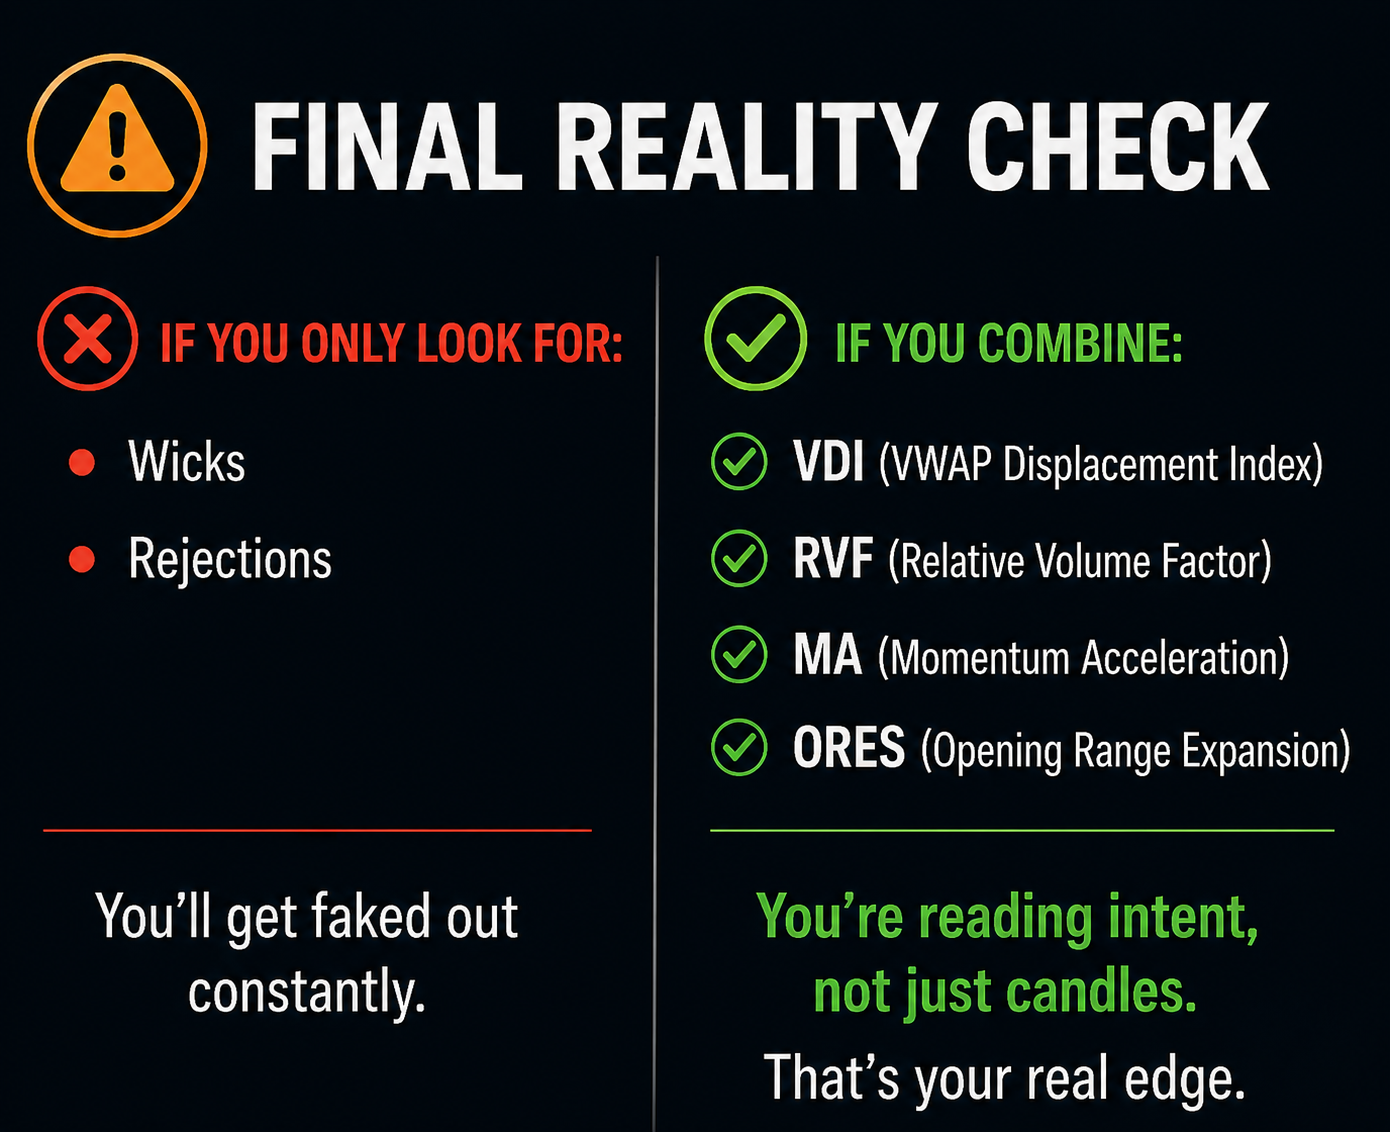
⚠️ Final Reality Check
If you only look for:
- Wicks
- Rejections
👉 You’ll get faked out constantly.
If on the other hand, you combine:
- VDI + RVF + MA + ORES
👉 You’re reading intent, not just candles